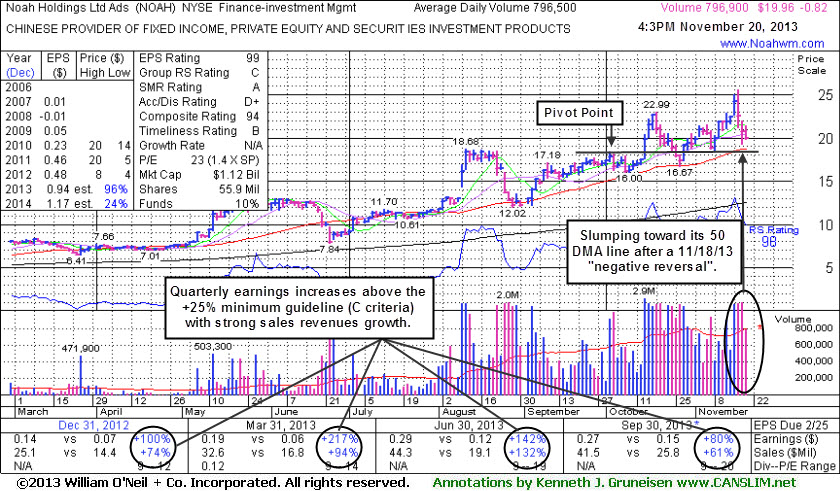
50-Day Average And Prior Highs Define Important Support - Wednesday, November 20, 2013
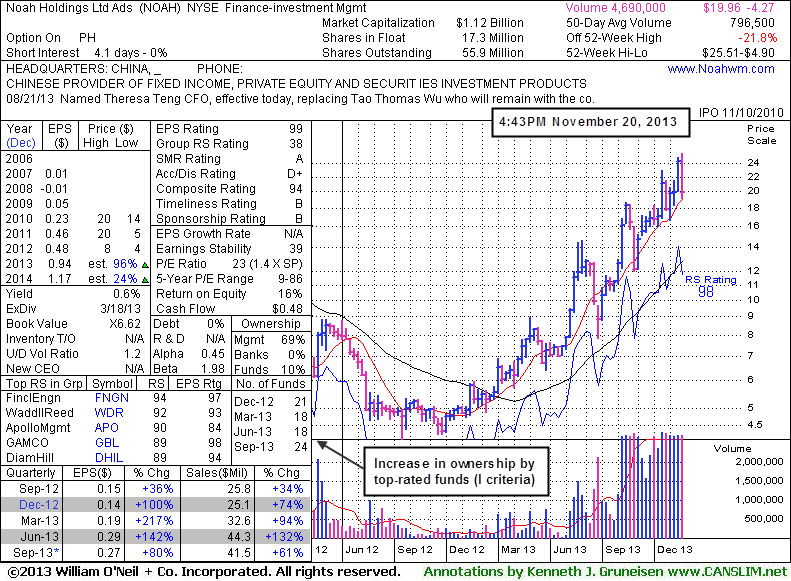
Noah Holdings Ltd (NOAH -$0.82 or -3.95% to $19.96) was down again today with average volume and ended -21.8% off its 52-week high as it slumped toward near-term support at its 50-day moving average (DMA) line. It was down with much heavier volume on Tuesday after a worrisome "negative reversal" on the prior session at its 52-week high. More damaging losses and technical deterioration would raise greater concerns. It had not formed a sound base during its recent consolidation and prior reports repeatedly cautioned members - "Disciplined investors avoid chasing stocks extended more than +5% above prior highs and always limit losses by selling if any stock falls more than -7% from their purchase price."
NOAH was last shown in this FSU section on 10/15/13 with annotated graphs under the headline, "Finished Strong With Gain on 4 Times Average Volume", as it finished strong after highlighted in yellow in the earlier mid-day report (read here). When rallying from a deep V-shaped cup with handle pattern there was no resistance due to overhead supply. It may go on to produce more climactic gains, but now it faces resistance up through the $25 area as overhead supply is likely to hinder its upward price progress. Meanwhile, any fresh buy candidate breaking out without overhead supply might be a more compelling stock to consider buying in the near-term.
The number of top-rated funds owning its shares rose from 18 in Mar '13 to 24 in Sep '13, a reassuring trend concerning the I criteria. Its current Up/Down Volume Ratio of 1.2 is also an unbiased indication that its shares have been under slight accumulation over the past 50 days. It reported earnings +80% on +61% sales revenues for the quarter ended September 30, 2013. Its strong sales revenues and earnings increases help this Chinese provider of investment products match the fact-based investment system's fundamental guidelines. The N criteria also is also supported by strong sales revenues increases - considered a sign that a new product or service has been in great demand. Its small supply (S criteria) of only 17.3 Million shares in the public float can contribute to greater price volatility in the event of institutional buying or selling.
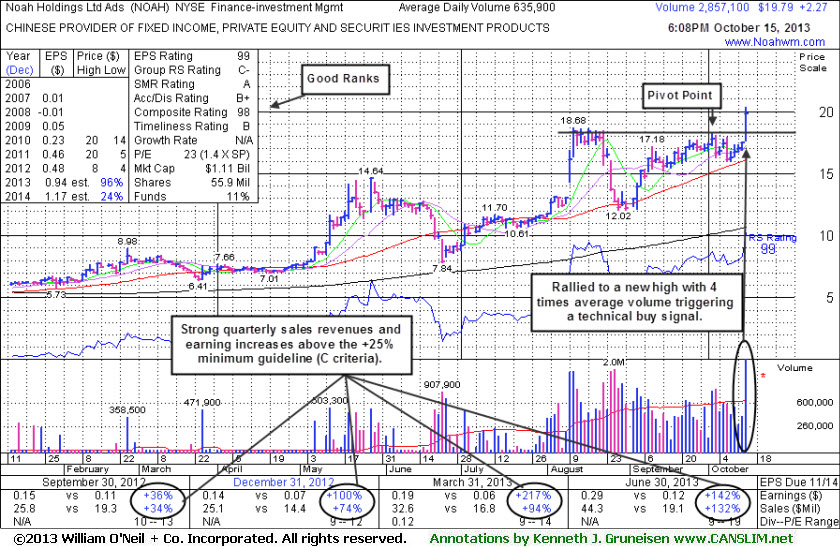
Finished Strong With Gain on 4 Times Average Volume - Tuesday, October 15, 2013
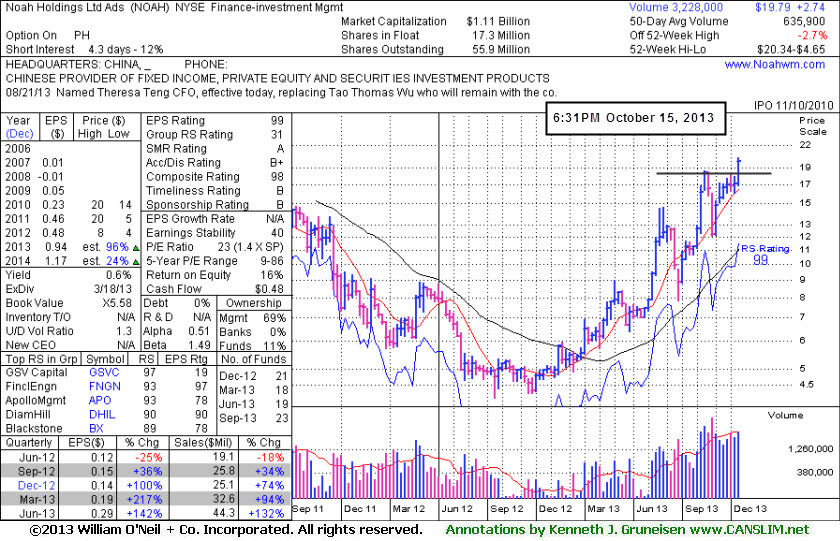
Noah Holdings Ltd (NOAH +$2.27 or +12.96% to $19.79) finished strong after highlighted in yellow in the earlier mid-day report (read here). It hit a new 52-week high with more than 4 times average volume behind today's considerable gain, its 5th consecutive gain. The breakout above its pivot point triggered a technical buy signal. Volume totals cooled in recent weeks. It found prompt support near its 50-day moving average (DMA) line during its deep V-shaped cup with handle pattern. No resistance remains due to overhead supply while blasting to new high (N criteria) territory.
The number of top-rated funds owning its shares rose from 18 in Mar '13 to 23 in Sep '13, a reassuring trend concerning the I criteria. Its current Up/Down Volume Ratio is also an unbiased indication that its shares have been under accumulation over the past 50 days. After it reported earnings +142% on +132% sales revenues for the second quarter of 2013 it was noted - "Strong sales and earnings acceleration helped this Chinese provider of investment products to better match the fact-based investment system's fundamental guidelines." The N criteria also is also supported by strong sales revenues increases - considered a sign that a new product or service has been in great demand. Its small supply (S criteria) of only 17.3 Million shares in the public float can contribute to greater price volatility in the event of institutional buying or selling.