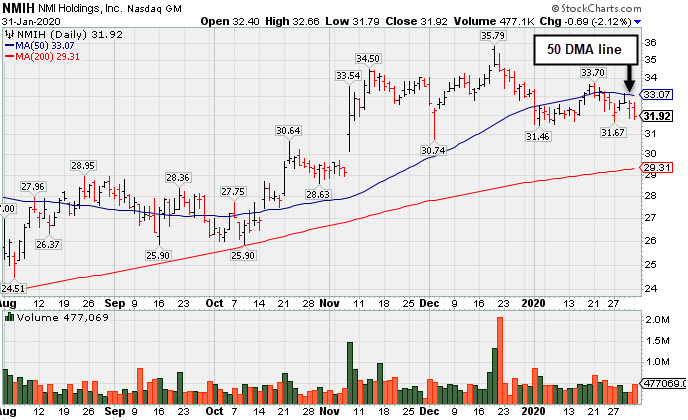
Sputtering Below 50-Day Moving Average Line Hurts Outlook - Friday, January 31, 2020
N M I Holdings Inc Cl A (NMIH -0.69 or -2.12% to $31.92) is still sputtering below its 50-day moving average (DMA) line ($33.07) after damaging volume-driven losses. A rebound above the 50 DMA line would help its outlook improve. Prior highs in the $30-31 area help define the next important near-term support, and that area has recently been being tested.
Keep in mind it is due to report earnings news on February 11th. Volume and volatility often increase near earnings news. NMIH reported earnings +54% on +42% sales revenues for the Sep '19 quarter, and prior quarterly comparisons were also well above the +25% minimum guideline (C criteria). After years of losses it had profitable years for FY '16, '17, and '18.
The Finance - Mortgage & Related Services firm was highlighted in yellow with pivot point cited based on its 6/10/19 high plus 10 cents in the 11/08/19 mid-day report (read here). NMIH was last shown in this FSU section on 1/10/20 with an annotated graph under the headline, "Outlook Hurt by Slump Below 50-Day Moving Average".
The number of top-rated funds owning an interest rose from 388 in Dec '18 to 456 in Dec '19, a reassuring sign concerning the I criteria. The current Up/Down Volume Ratio of 1.0 is as unbiased indication its shares have been neutral concerning accumulation/distribution over the past 50 days. It has a Timelines Rating of B and Sponsorship Rating of D.
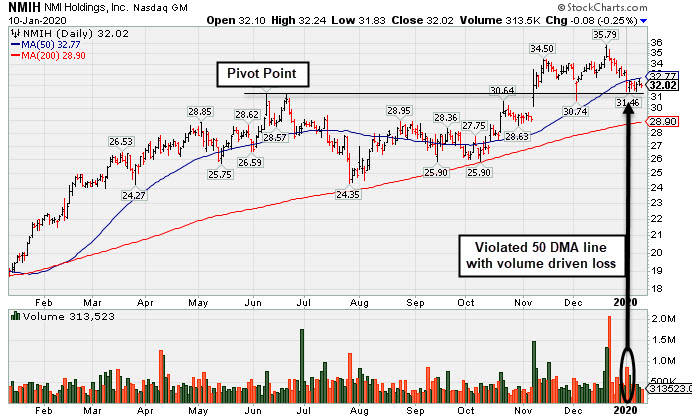
Outlook Hurt by Slump Below 50-Day Moving Average - Friday, January 10, 2020
N M I Holdings Inc Cl A (NMIH -$0.08 or -0.25% to $32.02) is still sputtering below its 50-day moving average (DMA) line ($32.66) after damaging volume-driven losses. A rebound above the 50 DMA line would help its outlook improve. Prior highs in the $30-31 area help define the next important near-term support, and that area is currently being tested.
Fundamentals remain strong. NMIH reported earnings +54% on +42% sales revenues for the Sep '19 quarter, and prior quarterly comparisons were also well above the +25% minimum guideline (C criteria). After years of losses it had profitable years for FY '16, '17, and '18.
The Finance - Mortgage & Related Services firm was highlighted in yellow with pivot point cited based on its 6/10/19 high plus 10 cents in the 11/08/19 mid-day report (read here). NMIH was last shown in this FSU section on 12/19/19 with an annotated graph under the headline, "Hit New High But Encountered Distributional Pressure".
The number of top-rated funds owning an interest rose from 388 in Dec '18 to 453 in Sep '19, a reassuring sign concerning the I criteria. The current Up/Down Volume Ratio of 1.2 is as unbiased indication its shares have been under accumulation over the past 50 days. It has a Timelines Rating of B and Sponsorship Rating of D.
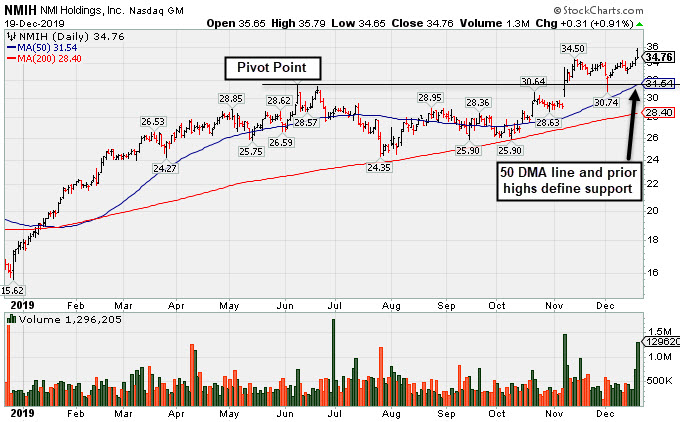
Hit New High But Encountered Distributional Pressure - Thursday, December 19, 2019
N M I Holdings Inc Cl A (NMIH $34.76 +$0.32 +0.91%) gapped up today and hit a new all-time high with heavier volume behind its 5th consecutive gain, but it finished near the session low, a sign it was encountering some distributional pressure. Its 50-day moving average (DMA) line ($31.54) defines important near-term support along with prior highs in the $30-31 area
NMIH reported earnings +54% on +42% sales revenues for the Sep '19 quarter, and prior quarterly comparisons were also well above the +25% minimum guideline (C criteria). After years of losses it had profitable years for FY '16, '17, and '18.
The Finance - Mortgage & Related Services firm was highlighted in yellow with pivot point cited based on its 6/10/19 high plus 10 cents in the 11/08/19 mid-day report (read here). NMIH was last shown in this FSU section on 11/27/19 with an annotated graph under the headline, "Holding Ground Stubbornly Near All-Time High".
The number of top-rated funds owning an interest rose from 388 in Dec '18 to 441 in Sep '19, a reassuring sign concerning the I criteria. The current Up/Down Volume Ratio of 1.6 is as unbiased indication its shares have been under accumulation over the past 50 days. It has a Timelines Rating of A and Sponsorship Rating of D.
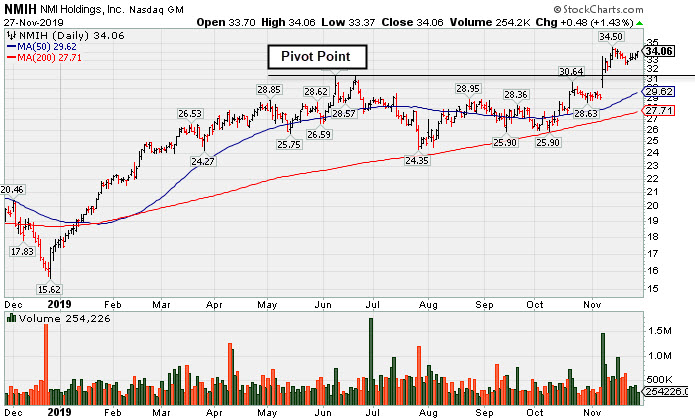
Holding Ground Stubbornly Near All-Time High - Wednesday, November 27, 2019
N M I Holdings Inc Cl A (NMIH +$0.48 or +1.43% to $34.06) posted a 5th consecutive small gain with below average volume. Volume totals have generally been cooling while holding its ground stubbornly after rising above its "max buy" level with gains backed by above average volume.
NMIH reported earnings +54% on +42% sales revenues for the Sep '19 quarter, and prior quarterly comparisons were also well above the +25% minimum guideline (C criteria). After years of losses it had profitable years for FY '16, '17, and '18.
The Finance - Mortgage & Related Services firm was highlighted in yellow with pivot point cited based on its 6/10/19 high plus 10 cents in the 11/08/19 mid-day report (read here). Technically, it had broken out on the prior session with a gain backed by +273% above average volume hitting a new all-time high. It was shown with an annotated graph under the headline, "Hit New High With Volume-Driven Gains".
The number of top-rated funds owning an interest rose from 388 in Dec '18 to 457 in Sep '19, a reassuring sign concerning the I criteria. The current Up/Down Volume ratio of 1.2 is as unbiased indication its shares have been under accumulation over the past 50 days. It has a Timelines Rating of A and Sponsorship Rating of D.
 X
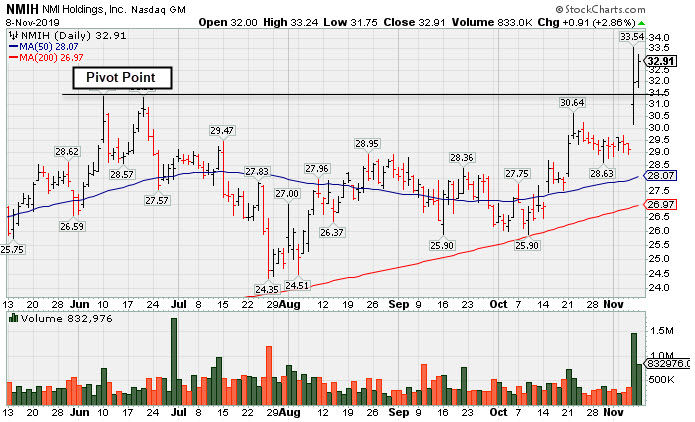
XHit New High With Volume-Driven Gains - Friday, November 8, 2019
N M I Holdings Inc Cl A (NMIH +$0.91 or +2.86% to $32.91) was highlighted in yellow with pivot point cited based on its 6/10/19 high plus 10 cents in the earlier mid-day report (read here). Technically it broke out on the prior session with a gain backed by +273% above average volume hitting a new all-time high. It tallied another big volume-driven gain today.
Bullish action came after it reported earnings +54% on +42% sales revenues for the Sep '19 quarter. Prior quarterly comparisons were also well above the +25% minimum guideline (C criteria). After years of losses it had profitable years for FY '16, '17, and '18.
The number of top-rated funds owning an interest rose from 388 in Dec '18 to 456 in Sep '19, a reassuring sign concerning the I criteria. It has a Timelines Rating of B and Sponsorship Rating of D.