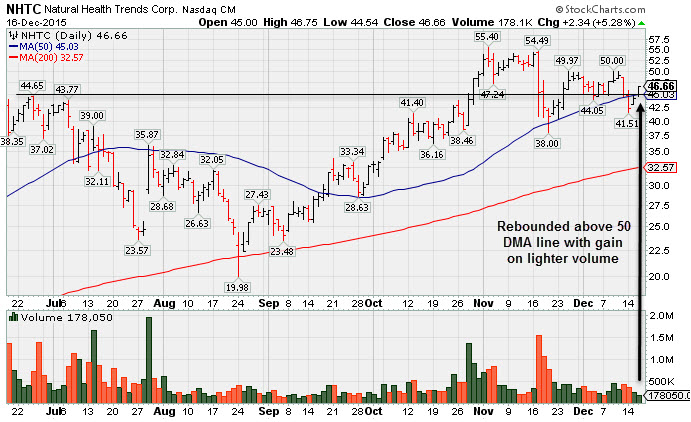
Natural Health Trends (NHTC +$2.34 or +5.28% to $46.66) posted a gain with less volume as it rebounded above its 50-day moving average (DMA) line. Prior resistance may now act as support. After triggering a technical sell signal, the prompt rebound above the 50 DMA line helped its outlook improve. However, there is overhead supply up through the $55 level which may hinder its ability to rally for substantial gains for the near term.
NHTC was last shown in this FSU section on 11/27/15 with an annotated graph under the headline, "After Successful Test of 10-Week Average a Valid Secondary Buy Point Exists". Volume-driven gains in late October triggered a technical buy signal shortly after it was highlighted in yellow with new pivot point cited based on its 6/25/15 high plus 10 cents in the 10/23/15 mid-day report (read here). Members were then reminded - "Convincing signs of fresh institutional buying demand might mark the beginning of a substantial new leg up in price."
The high-ranked Cosmetics / Personal Care firm reported Sep '15 quarterly earnings +181% on +154% sales revenues versus the year ago period, continuing its track record of strong sales and earnings increases well above the +25% minimum guideline (C criteria). Earnings rose +767%, +513%, +250%, +221%, +108%, and +100% in the Mar, Jun, Sep, Dec '14, Mar and Jun '15 quarters, versus the year earlier periods, respectively. Sales revenues rose +168%, +223%, +124%, 85%, +76%, and +104% during than span.
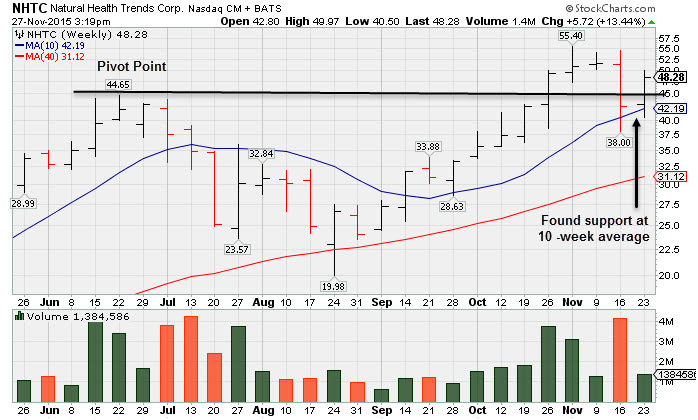
Natural Health Trends (NHTC +$0.41 or +0.86% to $48.28) posted a gain on light volume Friday. A new pivot point was not noted because its consolidation is not a sufficient length base pattern, however its color code was changed to yellow while a valid "secondary buy point" was recently noted.
In the Master's class they teach that if you miss an earlier technical breakout a valid secondary buy point may present itself before a sound new base forms. Following an earlier breakout, upon a pullback and its first successful test of the 10 WMA line a stock can be bought from there up to +5% above the latest high. In this case the latest high was $55.45 X 1.05 = $58.22. Risk increases the further away from a sound base that any stock is bought, however, and odds are less favorable when investors buy pullbacks as opposed to buying in on fresh breakouts.
NHTC was last shown in this FSU section on 11/10/15 with an annotated graph under the headline, "Wedging Higher Following Volume-Driven Breakout". Volume-driven gains in late October triggered a technical buy signal shortly after it was highlighted in yellow with new pivot point cited based on its 6/25/15 high plus 10 cents in the 10/23/15 mid-day report (read here). Members were then reminded - "Convincing signs of fresh institutional buying demand might mark the beginning of a substantial new leg up in price."
The high-ranked Cosmetics / Personal Care firm reported Sep '15 quarterly earnings +181% on +154% sales revenues versus the year ago period, continuing its track record of strong sales and earnings increases well above the +25% minimum guideline (C criteria). Earnings rose +767%, +513%, +250%, +221%, +108%, and +100% in the Mar, Jun, Sep, Dec '14, Mar and Jun '15 quarters, versus the year earlier periods, respectively. Sales revenues rose +168%, +223%, +124%, 85%, +76%, and +104% during than span.
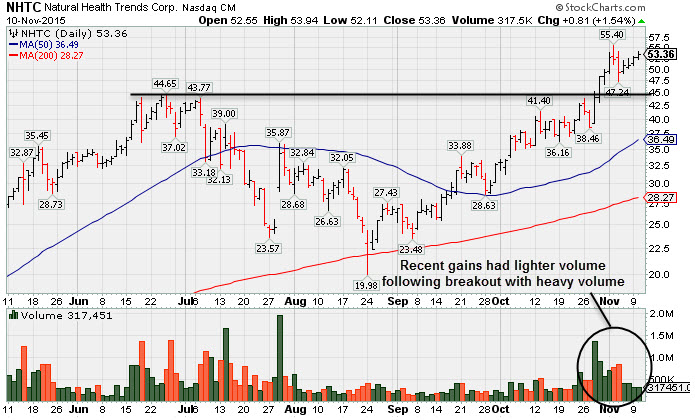
Natural Health Trends (NHTC +$0.81 or +1.54% to $53.36) is perched near its all-time high after 4 consecutive gains on lighter volume totals. It faces no overhead supply up to act as resistance. Disciplined investors avoid chasing stocks extended more than +5% above prior highs and always limit losses by selling any stock that falls more than -7% from their purchase price.
Volume-driven gains triggered a technical buy signal after it was last shown in this FSU section on 10/23/15 with an annotated graph under the headline, "Finished Strong But Approaching Prior Resistance". It was highlighted in yellow with new pivot point cited based on its 6/25/15 high plus 10 cents in the 10/23/15 mid-day report (read here). Convincing signs of fresh institutional buying demand might mark the beginning of a substantial new leg up in price.
The high-ranked Cosmetics / Personal Care firm reported Sep '15 quarterly earnings +181% on +154% sales revenues versus the year ago period, continuing its track record of strong sales and earnings increases well above the +25% minimum guideline (C criteria). Earnings rose +767%, +513%, +250%, +221%, +108%, and +100% in the Mar, Jun, Sep, Dec '14, Mar and Jun '15 quarters, versus the year earlier periods, respectively. Sales revenues rose +168%, +223%, +124%, 85%, +76%, and +104% during than span.
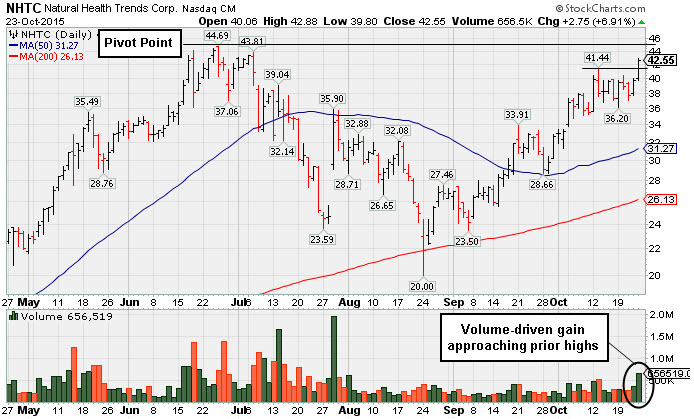
Natural Health Trends (NHTC +$2.75 or +6.91% to $42.55) rose above recent highs and was highlighted in yellow with new pivot point cited based on its 6/25/15 high pus 10 cents in the earlier mid-day report (read here). Subsequent volume-driven gains for new highs are still needed to trigger a proper technical buy signal. It has been making progress through resistance, but still faces some overhead supply up through the $44 level. Patience and discipline are paramount. A move to new highs would be a convincing sign of fresh instituitional buying demand that might mark the beginning of a substantial new leg up in price. The high-ranked Cosmetics / Personal Care firm's shares found support at the 200 DMA line during a deep 4-month cup shaped base.
Keep in mind it is due to report Sep '15 quarterly earnings on Tuesday, 10/27/15, and volume and volatility often increase near earnings news. The Dallas, TX based firm has only 7.80 million shares (S criteria) in the public float, which also may contribute to greater price volatility. Quarterly comparisons through Jun '15 showed strong sales and earnings increases well above the +25% minimum guideline (C criteria). Earnings rose +767%, +513%, +250%, +221%, +108%, and +100% in the Mar, Jun, Sep, Dec '14, Mar and Jun '15 quarters, verus the year earlier periods, respectively. Sales revenues rose +168%, +223%, +124%, 85%, +76%, and +104% during than span.