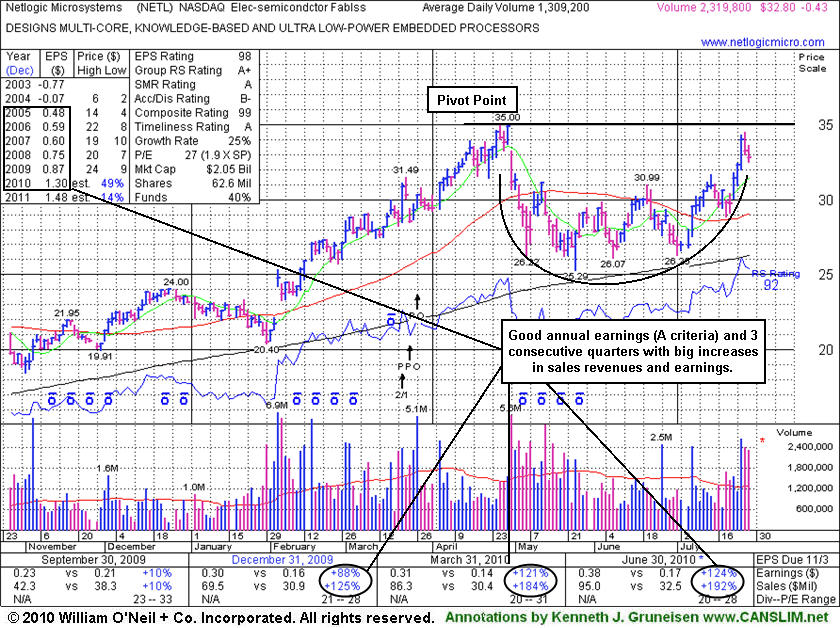
Netlogic MicroSystems Inc. (NETL -$0.43 or -1.29% to $32.80) was featured in yellow in today's mid-day report (read here) while trading within close striking distance of less than -5% from its 52 week high, working on the right side of a 12-week cup shaped pattern without yet forming a proper handle. It faces no remaining resistance due to overhead supply. Volume and volatility often increase near earnings news and it was noted in recent mid-day reports - "Earnings news is expected on Wednesday."
Following the close today it reported very strong results for the quarter ended June 30, 2010, marking its 3rd consecutive quarter of sales and earnings increases solidly above the +25% minimum guideline. It has also maintained a good annual earnings growth history, so today the C and A criteria are both solidly satisfied, despite its negative comparisons in the Dec '08, and Mar, Jun '09 quarters versus the year ago periods. The number of top-rated funds owning its shares increased from 115 in Sept '09 to 142 in Jun '10, which is a very reassuring sign concerning the I criteria.
The stock is acting healthy and should remain on an active watch list until the stock triggers a fresh technical buy signal which requires gains above its pivot point backed by at least +50% above average volume. Remember to always limit losses per the 7-8% sell rule, and never hold a stock if it falls more than that from your purchase price. Based on weak technical action NETL was dropped from the Featured Stocks list on 7/11/08, and it subsequently fell from $31.73 to as low as $7.21 before rebounding impressively.
Statistically, about 40% of winning stocks will pull back after breaking out. In other words, it is not uncommon for stocks to pullback and retest support near their pivot point after breaking out. It is important to see the bulls show up and offer support at or above the pivot point. This may offer investors a chance to increase their exposure before the stock continues advancing. However, an important caveat is that volume should contract as the stock pulls back towards its pivot point. Heavy volume behind losses can be cause for concern, especially if the stock does not find support at its pivot point. Whenever a recent breakout is completely negated by a loss that leads to a close back in the prior base, this is construed as a technical sell signal and a sign that the bears are regaining control.
Netlogic MicroSystems Inc. (NETL -$1.56 or -4.50% to $36.20) closed lower on average volume as this high-ranked stock pulled back toward a test of support near its recent chart highs in the $36 area. NETL sports strong ranks; its Earnings Per Share (EPS) rating and Relative Strength (RS) rating are both 95. This stock was recently featured on Friday, May 30, 2008 in the CANSLIM.net Mid Day Breakouts Report (read here) a $38.79 pivot point and a $40.73 maximum buy price and the following note: "Y - Recent gains on heavy volume have helped it rally to challenge its 52-week high in the $38 area. It has a good annual earnings history (good A criteria) and, after 4 lackluster reports, in the 2 latest quarterly comparisons (the C criteria) the company showed much stronger sales revenues and earnings increases. Last covered in detail in the 5/2/06 CANSLIM.net After Market Update (read here) as it was being dropped from the CANSLIM.net Featured Stocks list." The stock is still acting healthy and should remain on an active watch list until the market produces a new follow-through day and the stock triggers a fresh technical buy signal which requires gains above its pivot point backed by at least +50% above average volume. Remember to always limit losses per the 7-8% sell rule, and never hold a stock if it falls more than that from your purchase price.
C A N S L I M | StockTalk | News | Chart | SEC | Zacks Reports | ![]()
![]()
![]()

View all notes | Alert me of new notes | CANSLIM.net Company Profile

After a stock breaks out, it is imperative to continue monitoring its daily and weekly price and volume patterns for any possible ailments that may develop. Every so often, there are a few ominous technical signals that emerge. Prudent investors have learned to identify them due to the fact that they tend to lead to lower prices. One of these disconcerting technical signals is called a negative reversal.
A negative reversal occurs when a stock opens up the session heading higher but then reverses and ultimately closes lower. Reversals are often considered more severe if the stock's initial gains lift it to a new high, but it then reverses and closes for a loss on heavier than average volume and ends near the session's utmost lows. Negative reversals can occur on a daily, weekly and monthly chart. In general, the longer the time frame involved, the more concern is prompted by the severity of the reversal. Volume is directly correlated with the severity as well.
NetLogic Microsystems Inc. (NETL -$2.6 or -6.19% to $39.43) negatively reversed on above average volume today, an ominous sign, especially considering that it had initially rallied to a new record high. It seems to be a continuation of the pressure it encountered on Monday, April 3rd, where early gains were quickly erased and turned into a loss while volume expanded. The action is considered to be indicative of distributional action or institutional selling. Now trading below the $39.57 pivot point, the technical breakout has been negated. This issue was featured on Tuesday, March 28, 2006 in the CANSLIM.net Mid Day Breakouts Report (read here) as it was breaking out through its $39.57 pivot point on above average volume. The next very important level to watch for support is at its 50-day moving average (DMA) line, which closely coincides with the lower boundary of its upward trendline drawn by connecting the October-March chart lows. If the $36 level is violated it would be considered a more serious technical sell signal.

A classic example of the success enjoyed by many CANSLIM.net readers usually starts when an investor reads a CANSLIM.net report and buys a featured stock before it has risen above the pivot point by greater than 5%. After a stock breaks out above its pivot point, there is only a +5% window that investors have to purchase the stock under the proper guidelines. Once a stock rises above the "maximum buy price" the risk of a shake out balloons, meaning that even a normal retracement in the stock might force you to employ the 7-8% loss cutting rule. Much can be told by the stock's daily action in the weeks and months that follow a breakout. Typically, a light volume and orderly pullback suggests that the bulls remain in control. However, high volume pullbacks that violate support paint a totally different picture.
NetLogic Microsystems Inc. (NETL +$1.75 or +4.09% to $41.00) broke out of nice 9-week base on Tuesday, then followed through with more meaningful gains on massive volume Wednesday. This stock was featured on Tuesday, March 28th, 2006 in the CANSLIM.net Mid Day Breakouts Report (read here) with a pivot point of $39.57 and a maximum buy price of $41.55. Thus far, this is a textbook example how a stock should behave after it breaks out. Volume, a key indicator of institutional demand, has ballooned behind the additional gains into new high territory. This is a positive sign as the stock marches higher. There are two cautionary remarks worth including. First, it has a limited annual earning history, leaving some questions concerning the "A" criteria, whereas most great winners had demonstrated a steady history of annual earnings growth. Also, this stock has already advanced considerably since it started with a breakout from a first stage base back in March 2005. It may now be considered to be breaking out of a fourth stage base, and late stage bases have been pointed out many times before as being more failure prone. Provided that proper sell discipline is adhered to, risk can be minimized.
