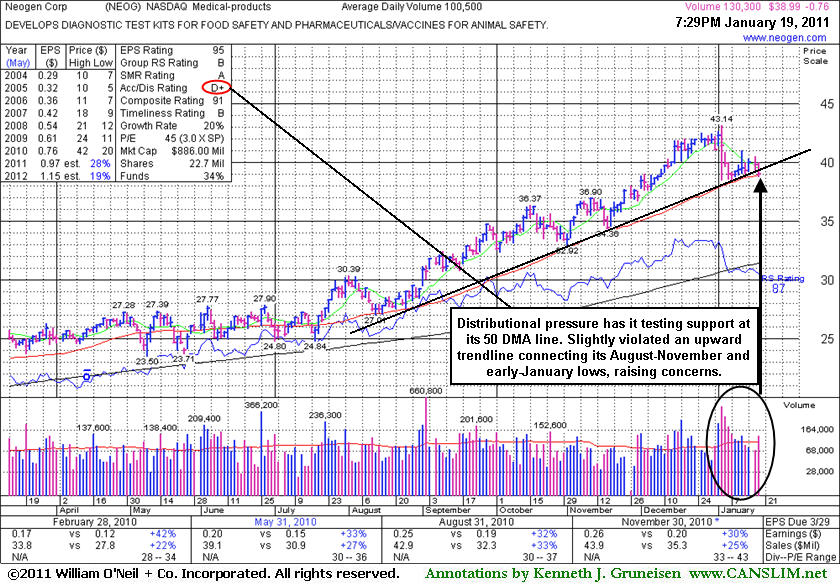
Neogen Corp. (NEOG -$0.76 or -1.91% to $38.99 suffered a loss today with above average volume, slumping near its 50-day moving average (DMA) line which has been a reliable support level during past consolidations. Its Accumulation/ Distribution rating has slumped to a D+ (see red circle) from a B rating since last appearing in this FSU section on 12/06/10 under the headline "50-Day Moving Average Line Acted As Solid Support Level". It went on to rally to new all-time highs as much as +40% above its 9/01/10 price when highlighted in yellow as a noteworthy buy candidate. Distributional pressure has it now testing support at its 50 DMA line. It has slightly violated an upward trendline connecting its August-November and early-January lows, raising additional concerns.
NEOG has a history of steady annual earnings growth (A criteria). The 4 most recent quarterly comparisons have shown accelerating sales revenues growth with earnings per share increases above the investment system's +25% guideline. Years ago, this stock was first featured on Thursday, February 21, 2008 in the CANSLIM.net Mid Day Breakouts Report (read here) and it was later dropped from the Featured Stocks list.
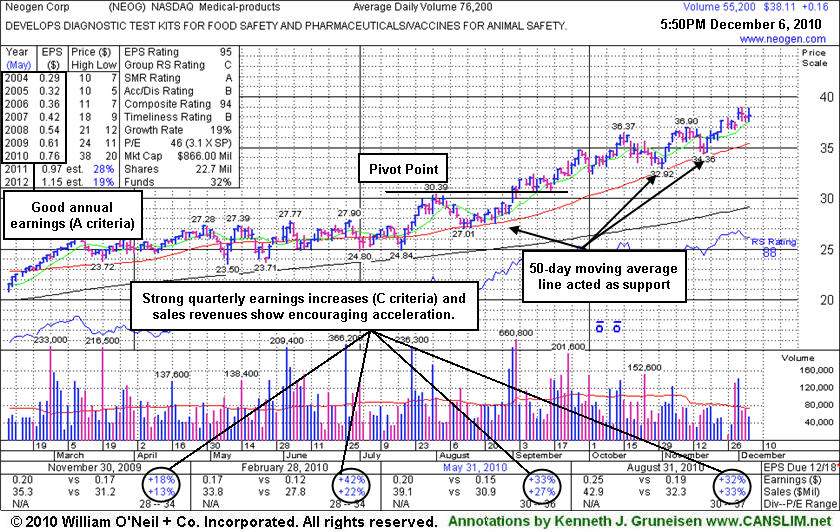
Neogen Corp. (NEOG +$0.16 or +0.42% to $38.11) is holding its ground stubbornly near all-time highs, extended from any sound base after steadily advancing. Since its last appearance in this FSU section on 10/13/10 under the headline "Leader Hits Another All-Time High" its 50-day moving average (DMA) line has been a reliable support level when consolidating. NEOG has a history of steady annual earnings growth (A criteria). The 4 most recent quarterly comparisons have shown accelerating sales revenues growth with earnings per share increases above the investment system's +25% guideline. Years ago, this stock was first featured on Thursday, February 21, 2008 in the CANSLIM.net Mid Day Breakouts Report (read here) and it was later dropped from the Featured Stocks list.
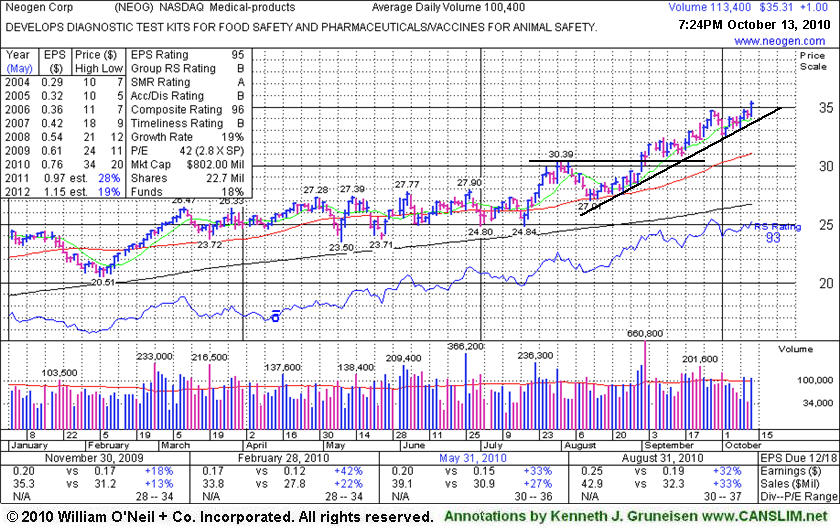
Neogen Corp. (NEOG +$1.00 or +2.91% to $35.31) posted a considerable gain today with near average volume, hitting another new all-time high. An upward trendline connecting its August - October lows defines an initial support level to watch. Below that, its 50-day moving average line and prior highs in the $30 area coincide and define chart support. Since its last appearance in this FSU section on 8/20/10 under the headline "Healthy Consolidation May Offer Secondary Buy Point" it has gotten extended from its prior highs.
NEOG has a history of steady annual earnings growth (A criteria). The 3 most recent quarterly comparisons have shown accelerating sales revenues growth with earnings per share increases above the investment system's +25% guideline. If shares purchased at higher levels ever turn into losses, remember to always limit losses per the 7-8% sell rule, and never hold a stock if it falls more than that much from your purchase price. Years ago, this stock was first featured on Thursday, February 21, 2008 in the CANSLIM.net Mid Day Breakouts Report (read here) and it was later dropped from the Featured Stocks list.
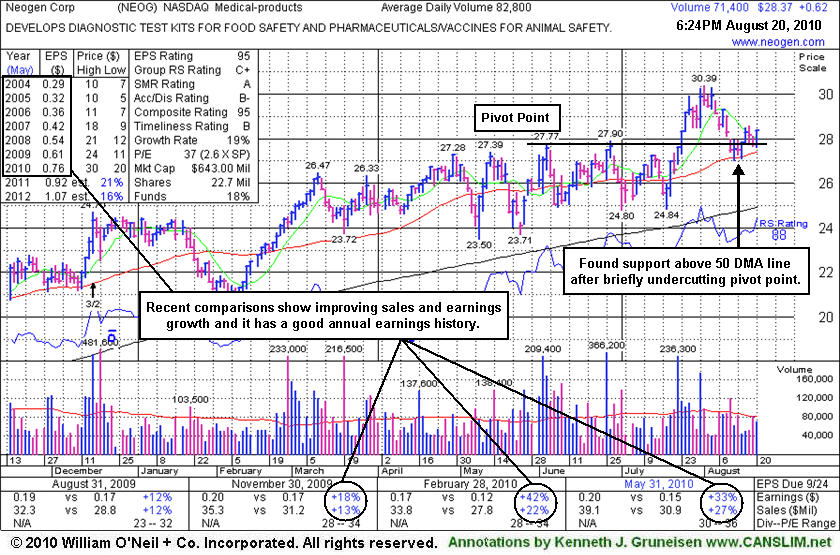
Neogen Corp.'s (NEOG +$0.62 or +2.23% to $28.37) color code was changed to yellow while consolidating in a healthy fashion just above its 50 DMA line and prior highs in the $27 area defining important technical support. Disciplined investors might consider accumulating shares on its pullback as a secondary buy point. However, weakening market conditions (M criteria) are a current concern and would argue against new buying efforts if further technical damage occurs to the major indices and this stock specifically, or both.
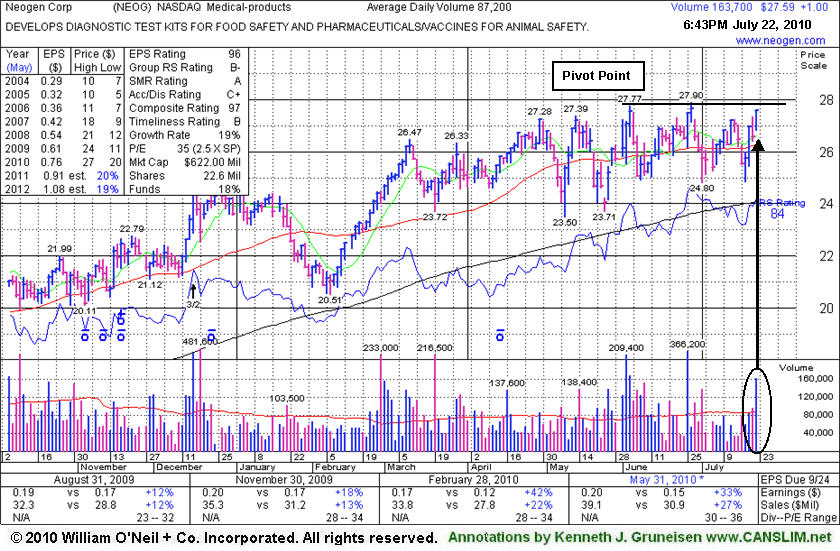
Its solid gain on nearly 2 times average volume resulted in it being featured in yellow the 7/22/10 mid-day report (read here) and its FSU section appearance under the headline Medical - Products Firm Returns To Featured Stocks List when it was noted - "Now it faces no resistance due to overhead supply." It went on to get extended from its prior highs and later endured some mild distributional pressure.
NEOG has a history of steady annual earnings growth (A criteria). The 2 most recent quarterly comparisons have shown improving sales revenues growth with earnings per share increases above the investment system's +25% guideline. Remember to always limit losses per the 7-8% sell rule, and never hold a stock if it falls more than that much from your purchase price. Years ago, this stock was first featured on Thursday, February 21, 2008 in the CANSLIM.net Mid Day Breakouts Report (read here) and it was later dropped from the Featured Stocks list.
Neogen Corp. (NEOG +$1.00 or +3.76% to $27.59) closed at the session high today with a solid gain on nearly 2 times average volume after featured in yellow the mid-day report (read here). Since last noted in the mid-day report on 6/18/10 it has been churning near all-time highs. The pivot point cited is based upon its June 3, 2010 high plus ten cents. Its brief rally above that mark on 6/28/10 lacked volume and then it endured distributional pressure. Now it faces no resistance due to overhead supply. NEOG has a history of steady annual earnings growth (A criteria). The 2 most recent quarterly comparisons have shown improving sales revenues growth with earnings per share increases above the investment system's +25% guideline. The stock is still building a long flat base and should remain on an active watch list until the stock triggers a fresh technical buy signal. Remember to always limit losses per the 7-8% sell rule, and never hold a stock if it falls more than that much from your purchase price. Years ago, this stock was first featured on Thursday, February 21, 2008 in the CANSLIM.net Mid Day Breakouts Report (read here) and it was later dropped from the Featured Stocks list.
A very important technical tool that savvy investors have learned to incorporate in their technical analysis is the 200-day moving average (DMA) line. The 200 DMA line plays a pivotal role relative to a stock's price. If the price of a stock is above its 200 DMA then odds are that its 200 DMA will act as longer term support. Conversely, if the price is below its 200 DMA then the moving average acts as resistance. Obviously, if a technical breakdown or violation takes place on heavy volume it is a more serious concern. Sometimes quiet violations are repaired quickly, without a lot of additional losses. However, the key moving averages are always an important line to watch.
Neogen Corp. (NEOG -$0.49 or -1.99% to $25.16) has been finding support near its 200 DMA line in recent weeks while building out a long 8 month flat base. NEOG sports strong ranks; an Earnings Per Share (EPS) rating of 86, and a Relative Strength (RS) rating of 82. This stock was first featured on Thursday, February 21, 2008 in the CANSLIM.net Mid Day Breakouts Report (read here) a $27.74 pivot point and a $29.13 maximum buy price and the following note: "Y - Gapped up today and briefly reached a new all-time high with gains on above average volume before pulling back considerably off its highs. Very little resistance now remains due to the fact it is less than -4% under its all-time high after blasting up from its 50 DMA line on 2/20/08 with heavy volume gains. It had a steady uptrend for many months in 2007 where it rested above support at its 50 DMA line, but during the broader market's correction in January it violated its 50 DMA line and tested support near its 200 DMA line. It has shown steady annual earnings growth and its quarterly earnings increases have been borderline, but not especially impressive (for the C and A criteria) in respect to the system's +25% guideline." After it was featured, however, the stock quickly rolled over and fell back into its prior base. The stock is still building a long flat base and should remain on an active watch list until the market produces a new follow-through day and the stock triggers a fresh technical buy signal. Remember to always limit losses per the 7-8% sell rule, and never hold a stock if it falls more than that from your purchase price.
C A N S L I M | StockTalk | News | Chart | SEC | Zacks Reports | ![]()
![]()
![]()

View all notes | Alert me of new notes | CANSLIM.net Company Profile
A very important technical tool that savvy investors have learned to incorporate in their technical analysis is the 50-day moving average (DMA) line. The 50 DMA line plays a pivotal role relative to a stock's price. If the price of a stock is above its 50 DMA then odds are that its 50 DMA will act as formidable support. Conversely, if the price is below its 50 DMA then the moving average acts as resistance. Healthy stocks sometimes trade under their 50 DMA lines briefly, but usually a strong candidate will promptly bounce and repair a 50 DMA violation. When a stock has violated its 50 DMA line and then lingers beneath it, the stock's outlook gets worse and worse as it spends a greater period of time trading under that important short-term average line. Once the 50 DMA line starts sloping downward it should also be acknowledged that the stock has been struggling for a while, and it might be time to reduce exposure and look for places to put that money to work in stronger buy candidates.
Neogen Corp (NEOG +$1.17 or +4.64% to $26.38) climbed back above its 50 DMA line with a gain on lighter than average volume today.
On Tuesday, March 25, 2008 the company is due to report earnings for the latest quarter ended February 29, 2008. Earnings news often contributes to greater than usual volume and volatility, so it will be very important to watch the stock closely and trade accordingly. Any losses leading to a breach of its latest chart low ($24.50) or a violation of its 200 DMA line ($23.52 now) would raise concerns and trigger technical sell signals. Meanwhile, gains on at least +50% above average volume leading to new high closes could trigger new technical buy signals. Since NEOG was featured on Thursday, February 21, 2008 in the CANSLIM.net Mid Day Breakouts Report (read here); it had triggered a technical buy signal but failed to follow through into new high ground. Soon thereafter, it slumped back under its pivot point, and below its 50 DMA line, raising concerns. It still maintains a healthy 85 Earnings Per Share (EPS) rank and impressive 96 Relative Strength (RS) rank. It faces little resistance from overhead supply, sitting perched just -7.4% off its high now.C A N S L I M | StockTalk | News | Chart | SEC | Zacks Reports | ![]()
![]()
![]()

View all notes | Alert me of new notes | CANSLIM.net Company Profile
|
Neogen Corp. |
| |
|
Ticker Symbol: NEOG (NASDAQ) |
Industry Group: Medical- products |
Shares Outstanding: 14,300,000 |
|
Price: $27.34 3:02PM ET |
Day's Volume: 110,400 2/21/2008 3:02PM ET |
Shares in Float: 12,800,000 |
|
52 Week High: $28.00 2/21/2008 10:20AM ET |
50-Day Average Volume: 36,800 |
Up/Down Volume Ratio: 1.3 |
|
Pivot Point: $27.74 12/28/2008 plus $0.10 |
Pivot Point +5% = Max Buy Price: $29.13 |
Web Address: http://www.neogen.com/ |
C A N S L I M | StockTalk | News | Chart | SEC | Zacks Reports | ![]()
![]()
![]()
View all notes | Alert me of new notes | CANSLIM.net Company Profile
CANSLIM.net Profile: Neogen Corporation, together with its subsidiaries, engages in the development, manufacture, and sale a range of products for food safety testing and animal health applications. It was founded in 1981 and is based in Lansing, Michigan. It operates in two segments, Food Safety and Animal Safety. The Food Safety segment primarily offers diagnostic test kits and complementary products that detect dangerous and/or unintended substances in human food and animal feed, such as food borne pathogens, spoilage organisms, natural toxins, food allergens, genetic modifications, ruminant by-products, drug residues, pesticide residues, and general sanitation concerns. This places the company in a strong position in the event the recent food recalls continue. The company offers its products directly, as well as through a network of national and international distributors, and large farm supply retail chains. It has operations in the United States, South America, Central America, Canada, Asia, and Europe. NEOG hails from the Medical-products group which is presently ranked 19th on the 197 Industry Groups list, which easily satisfies the L criteria. There were 24 top-rated funds with an ownership interest as of December '07, a sign of reasonable institutional interest. More encouraging, the stock has less than 13 million shares in the float, and having a small supply of shares is a characteristic that most of the greatest stock market winners exhibited before they enjoyed explosive moves up. Its annual earnings growth history has been steady but not especially strong, and quarterly earnings increases in the 4 latest quarterly earnings comparisons were borderline with the +25% guideline. Strong earnings increases are always preferred.
What to Look For and What to Look Out For: Look for the stock to confirm a new technical buy signal by breaking out and closing above its $27.74 pivot point with gains on heavy volume in the coming days and weeks. Remember that buyable breakouts require three important components: the stock must clear its pivot point with considerable gains, those gains must be backed by at least +50% above average volume, and the overall market environment must improve and produce a new batch of leadership. As always, it is of the utmost importance to sell a stock if it drops 7-8% below your purchase price. The small supply of outstanding shares could lead to dramatic price volatility, especially if the institutional crowd rushes in or out. Also, the market conditions are still somewhat questionable, largely due to the dearth of leadership, which suggests this is not an ideal environment conducive for accumulating shares. This high-ranked leader should remain on an active watchlist and could be considered as a new buy candidate in the event it closes above its pivot point on the necessary volume needed to trigger a technical buy signal.
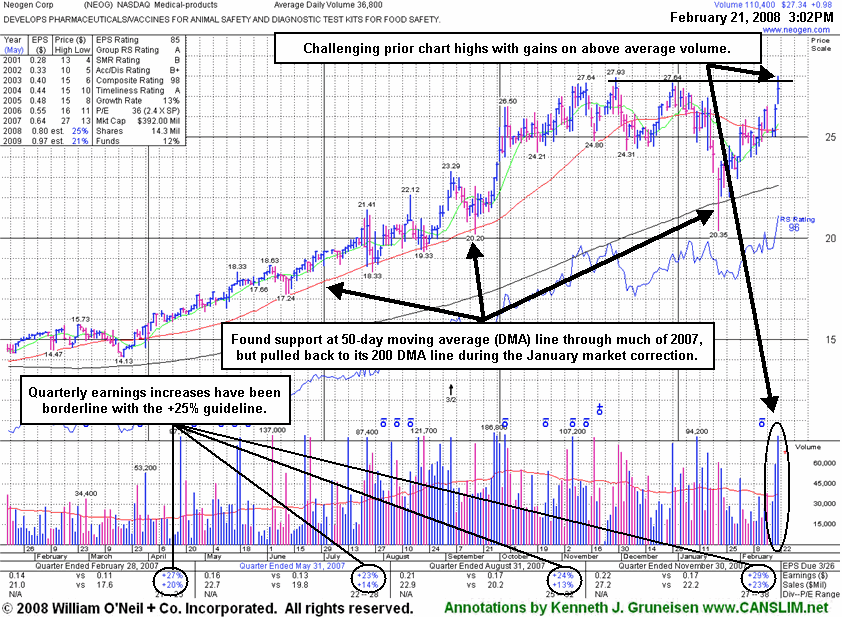
Technical Analysis: NEOG technically traded up to a new all-time high with very heavy volume, and the gain has it now trading very near its pivot point. The bullish action prompted its appearance in yellow in today's CANSLIM.net Mid-Day BreakOuts Report (read here). Volume has easily surpassed the necessary threshold needed to trigger a technical buy signal, and a proper technical buy signal may be triggered if this leader closes above its pivot point with a gain on heavy volume. Neogen has spent the past 5 months building its latest base. The stock found great support near its 50-day moving average (DMA) line through many months of 2007, but during the market's January correction the stock violated its 50 DMA line and tested support at its longer-term 200 DMA line. It promptly found support and repaired the damage in recent weeks.