Waning Relative Strength Versus Other Group Leaders - Wednesday, November 10, 2010
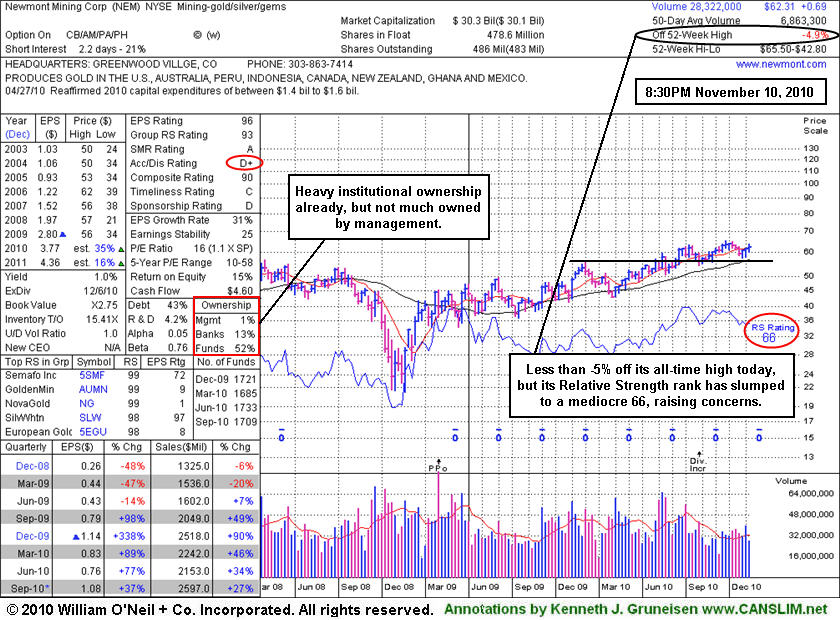
Newmont Mining Corporation's (NEM +$1.80 or +2.97% to $62.31) ended less than -5% from its all-time high today. While there is not much overhead supply to hinder its progress, confirming gains with above average volume to new highs would be a reassuring sign worth watching for in the days ahead. Concern has risen while it has failed to keep pace with the strongest market leaders. Its Relative Strength rank has slumped to a mediocre 66, below the 80+ guideline normally expected of strong buy candidates under the fact-based system.
One more drawback is that management has little ownership interest, meanwhile its is also already heavily owned by institutional investors. The investment system guidelines call for investors to look for stocks being discovered and accumulated by an increasing number of institutional investors (the I criteria). Its Accumulation/Distribution rating has slumped to a D+, another data point suggesting that it has not been under heavy accumulation recently. The C and A criteria are satisfied as the company has demonstrated solid quarterly sales revenues and earnings increases (above the +25% minimum guideline) in recent comparisons and it has a good annual earnings history. Leadership in the Mining - Gold/Silver/Gems group (L criteria) is encouraging, however other high-ranked leaders from the group currently listed on the Featured Stocks page have been clearly outpacing Newmont.
Gap Up Gain With Nearly Twice Average Volume - Tuesday, September 14, 2010
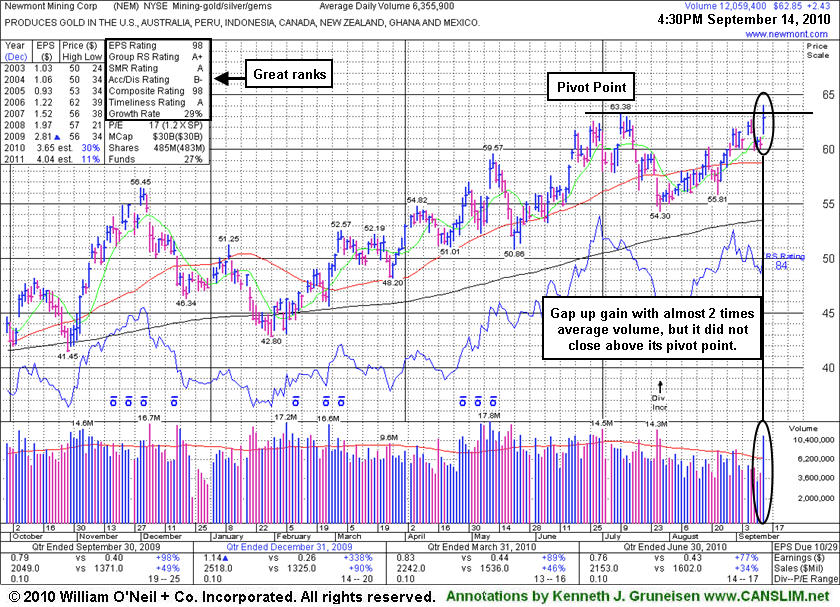
Newmont Mining Corporation's (NEM +$2.43 or +4.02% to $62.85) gapped up today, rallying with nearly twice its average volume for a considerable gain. It traded above its pivot point and hit a new 52-week high, yet closed below its pivot point near the middle of its intra-day trading range. No overhead supply remains to hinder its progress. Confirming gains with above average volume would be a reassuring sign in the days ahead. The C and A criteria are satisfied as the company has demonstrated solid quarterly sales revenues and earnings increases (above the +25% minimum guideline) in recent comparisons and it has a good annual earnings history.
Buyable breakouts require that the stock rise above its pivot point with considerable gains and those gains must be backed by a minimum of at least +40%-50% above average volume, ideally much more. Pyramiding into a position may be the most prudent way to let the market action dictate investors' entries. As always, it is of the utmost importance to sell a stock if it drops 7-8% below your purchase price.
Leadership in the Mining - Gold/Silver/Gems group (L criteria) is encouraging, and there are other high-ranked leaders from the group currently listed on the Featured Stocks page. Many other gold mining interests are headquartered overseas which increases their potential pitfalls due to geopolitical shifts.
Volume Pattern Has Not Been Indicative Of Great Accumulation - Friday, August 06, 2010
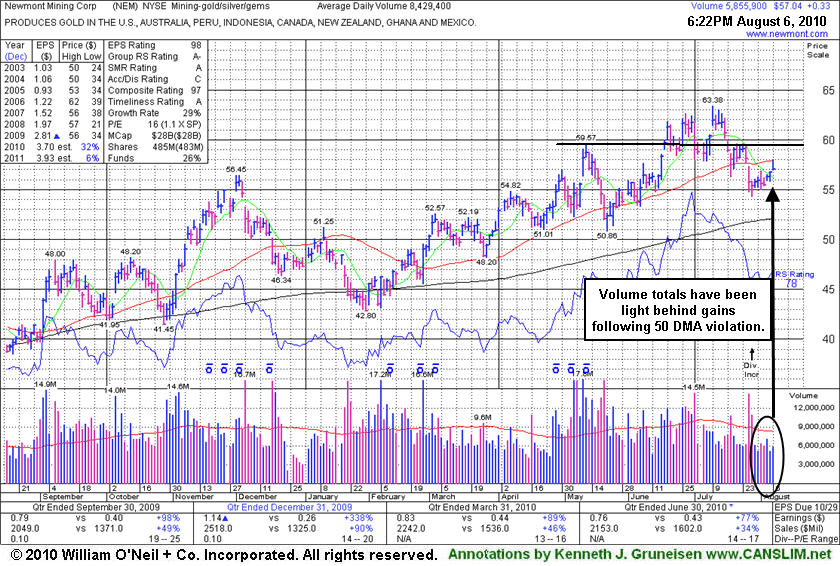
Newmont Mining Corporation's (NEM +$0.33 or +0.58% to $57.04) volume totals have been light while it has rebounded near its 50-day moving average (DMA) line. That important short-term average may now act as resistance after a damaging gap down on 7/27/10. A rebound above its 50 DMA line would help its outlook improve. When last shown in this FSU section on 7/09/10 under the headline "Gap Up Gain Quietly Helped Leader Hit All-Time High" it had recently marked new high closes and briefly topped its January 2006 all-time high ($62.72), however volume behind gains was below the minimum guidelines since its mid-May breakout faltered.In a 6/22/10 Stock Bulletin (read here) members were told - "Look for an opportunity to properly pyramid buying efforts with chasing the stock more than 5% above its Pivot Point or 'Max Buy' level." Confirming gains on heavy volume in the coming days and weeks might come after it is too extended from an ideal buy point. Buyable breakouts require that the stock rise above its pivot point with considerable gains and those gains must be backed by a minimum of at least +40%-50% above average volume, ideally much more. Pyramiding into a position may be the most prudent way to let the market action dictate investors' entries. As always, it is of the utmost importance to sell a stock if it drops 7-8% below your purchase price.
The America-based mining firm had reassuring leadership (L criteria) from other Mining - Gold/Silver/Gems industry firms as a favorable backdrop. Many other gold mining interests are headquartered overseas which increases their potential pitfalls due to geopolitical shifts. The C and A criteria are satisfied as the company has demonstrated solid quarterly sales revenues and earnings increases (above the +25% minimum guideline) in recent comparisons and it has a good annual earnings history.
Gap Up Gain Quietly Helped Leader Hit All-Time High - Friday, July 09, 2010
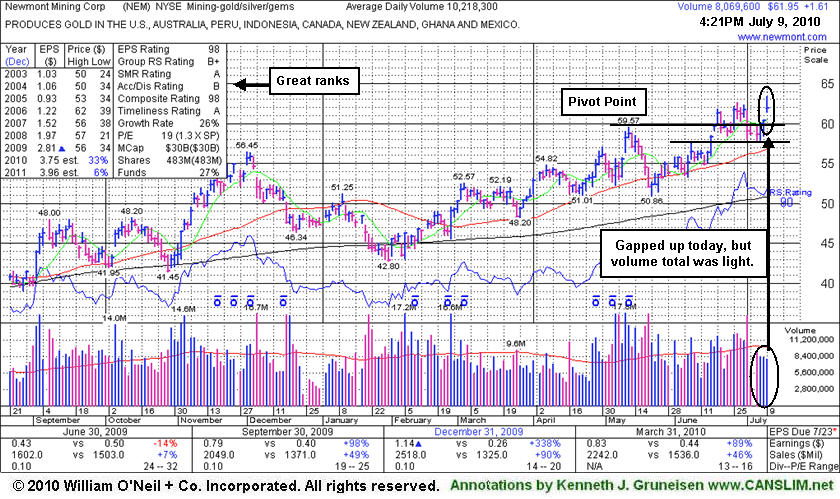
Newmont Mining Corporation (NEM +$1.61 or +2.64% to $61.95) gapped up today, but volume behind its gain was light again. It still marked a new high close, and no overhead supply remains to act as resistance. It briefly topped its January 2006 all-time high ($62.72), but closed in the lower half of its intra-day range. Volume behind recent gains has been below the minimum guidelines (since its mid-May breakout faltered). The America-based mining firm has very reassuring leadership (L criteria) from other Mining - Gold/Silver/Gems industry firms as a favorable backdrop. Many other gold mining interests are headquartered overseas which increases their potential pitfalls due to geopolitical shifts. The C and A criteria are satisfied as the company has demonstrated solid quarterly sales revenues and earnings increases (above the +25% minimum guideline) in recent comparisons and it has a good annual earnings history.
In a 6/22/10 Stock Bulletin (read here) members were told - "Look for an opportunity to properly pyramid buying efforts with chasing the stock more than 5% above its Pivot Point or 'Max Buy' level." Confirming gains on heavy volume in the coming days and weeks might come after it is too extended from an ideal buy point. Buyable breakouts require that the stock rise above its pivot point with considerable gains and those gains must be backed by a minimum of at least +40%-50% above average volume, ideally much more. Pyramiding into a position may be the most prudent way to let the market action dictate investors' entries. As always, it is of the utmost importance to sell a stock if it drops 7-8% below your purchase price.
High-Ranked Mining Firm Headquartered In Colorodo - Tuesday, June 22, 2010
