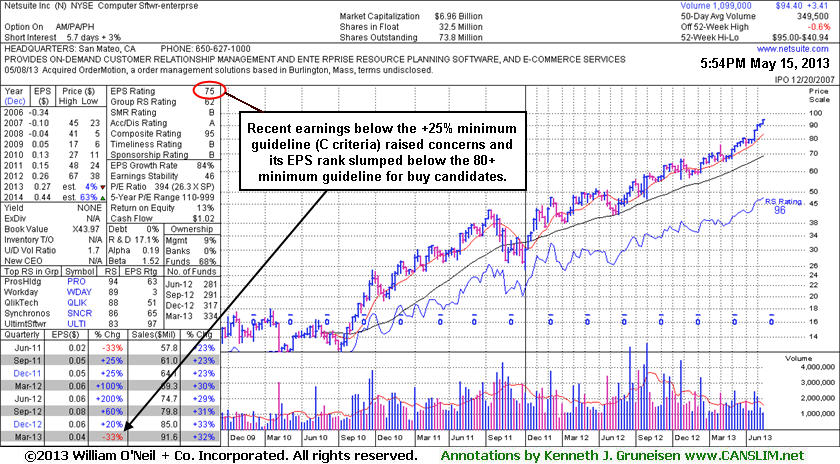
Netsuite Inc (N -$0.22 or -0.23% to $94.40) technically is extended from any sound base, and finished with a small loss after touching yet another new all-time high today, pausing following 3 consecutive gains backed average volume. Its annotated weekly graph below shows it on track for a 6th consecutive weekly gain. Fundamentally, concerns were raised as it recently reported earnings -33% on +32% sales revenues for the Mar '13 quarter, marking a 2nd consecutive quarterly comparison with earnings below the +25% minimum guideline (C criteria). Its Earnings Per Share Rating (EPS) subsequently has slumped to 75, below the 80+ minimum guideline for buy candidates. Its last appearance in this FSU section was on 4/22/13 with an annotated graph under the headline, "New Flat Base Formed, But Fundamental Concerns Remain" while trading in a tight range near its all-time high. It was then noted - "It has formed an orderly flat base however, due to fundamental concerns, no new pivot point is being cited. A subsequent volume-driven gain into new high territory may trigger a new (or add-on) technical buy signal, however historic studies showed that the markets best winners had a combination of strong fundamentals (earnings history) coupled with bullish technical (price/volume) action."
The number of top-rated funds owning its shares rose from 201 in Jun '11 to 334 in Mar '13, a reassuring sign concerning the I criteria. Its current Up/Down Volume Ratio of 1.7 is an unbiased indication its shares have been under accumulation over the past 50 days. Bullish action has continued to reward patient investors still giving it the benefit of the doubt until any technical sell signals start adding up. Its 50-day moving average (DMA) line ($81.14 now) defines important near-term support to watch where a violation would raise concerns. Its prior report of earnings +20% on +33% sales revenues for the Dec '12 quarter was below the +25% minimum earnings guideline (C criteria), first raising fundamental concerns for followers of the fact-based investment system. The company had reported earnings increases above the +25% minimum earnings guideline (C criteria) in the 5 prior quarterly comparisons. Its annual earnings (A criteria) history improved from losses prior to FY '09.
Investors are taught in the Certification to only buy stocks with a combination of both strong fundamentals and strong technical action, however stocks should be sold based on their technical action only. In this example, bullish action has continued to reward patient investors still giving it the benefit of the doubt until any technical sell signals start adding up.
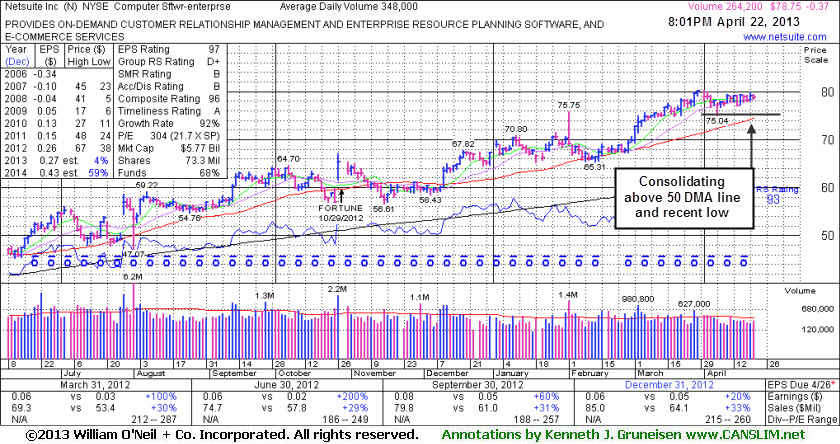
Netsuite Inc (N -$0.37 or -0.47% to $78.75) is consolidating in a tight range near its all-time high. It has formed an orderly flat base however, due to fundamental concerns, no new pivot point is being cited. A subsequent volume-driven gain into new high territory may trigger a new (or add-on) technical buy signal, however historic studies showed that the markets best winners had a combination of strong fundamentals (earnings history) coupled with bullish technical (price/volume) action. Its 50-day moving average (DMA) line ($74.48 now) defines important near-term support to watch.
It reported earnings +20% on +33% sales revenues for the Dec '12 quarter, below the +25% minimum earnings guideline (C criteria), raising fundamental concerns for followers of the fact-based investment system. The company had reported earnings increases above the +25% minimum earnings guideline (C criteria) in the 5 prior quarterly comparisons. Its annual earnings (A criteria) history improved from losses prior to FY '09. The stock made limited progress since it was highlighted in yellow in the 12/12/12 mid-day report with a pivot point cited based on its 10/26/12 high plus 10 cents (read here), however it seems to be rewarding patient investors.
Netsuite's last appearance in this FSU section was on 4/01/13 with an annotated graph under the headline, "Bullish Up/Down Volume Ratio Despite Sub Par Dec '12 Earnings Increase". The number of top-rated funds owning its shares rose from 201 in Jun '11 to 322 in Dec '12, a reassuring sign concerning the I criteria. Its current Up/Down Volume Ratio of 1.6 is an unbiased indication its shares have been under accumulation over the past 50 days.
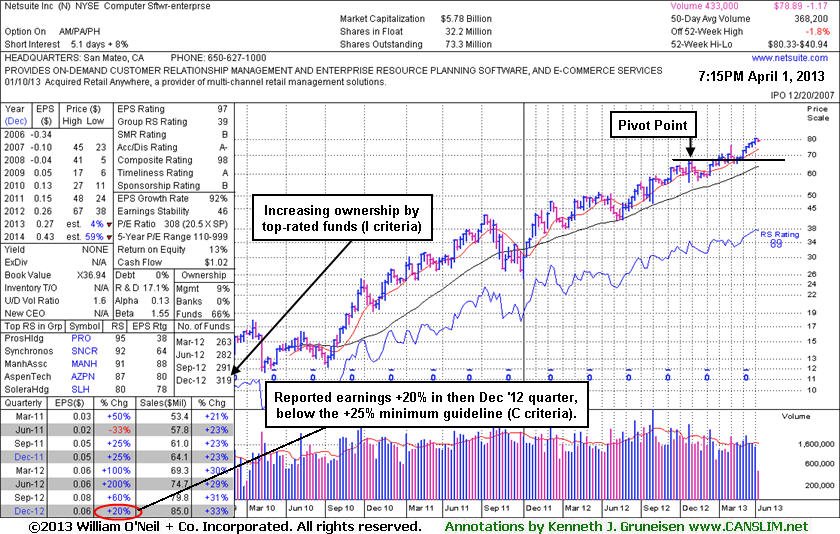
It reported earnings +20% on +33% sales revenues for the Dec '12 quarter, below the +25% minimum earnings guideline (C criteria), raising fundamental concerns for followers of the fact-based investment system. The company had reported earnings increases above the +25% minimum earnings guideline (C criteria) in the 5 prior quarterly comparisons. Its annual earnings (A criteria) history improved from losses prior to FY '09. The stock made limited progress since it was highlighted in yellow in the 12/12/12 mid-day report with a pivot point cited based on its 10/26/12 high plus 10 cents (read here), however it seems to be rewarding patient investors.
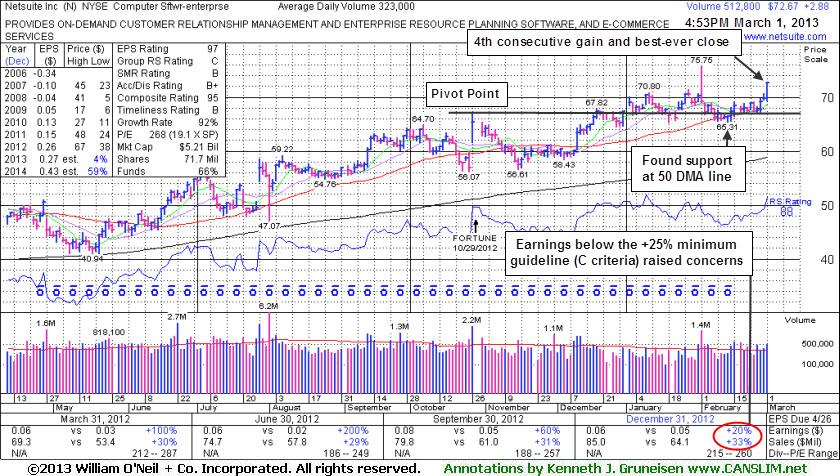
Netsuite Inc (N +$2.88 or +4.13% to $72.67) rallied to its best-ever close with today's 4th consecutive gain. It held its ground near its 50-day moving average (DMA) line recently and fought to stay above prior highs, showing good signs that institutional owners were supporting the stock. The latest action indicates that its shares are being accumulated and bid up.
The number of top-rated funds owning its shares rose from 201 in Jun '11 to 317 in Dec '12, a reassuring sign concerning the I criteria. However, it reported earnings +20% on +33% sales revenues for the Dec '12 quarter, below the +25% minimum earnings guideline (C criteria) raising fundamental concerns for followers of the fact-based investment system.
The company had reported earnings increases above the +25% minimum earnings guideline (C criteria) in the 5 prior quarterly comparisons. Its annual earnings (A criteria) history improved from losses prior to FY '09. Today the Computer Software -Enterprise group has a Group Relative Strength Rating of C, down from a B rating when Netsuite was last shown in this FSU section on 2/05/13 with an annotated graph under the headline, "Fundamental Flaw and Negative Reversal at High Raised Concerns". The stock made limited progress since it was highlighted in yellow in the 12/12/12 mid-day report with a pivot point cited based on its 10/26/12 high plus 10 cents (read here), however it seems to be rewarding patient investors even while the broader market (M criteria) entered a correction.
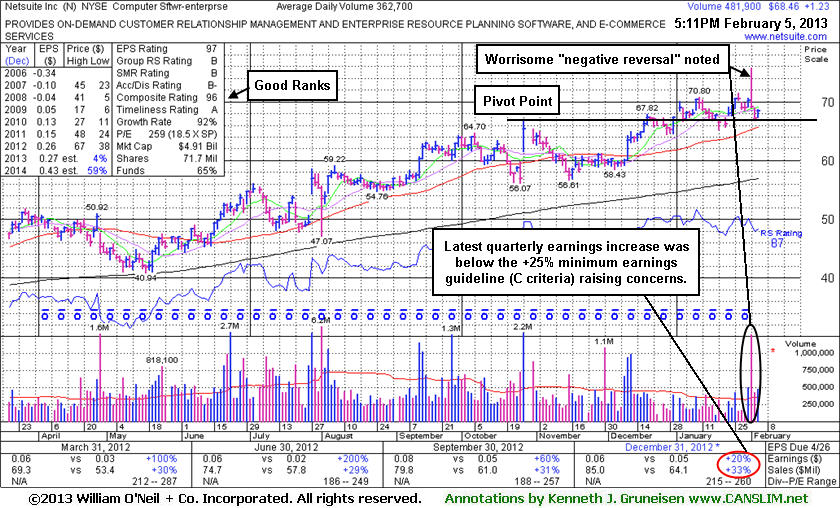
Netsuite Inc (N +$1.23 or +1.83% to $68.46) posted a gain today with above average volume after slumping toward its 50-day moving average (DMA) line, and it finished the session -9.6% off its 52-week high. There was a worrisome "negative reversal" noted on 2/01/13 after gapping up for a new 52-week high as the mid-day report cautioned - "Reported earnings +20% on +33% sales revenues for the Dec '12 quarter, below the +25% minimum earnings guideline (C criteria) raising fundamental concerns."
Netsuite was last shown in this FSU section on 1/18/13 with an annotated graph under the headline, "Encountering Mild Distributional Pressure". It held its ground and on 1/31/2013 a gain with +48% above average volume lifted it near its "max buy" level and gave investors a reassuring hint that institutional buying demand was lurking. However, after the disappointing earnings news, the negative reversal and high volume with lack of meaningful price progress was a sign that it encountered more serious distributional pressure.
Most of the recent gains above its pivot point were marked by below average volume, and it was observed - "That kind of action is technically termed 'wedging' and it does not have the look of hearty buying demand coming from the institutional crowd. Disciplined investors know that volume must be at least +40% above average behind gains above the pivot point to trigger a proper technical buy signal. Without heavy volume behind a stock's breakout investors have little reason to believe sufficient buying demand is lurking to allow for it to make a meaningful and sustained advance in price."
Netsuite Inc was highlighted in yellow in the 12/12/12 mid-day report with a pivot point cited based on its 10/26/12 high plus 10 cents (read here). The high-ranked Computer Software -Enterprise firm had reported earnings increases above the +25% minimum earnings guideline (C criteria) in the 5 prior quarterly comparisons. Its annual earnings (A criteria) history improved from losses prior to FY '09. The number of top-rated funds owning its shares rose from 201 in Jun '11 to 303 in Dec '12, a reassuring sign concerning the I criteria. The Computer Software -Enterprise group has a Group Relative Strength Rating of B, a somewhat reassuring sign concerning the L criteria.
Disciplined investors watch out when fundamental flaws develop, and they always limit losses by selling if any stock falls more than -7% from the purchase price, if not selling sooner. Following strict selling rules is what keeps an investor from letting a small loss become a more devastating loss.
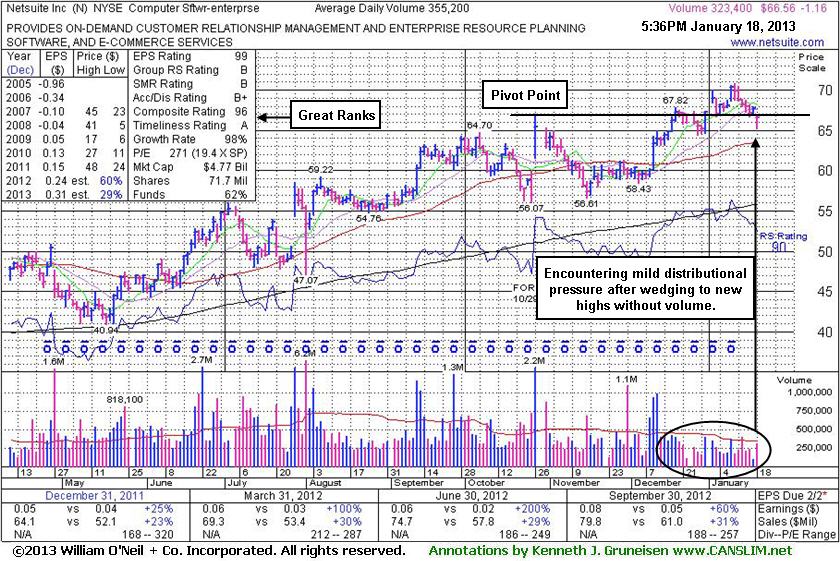
Netsuite Inc (N -$1.16 or -1.71% to $66.56) gapped down today but finished near the session high. It has encountered mild distributional pressure and finished -6% off its 52-week high. Recent gains above its pivot point were marked by below average volume. It was last shown in this FSU section on 1/04/12 with an annotated graph under the headline, "Wedging Action is Not an Encouraging Surge to New Highs", as it traded above its pivot point, however its gains were marked by light volume as we observed - "That kind of action is technically termed 'wedging' and it does not have the look of hearty buying demand coming from the institutional crowd. Disciplined investors know that volume must be at least +40% above average behind gains above the pivot point to trigger a proper technical buy signal. Without heavy volume behind a stock's breakout investors have little reason to believe sufficient buying demand is lurking to allow for it to make a meaningful and sustained advance in price."
Netsuite Inc was highlighted in yellow in the 12/12/12 mid-day report with a pivot point cited based on its 10/26/12 high plus 10 cents (read here). The high-ranked Computer Software -Enterprise firm reported earnings +60% on +31% sales revenues for the quarter ended September 30, 2012 versus the year ago period. Earnings increased above the +25% minimum earnings guideline (C criteria) in the 5 latest quarterly comparisons. Its annual earnings (A criteria) history improved from losses prior to FY '09. The number of top-rated funds owning its shares rose from 201 in Jun '11 to 291 in Dec '12, a reassuring sign concerning the I criteria. The Computer Software -Enterprise group has a Group Relative Strength Rating of B, a reassuring sign concerning the L criteria.
Disciplined investors use a tactic that they teach in the Certification program called "pyramiding", a method of staggering multiple buy orders which allows the ongoing market action to dictate their weighting in new buy candidates. Always limit losses by selling if any stock falls more than -7% from the purchase price. If a stock strengthens after it is sold it can always be bought back, but following strict selling rules is what keeps an investor from letting a small loss become a more devastating loss.
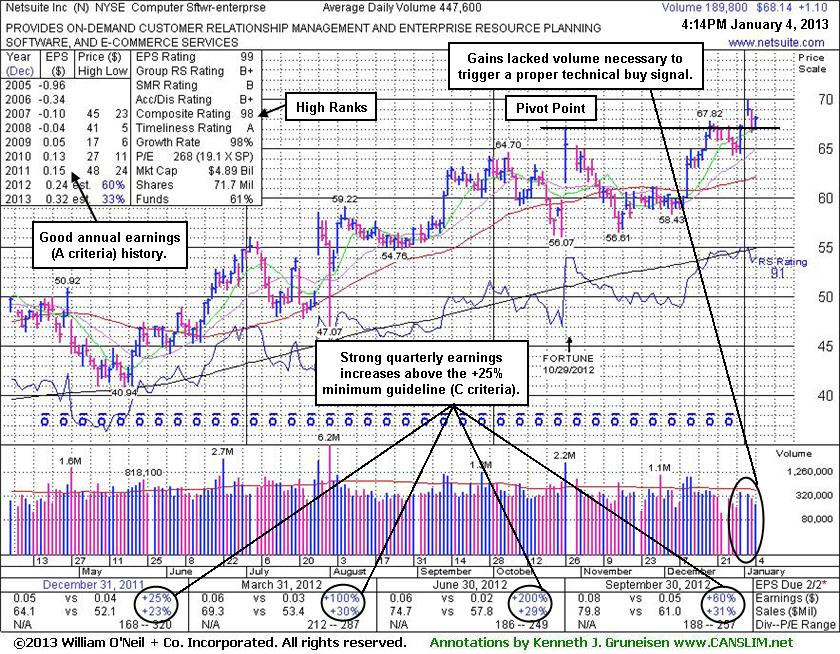
It was last shown in this FSU section on 12/13/12 with an annotated graph under the headline, "Still Forming New Base Awaiting Fresh Technical Breakout", after highlighted in yellow in the 12/12/12 mid-day report with a new pivot point cited based on its 10/26/12 high plus 10 cents (read here). It rallied above its 50-day moving average (DMA) line with 3 consecutive volume-driven gains while working up toward prior highs, but subsequent gains into new high territory lacked great volume conviction.
The high-ranked Computer Software -Enterprise firm reported earnings +60% on +31% sales revenues for the quarter ended September 30, 2012 versus the year ago period. Earnings increased above the +25% minimum earnings guideline (C criteria) in the 5 latest quarterly comparisons. Its annual earnings (A criteria) history improved from losses prior to FY '09. The number of top-rated funds owning its shares rose from 201 in Jun '11 to 291 in Dec '12, a reassuring sign concerning the I criteria. The Computer Software -Enterprise group has a Group Relative Strength Rating of B+, a reassuring sign concerning the L criteria.
Disciplined investors use a tactic that they teach in the Certification program called "pyramiding", a method of staggering multiple buy orders which allows the ongoing market action to dictate their weighting in new buy candidates. Always limit losses by selling if any stock falls more than -7% from the purchase price. If a stock strengthens after it is sold it can always be bought back, but following strict selling rules is what keeps an investor from letting small losses become large losses. In a bullish market environment, leading stocks often flash numerous buy signals from multiple-bases.
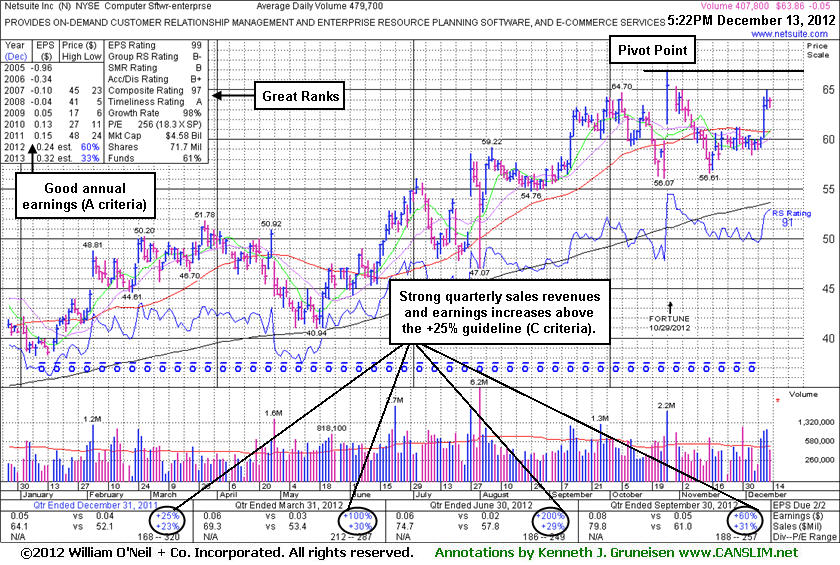
Netsuite Inc (N -$0.05 or -0.08% to $63.86) was highlighted in yellow in the 12/12/12 mid-day report with a new pivot point cited based on its 10/26/12 high plus 10 cents (read here). Its fundamentals (C and A criteria) remain strong and it has been resilient since dropped from the Featured Stocks list on 11/15/12. It rallied above its 50-day moving average (DMA) line with 3 consecutive volume-driven gains this week while working up toward prior highs. However, it still faces resistance, and disciplined investors will watch for subsequent volume-driven gains above the pivot point which may trigger a technical buy signal before taking action.
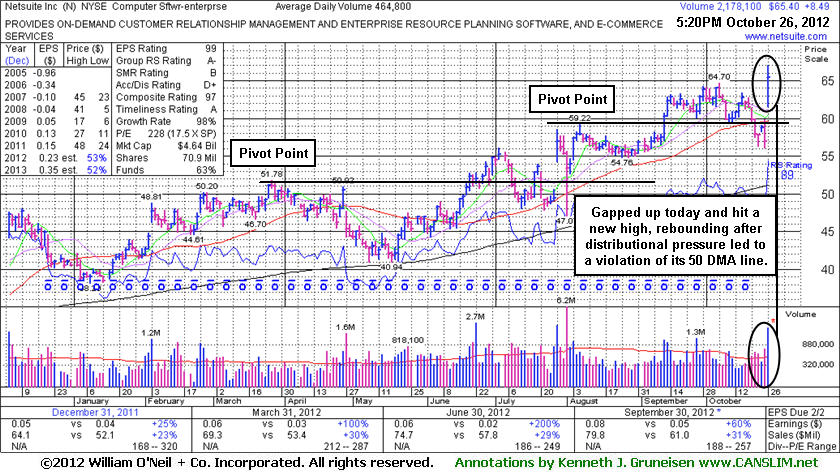
It was last shown in this FSU section on 10/26/12 with an annotated graph under the headline, "Sputtering Software Firm Rebounds for New 52-Week High Following Earnings", as it gapped up from below its 50-day moving average(DMA) line and blasted to new 52-week and all-time highs, however, it stalled afterward. The high-ranked Computer Software -Enterprise firm reported earnings +60% on +31% sales revenues for the quarter ended September 30, 2012 versus the year ago period. Earnings above the +25% guideline (C criteria) in the 5 latest quarterly comparisons through Sep '12. Its annual earnings (A criteria) history improved from losses prior to FY '09. The number of top-rated funds owning its shares rose from 201 in Jun '11 to 275 in Sep '12, a reassuring sign concerning the I criteria. The Computer Software -Enterprise group has a Group Relative Strength Rating of B-, a reassuring sign concerning the L criteria.
Disciplined investors always limit losses by selling if any stock falls more than -7% from their purchase price. If a stock strengthens after it is sold it can always be bought back, but following strict selling rules is what keeps an investor from letting small losses become large losses. In a bullish market environment, leading stocks often flash numerous buy signals from multiple-bases.
It reported earnings above the +25% guideline (C criteria) in the 4 latest quarterly comparisons through Jun '12. Its annual earnings (A criteria) history improved from losses prior to FY '09. The number of top-rated funds owning its shares rose from 201 in Jun '11 to 275 in Sep '12, a reassuring sign concerning the I criteria. The Computer Software -Enterprise group has a Group Relative Strength Rating of A-, a reassuring sign concerning the L criteria.
Disciplined investors always limit losses by selling if any stock falls more than -7% from their purchase price. If a stock strengthens after it is sold it can always be bought back, but following strict selling rules is what keeps an investor from letting small losses become large losses. In a bullish market environment, leading stocks often flash numerous buy signals from multiple-bases.
It reported earnings above the +25% guideline (C criteria) in the 4 latest quarterly comparisons through Jun '12. Its annual earnings (A criteria) history improved from losses prior to FY '09. The number of top-rated funds owning its shares rose from 201 in Jun '11 to 278 in Jun '12, a reassuring sign concerning the I criteria. The Computer Software -Enterprise group has a Group Relative Strength Rating of A, reassuring sign concerning the L criteria.
Disciplined investors always limit losses by selling if any stock falls more than -7% from their purchase price. If a stock strengthens after it is sold it can always be bought back, but following strict selling rules is what keeps an investor from letting small losses become large losses. In a bullish market environment, leading stocks often flash numerous buy signals from multiple-bases.
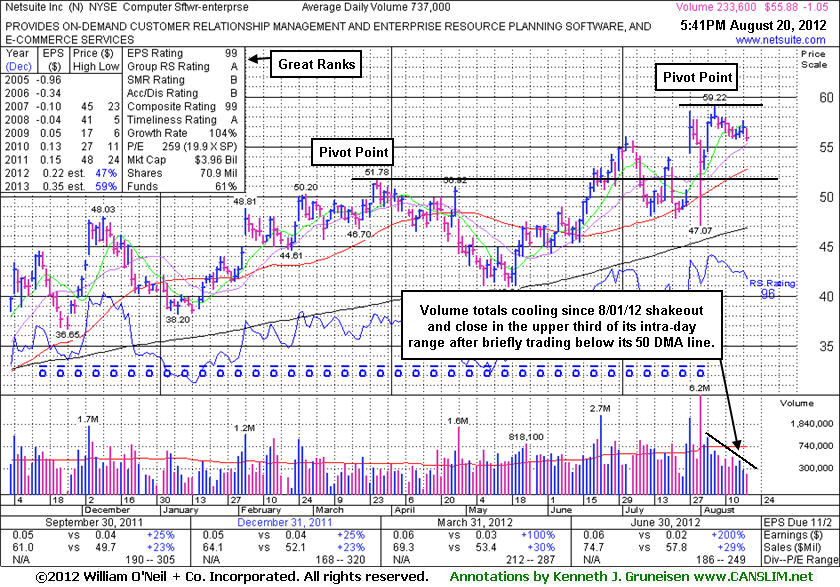
Its series of very tight weekly closes (best viewed on a weekly graph) may be considered an advanced "3-weeks tight" base pattern, yet last week was actually its 4th weekly finish in a very tight range. Its color code was changed to yellow and a new pivot point was cited based on its 8/07/12 high plus 10 cents. Subsequent volume-driven gains above its pivot point may trigger a new (or add-on) technial buy signal. It reported earnings above the +25% guideline in the 4 latest quarterly comparisons through Jun '12. Its annual earnings (A criteria) history improved from losses prior to FY '09. The number of top-rated funds owning its shares rose from 201 in Jun '11 to 275 in Jun '12, a reassuring sign concerning the I criteria.
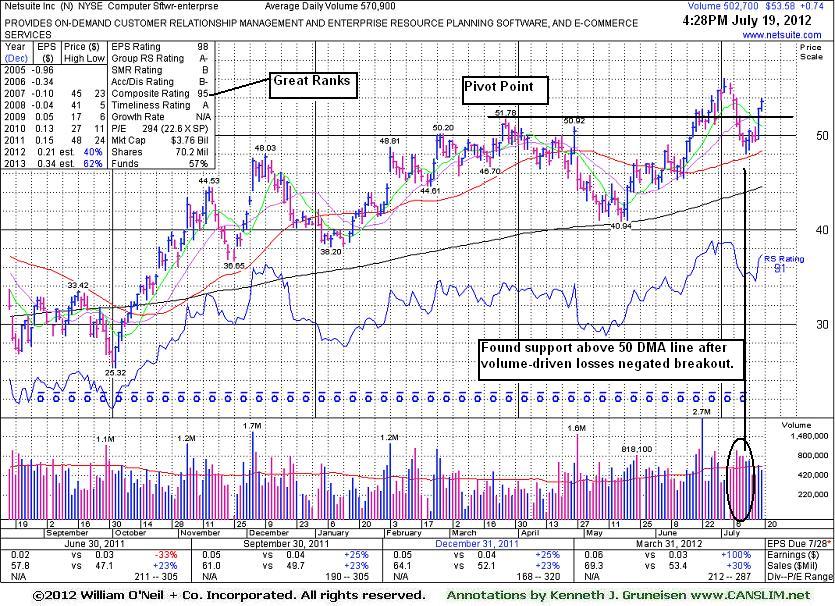
Netsuite Inc (N +$0.74 or +1.40% to $53.58) rebounded further above its pivot point with a gain today backed by below average volume. Damaging volume-driven losses recently negated its prior breakout, and disciplined investors always limit losses by selling if any stock falls more than -7% from their purchase price. If a stock strengthens after it is sold it can always be bought back, but following strict selling rules is what keeps an investor from letting small losses become large losses. Never lose big! In a bullish market environment, leading stocks often flash numerous buy signals from multiple-bases.
Netsuite was last shown in this FSU section on 6/20/12 with an annotated graph under the headline, "Cleared Pivot Point With Gain Backed by +86% Above Average Volume", as it finished strong after highlighted in yellow in that day's mid-day report (read here) with a pivot point cited based on its 3/27/12 high plus 10 cents. Subsequent gains didn't have as much volume conviction while it continued rallying into new high territory unhindered by overhead supply.
Its financial results for the second quarter 2012 will be released after the market close on Thursday, July 26, 2012. Volume and volatility often increase near earnings news. It reported earnings above the +25% guideline in the 3 latest quarterly comparisons through Mar '12. Its annual earnings (A criteria) history improved from losses prior to FY '09. The number of top-rated funds owning its shares rose from 201 in Jun '11 to 285 in Mar '12, a reassuring sign concerning the I criteria.
Netsuite Inc (N +$1.49 or +2.93% to $52.31) finished strong after it was highlighted in yellow in today's mid-day report (read here) with a new pivot point cited based on its 3/27/12 high plus 10 cents. It was hitting a new 52-week high with a 5th consecutive gain while it was noted - "Gains above its pivot point backed by at least +40% above average volume or more may trigger a technical buy signal." It finished the session with a gain above its pivot point backed by +86% above average volume. No resistance remains to hinder its upward progress. Disciplined investors avoid chasing stocks after they have risen more than +5% above their pivot point, and they always limit losses if ever any stock falls more than -7% from their purchase price to protect their precious capital.
It reported earnings above the +25% guideline in the 3 latest quarterly comparisons through Mar '12. Its annual earnings (A criteria) history improved from losses prior to FY '09. The number of top-rated funds owning its shares rose from 201 in Jun '11 to 268 in Mar '12, a reassuring sign concerning the I criteria.
