Rebound to 50-Day Moving Average After Abrupt Drop to 200-Day Line - Thursday, September 1, 2016
Maxlinear Inc (MXL +$0.35 or +1.83% to $19.52) has rebounded near its 50-day moving average (DMA) line. That important short-term average might act as a resistance level after damaging volume-driven losses. A convincing rebound above the 50 DMA line ($19.52) is needed for its outlook to improve. It found support at its 200 DMA line. That long-term average and prior lows in the $17 area define the next important support level where subsequent violations would raise serious concerns.Its small supply of only 54.5 million shares in the public float (S criteria) may contribute to greater price volatility in the event of institutional buying or selling. The number of top-rated funds owning its shares rose from 175 in Mar '15 to 327 in Jun '16, a very reassuring sign (I criteria). It currently has a Timeliness rating of A, and a Sponsorship Rating of D.

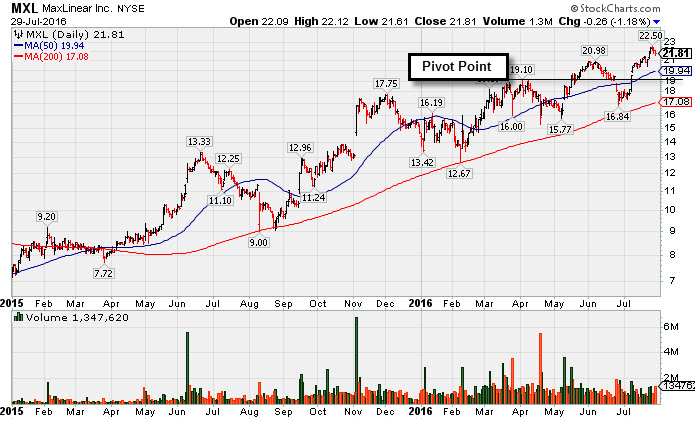
Consolidating Near Highs Above its "Max Buy" Level - Friday, July 29, 2016
Maxlinear Inc (MXL -$0.26 or -1.18% to $21.81) is consolidating above its "max buy" level following volume-driven gains for new highs. Recent lows and the 200-day moving average (DMA) line in the $16.85 area define important support to watch on pullbacks. The high-ranked Electronics - Semiconductor firm was last shown in the FSU section on 7/05/16 with an annotated graph under the headline, "Slump Into Prior Base and Below 50-Day Moving Average Raised Concerns". Volume-driven losses leading to a slump into the prior base and a violation of the 50 DMA line had triggered a technical sell signal. A subsequent rebound above the 50 DMA line on 7/08/16 helped its near-term outlook improve,MXL was first highlighted in yellow with pivot point cited based on its 1/13/16 high in the 2/26/16 mid-day report (read here). It ended up breaking out convincingly with a subsequent streak of gains on above average volume, clearing the previously noted a "double bottom" base and triggering a technical buy signal.
The high-ranked Semiconductor firm saw sales revenues increases of +99%, +193%, and +205% for the Jun, Sep, and Dec '15 quarters, respectively, versus the year ago periods as earnings rose +62%, +900%, and +820%. The 3 strong quarterly comparisons above the +25% minimum guideline (C criteria) were noted in the 2/09/16 mid-day report - "Helping it better match the fact-based investment system's guidelines."
Its small supply of only 54.5 million shares in the public float (S criteria) may contribute to greater price volatility in the event of institutional buying or selling. The number of top-rated funds owning its shares rose from 175 in Mar '15 to 309 in Jun '16, a very reassuring sign (I criteria). It currently has a Timeliness rating of A, and a Sponsorship Rating of D.
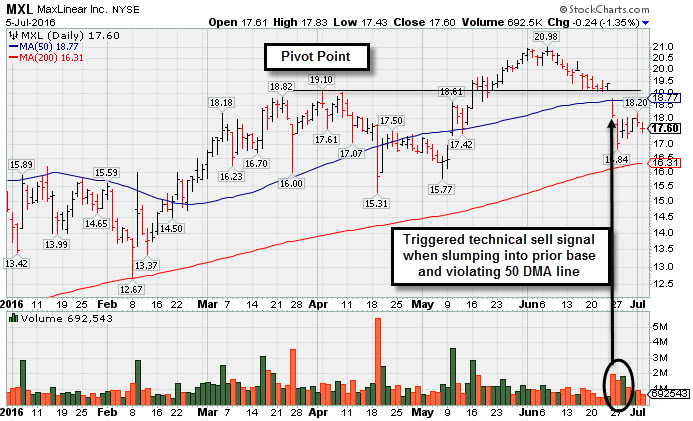
Slump Into Prior Base and Below 50-Day Moving Average Raised Concerns - Tuesday, July 5, 2016
Maxlinear Inc (MXL -$0.24 or -1.35% to $17.60) remains below its 50-day moving average (DMA) line. Volume-driven losses leading to a slump into the prior base and a violation of the 50 DMA line recently triggered a technical sell signal. Only a rebound above the 50 DMA line would help its near-term outlook improve, Meanwhile, the 200 DMA line and prior lows in the $15-16 area define the next important support area. It was last shown in the FSU section on 6/02/16 with an annotated graph under the headline, "Extended From Latest Base After Recently Wedging Higher".MXL was first highlighted in yellow with pivot point cited based on its 1/13/16 high in the 2/26/16 mid-day report (read here). It ended up breaking out convincingly with a subsequent streak of gains on above average volume, clearing the previously noted a "double bottom" base and triggering a technical buy signal.
The high-ranked Semiconductor firm saw sales revenues increases of +99%, +193%, and +205% for the Jun, Sep, and Dec '15 quarters, respectively, versus the year ago periods as earnings rose +62%, +900%, and +820%. The 3 strong quarterly comparisons above the +25% minimum guideline (C criteria) were noted in the 2/09/16 mid-day report - "Helping it better match the fact-based investment system's guidelines."
Its small supply of only 52.4 million shares in the public float (S criteria) may contribute to greater price volatility in the event of institutional buying or selling. The number of top-rated funds owning its shares rose from 175 in Mar '15 to 296 in Mar '16, a very reassuring sign (I criteria). It currently has a Timeliness rating of B, and a Sponsorship Rating of D.
Extended From Latest Base After Recently Wedging Higher - Thursday, June 2, 2016
Maxlinear Inc (MXL -$0.05 or -0.24% to $20.86) is perched near its all-time high after a recent spurt of gains with below average volume. Its strong close above the new pivot point was backed by +100% above average volume triggering a new (or add-on) technical buy signal noted on 5/16/16. Disciplined investors avoid chasing extended stocks too far above prior highs.
Prior highs near $19 define initial support to watch on pullbacks. It was last shown in the FSU section on 5/12/16 with an annotated graph under the headline, "Rebounded Above 50-Day Average Following Strong Earnings News". There was a powerful gap up on 5/10/16 for a considerable volume-driven gain after it reported strong earnings +422% on +190% sales revenues for the Mar '16 quarter versus the year ago period. The gain helped it rebound above its 50-day moving average (DMA) line. Members were reminded - "Remember that any stock that was previously sold can be bought again when strength returns."
MXL was first highlighted in yellow with pivot point cited based on its 1/13/16 high in the 2/26/16 mid-day report (read here). It ended up breaking out convincingly with a subsequent streak of gains on above average volume, clearing the previously noted a "double bottom" base and triggering a technical buy signal.
The high-ranked Semiconductor firm saw sales revenues increases of +99%, +193%, and +205% for the Jun, Sep, and Dec '15 quarters, respectively, versus the year ago periods as earnings rose +62%, +900%, and +820%. The 3 strong quarterly comparisons above the +25% minimum guideline (C criteria) were noted in the 2/09/16 mid-day report - "Helping it better match the fact-based investment system's guidelines."
Its small supply of only 52.4 million shares in the public float (S criteria) may contribute to greater price volatility in the event of institutional buying or selling. The number of top-rated funds owning its shares rose from 175 in Mar '15 to 290 in Mar '16, a very reassuring sign (I criteria). It currently has a Timeliness rating of B, and a Sponsorship Rating of D.

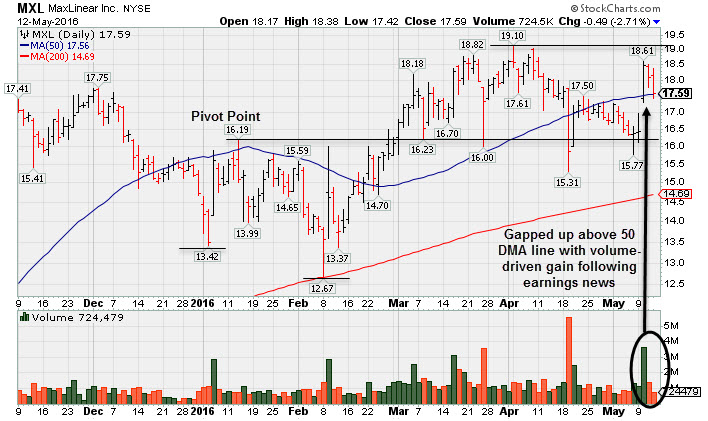
Rebounded Above 50-Day Average Following Strong Earnings News - Thursday, May 12, 2016
Maxlinear Inc (MXL -$0.49 or -2.71% to $17.59) fell on lighter volume today, retreating near its 50-day moving average (DMA) line. There was a powerful gap up on 5/10/16 for a considerable volume-driven gain after it reported strong earnings +422% on +190% sales revenues for the Mar '16 quarter versus the year ago period. The gain helped it rebound above its 50-day moving average (DMA) line. Members were reminded - "Remember that any stock that was previously sold can be bought again when strength returns."
It was last shown in the FSU section on 4/01/16 with an annotated graph under the headline, "Found Support Above 50 DMA Line Consolidating Near 52-week High". Disciplined investors avoid chasing extended stocks and always limit losses by selling any stock that falls more than -7% from their purchase price. MXL was first highlighted in yellow with pivot point cited based on its 1/13/16 high in the 2/26/16 mid-day report (read here). It ended up breaking out convincingly with a subsequent streak of gains on above average volume, clearing the previously noted a "double bottom" base and triggering a technical buy signal.
The high-ranked Semiconductor firm saw sales revenues increases of +99%, +193%, and +205% for the Jun, Sep, and Dec '15 quarters, respectively, versus the year ago periods as earnings rose +62%, +900%, and +820%. The 3 strong quarterly comparisons above the +25% minimum guideline (C criteria) were noted in the 2/09/16 mid-day report - "Helping it better match the fact-based investment system's guidelines."
Its small supply of only 51.8 million shares in the public float (S criteria) may contribute to greater price volatility in the event of institutional buying or selling. The number of top-rated funds owning its shares rose from 175 in Mar '15 to 288 in Mar '16, a very reassuring sign (I criteria). It currently has a Timeliness rating of C, and a Sponsorship Rating of D.
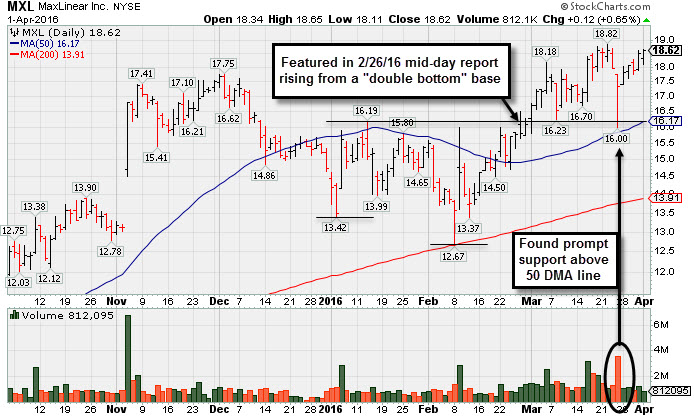
Found Support Above 50 DMA Line Consolidating Near 52-week High - Friday, April 1, 2016
Maxlinear Inc (MXL +$0.12 or +0.65% to $18.62) posted a small gain today on lighter than average volume. It found prompt support after nearly testing its 50-day moving average (DMA) line last week. It was last shown in the FSU section on 3/09/16 with an annotated graph under the headline, "Perched Near Best-Ever Close Following Recent Breakout", as it rebounded back above its "max buy" level.
Disciplined investors avoid chasing extended stocks and always limit losses by selling any stock that falls more than -7% from their purchase price. MXL was first highlighted in yellow with pivot point cited based on its 1/13/16 high in the 2/26/16 mid-day report (read here). It ended up breaking out convincingly with a subsequent streak of gains on above average volume, clearing the previously noted a "double bottom" base and triggering a technical buy signal.
The high-ranked Semiconductor firm saw sales revenues increases of +99%, +193%, and +205% for the Jun, Sep, and Dec '15 quarters, respectively, versus the year ago periods as earnings rose +62%, +900%, and +820%. The 3 strong quarterly comparisons above the +25% minimum guideline (C criteria) were noted in the 2/09/16 mid-day report - "Helping it better match the fact-based investment system's guidelines."
Its small supply of only 51.8 million shares in the public float (S criteria) may contribute to greater price volatility in the event of institutional buying or selling. The number of top-rated funds owning its shares rose from 175 in Mar '15 to 277 in Dec '15, a very reassuring sign (I criteria). It currently has a Timeliness rating of A, and a Sponsorship Rating of C. Its Up/Down Volume Ratio of 1.6 indicates a clear sign of accumulation over the past 50 days.
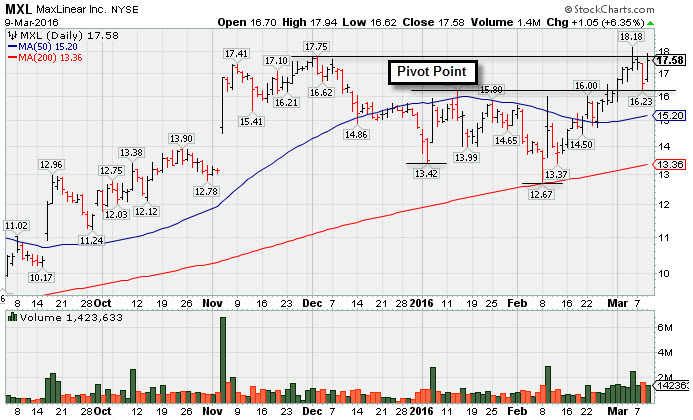
Perched Near Best-Ever Close Following Recent Breakout - Wednesday, March 9, 2016
Maxlinear Inc (MXL +$1.05 or +6.35% to $17.58) rebounded back above its "max buy" level with today's gain. Disciplined investors avoid chasing extended stocks and always limit losses by selling any stock that falls more than -7% from their purchase price.
MXL was first highlighted in yellow with pivot point cited based on its 1/13/16 high in the 2/26/16 mid-day report (read here) and it was shown in that evening's report with an annotated graph under the headline, "Formed Double Bottom Base and Found Support". It ended up breaking out convincingly with a subsequent streak of gains on above average volume, clearing the previously noted a "double bottom" base and triggering a technical buy signal.
Soon it also rallied through additional near-term resistance up through the $17.75 level, then encountered some distributional pressure on the prior session. Today's gain led to a close only 11 cents below its best-ever close of $17.69 on 12/01/15. Further gains into new high territory would be a very reassuring sign that could signal the beginning of a significant advance.
The high-ranked Semiconductor firm saw sales revenues increases of +99%, +193%, and +205% for the Jun, Sep, and Dec '15 quarters, respectively, versus the year ago periods as earnings rose +62%, +900%, and +820%. The 3 strong quarterly comparisons above the +25% minimum guideline (C criteria) were noted in the 2/09/16 mid-day report - "Helping it better match the fact-based investment system's guidelines."
The number of top-rated funds owning its shares rose from 175 in Mar '15 to 274 in Dec '15, a very reassuring sign (I criteria). It currently has a Timeliness rating of A, and a Sponsorship Rating of C. Its Up/Down Volume Ratio of 1.6 indicates a clear sign of accumulation over the past 50 days.
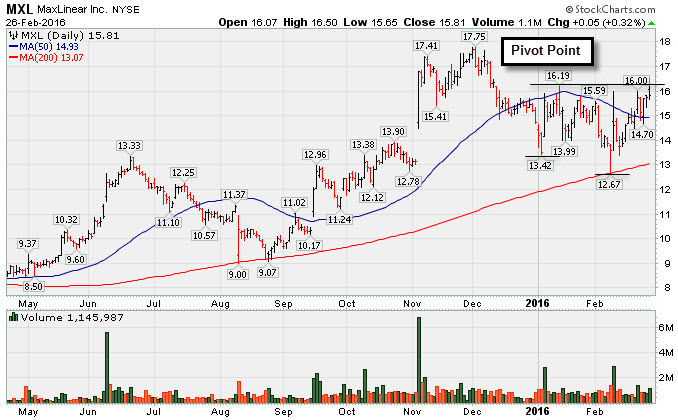
Formed Double Bottom Base and Found Support - Friday, February 26, 2016
Maxlinear Inc (MXL +$0.05 or +0.32% to $15.81) had a weak finish after highlighted in yellow with pivot point cited based on its 1/13/16 high in the earlier mid-day report (read here). Instead of breaking out convincingly, it encountered distributional pressure and finished near the session low with a very small gain on above average volume. It found support at its 200-day moving average (DMA) line while forming a "double bottom" base. Subsequent volume-driven gains above the pivot point may trigger a technical buy signal. However, it also faces additional near-term resistance up through the $17.75 level. Convincing gains into new high territory would be a very reassuring sign that could signal the beginning of a significant advance.
The high-ranked Semiconductor firm saw sales revenues increases of +99%, +193%, and +205% for the Jun, Sep, and Dec '15 quarters, respectively, versus the year ago periods as earnings rose +62%, +900%, and +820%. The 3 strong quarterly comparisons above the +25% minimum guideline (C criteria) were noted in the 2/09/16 mid-day report - "Helping it better match the fact-based investment system's guidelines."
The number of top-rated funds owning its shares rose from 175 in Mar '15 to 271 in Dec '15, a very reassuring sign (I criteria). It currently has a Timeliness rating of B, but a Sponsorship Rating of D. Its Up/Down Volume Ratio of 1.0 indicates no clear sign of accumulation or distribution over the past 50 days. Disciplined investors may have it on their watchlist until fresh signs of serious institutional buying demand might confirm that action is justified.