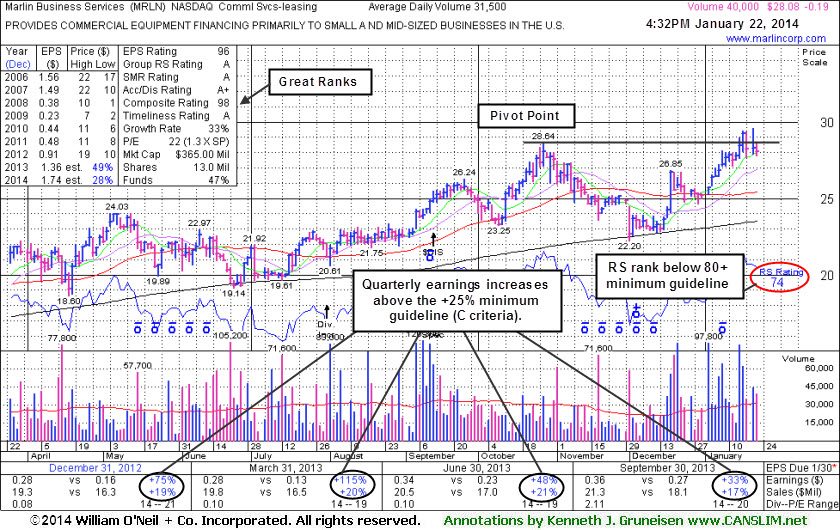
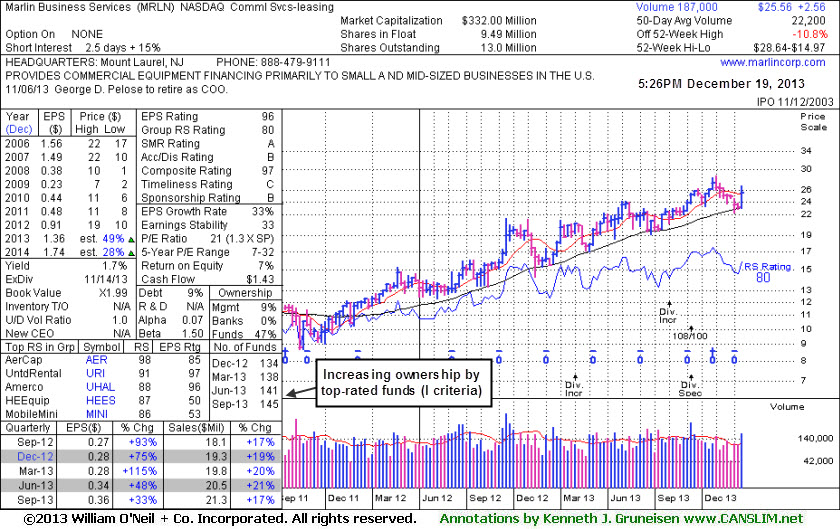
Marlin Business Services (MRLN -$0.34 or -1.20% to $27.93) retreated from its 52-week high today. Recent volume-driven gains triggered a technical buy signal, but since then it has stalled. No resistance remains due to overhead supply, however, due to its lack of meaningful progress over the past 6 months its Relative Strength (RS) rating has recently slumped below the 80+ guideline for buy candidates under than fact-based investment system (see red circle).
It was last shown in this FSU section on 12/19/13 under the headline, "Finished Weak While Enduring Distributional Pressure", after a damaging loss on more than 3 times average volume. It returned to the Featured Stocks list when it was highlighted in yellow in the 12/19/13 mid-day report (read here) with new pivot point cited based on its 10/28/13 high plus 10 cents.
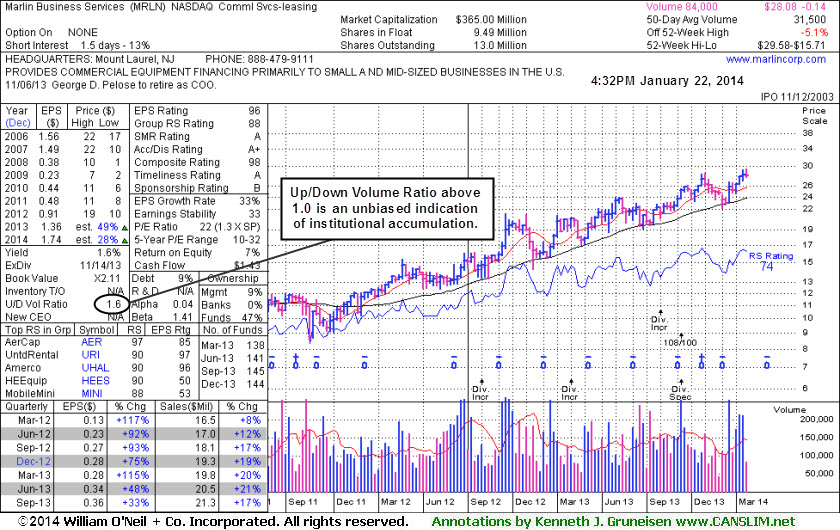
Fundamentals remain strong (C and A criteria) since dropped from the Featured Stocks list on 12/02/13 its found support at its 200 DMA line. MRLN hails from the Commercial Services - Leasing group which now has a mediocre 88 Group Relative Strength Rating, a reassuring sign concerning the L criteria. Return-On-Equity at 7% is below the 17% minimum guideline. With only 9.49 million shares (S criteria) in the publicly traded float it may be particularly volatile in the event of any institutional buying or selling. The number of top-rated funds owning its shares rose from 111 in Mar '12 to 144 in Dec '13, a reassuring sign concerning the I criteria. Its current Up/Down Volume Ratio of 1.6 is an unbiased indication its shares have been under accumulation over the past 50 days.
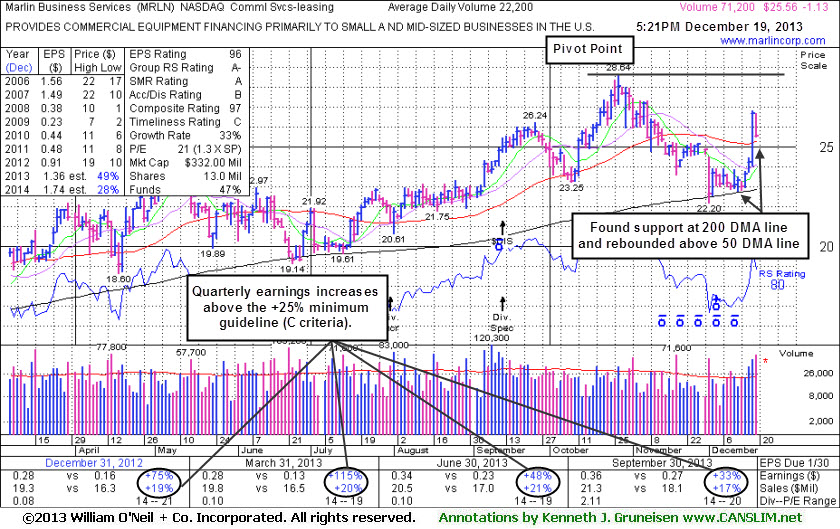
Marlin Business Services (MRLN -$1.13 or -4.29% to $25.56) encountered distributional pressure today and ended near the session low with a loss on more than 3 times average volume. It returned to the Featured Stocks list when it was highlighted in yellow in the earlier mid-day report (read here) with new pivot point cited based on its 10/28/13 high plus 10 cents. It traded up considerably this week with above average volume behind 4 consecutive gains, rebounding from below its 50-day moving average (DMA) line and helping its technical stance improve. Disciplined investors may watch for subsequent volume-driven gains above the pivot point which are needed to trigger a proper new technical buy signal.
Fundamentals remain strong (C and A criteria) since dropped from the Featured Stocks list on 12/02/13 its found support at its 200 DMA line. It was last shown in this FSU section on 11/14/13 under the headline, "Violated 50-Day Moving Average Line Raising Concerns." MRLN hails from the Commercial Services - Leasing group which now has a mediocre 57 Group Relative Strength Rating, not a strong sign concerning the L criteria. Return-On-Equity at 7% is also below the 17% minimum guideline. It is now trading -14% off its 52-week high, facing recently created resistance due to overhead supply. A fresh buy candidate breaking out with volume conviction, meanwhile, would be unhindered by any anxious sellers.
With only 9.49 million shares (S criteria) in the publicly traded float it may be particularly volatile in the event of any institutional buying or selling. The number of top-rated funds owning its shares rose from 111 in Mar '12 to 145 in Sep '13, a reassuring sign concerning the I criteria.
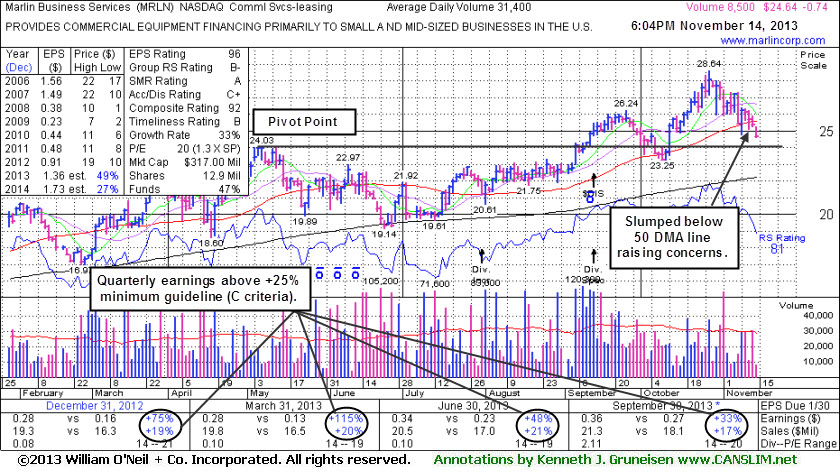
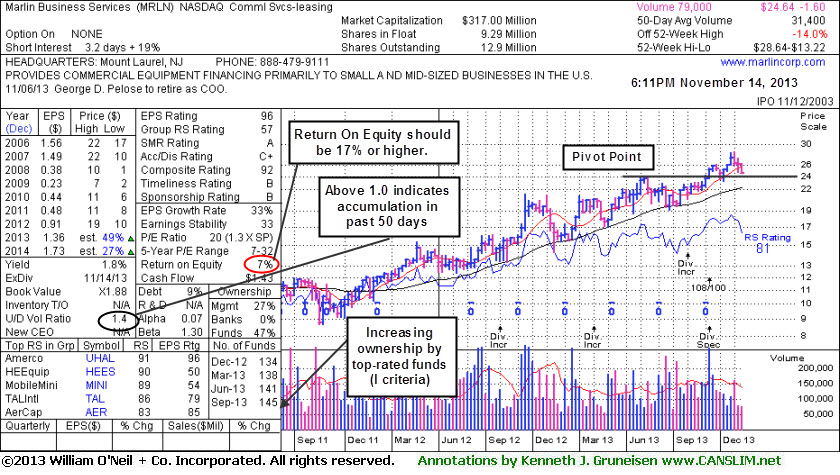
Marlin Business Services (MRLN -$0.63 or -2.49% to $24.64) did not find support at its 50-day moving average (DMA) line. Recent losses on light volume have it trading near the pivot point cited in earlier reports. More damaging losses would raise greater concerns and trigger more worrisome technical sell signals. Disciplined investors always limit losses by selling any stocks that fall more than -7% from their purchase price. It was last shown in this FSU section on 10/08/13 under the headline, "Faring Better Than Others While Testing 50-Day Average Line", and it went on to rally into new high territory before the latest pullback.
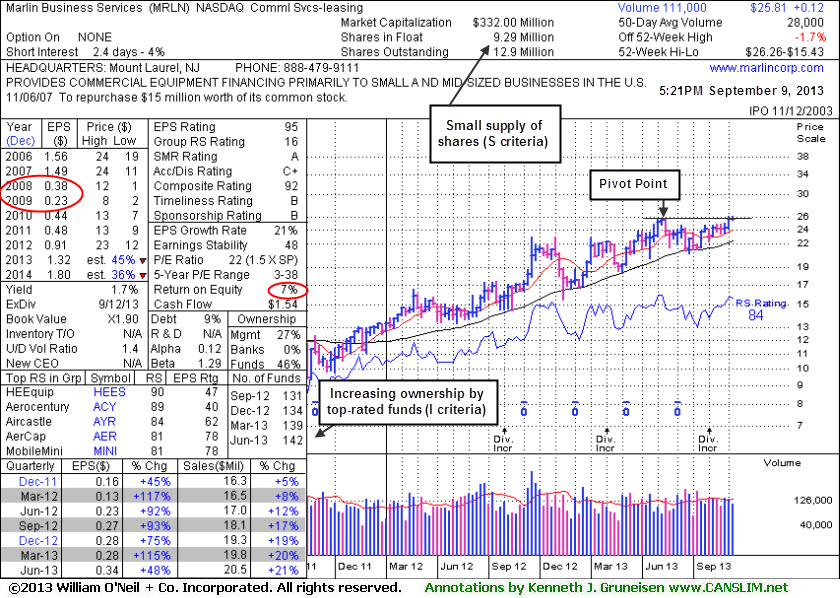
Gains mostly lacked great volume conviction since recently paying a $2.00 per share Special Dividend. It made limited progress since highlighted in yellow with an annotated daily graph showing the new pivot point cited based on its May '13 highs plus 10 cents in the 9/09/13 mid-day report (read here) while noted - "Technically, it broke out with a volume-driven gain on 9/05/13."
MRLN hails from the Commercial Services - Leasing group which now has a mediocre 57 Group Relative Strength Rating, not a strong sign concerning the L criteria. Return-On-Equity at 7% is also below the 17% minimum guideline. It is now trading -14% off its 52-week high, facing recently created resistance due to overhead supply. A fresh buy candidate breaking out with volume conviction, meanwhile, would be unhindered by any anxious sellers.
With only 9.29 million shares (S criteria) in the publicly traded float it may be particularly volatile in the event of any institutional buying or selling. The number of top-rated funds owning its shares rose from 111 in Mar '12 to 145 in Sep '13, a reassuring sign concerning the I criteria. Its current Up/Down Volume Ratio of 1.4 is an unbiased indication that its shares have been under accumulation over the past 50 days.
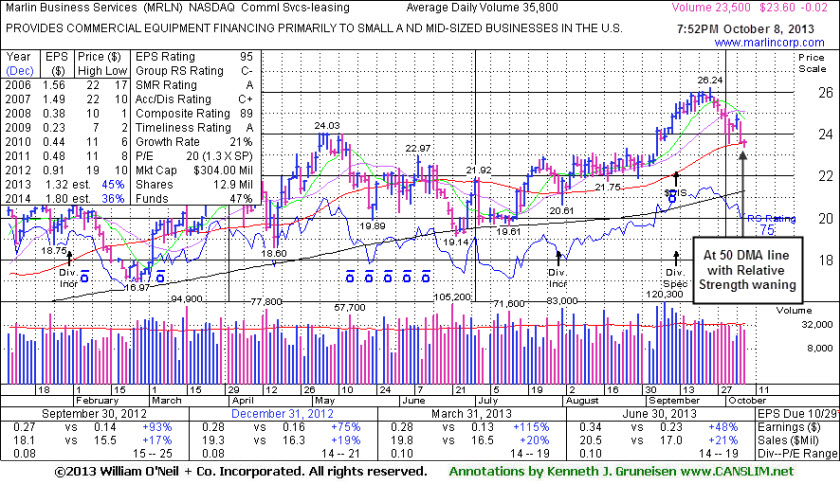
Marlin Business Services (MRLN -$0.02 or -0.08% to $23.60) has been making a stand near its 50-day moving average (DMA) line. Gains lacked great volume conviction since recently paying a $2.00 per share Special Dividend. More damaging losses would raise concerns and trigger technical sell signals. It was last shown in this FSU section on 9/09/13 under the headline, "Following Technical Breakout Broader Market Confirms Rally", after highlighted in yellow with an annotated daily graph showing the new pivot point cited based on its May '13 highs plus 10 cents in the earlier mid-day report (read here) while noted - "Technically, it broke out with a volume-driven gain on 9/05/13."
Many other high-ranked leaders have fared worse and suffered bad technical damage as the broader market (M criteria) has technically shifted into a correction, arguing for investors to adopt a defensive stance and limit losses - see more in today's Market Commentary section. Remember, 3 out of 4 stocks tend to move in the same direction of the major averages. MRLN hails from the Commercial Services - Leasing group which now has a 34 Group Relative Strength Rating, not a good sign concerning the L criteria. Return-On-Equity at 7% is also below the 17% minimum guideline. It is now trading -10% off its 52-week high, facing a little resistance due to overhead supply.
With only 9.29 million shares (S criteria) in the publicly traded float it may be particularly volatile in the event of any institutional buying or selling. The number of top-rated funds owning its shares rose from 111 in Mar '12 to 143 in Jun '13, a reassuring sign concerning the I criteria. Its current Up/Down Volume Ratio of 1.5 is an unbiased indication that its shares have been under accumulation over the past 50 days.
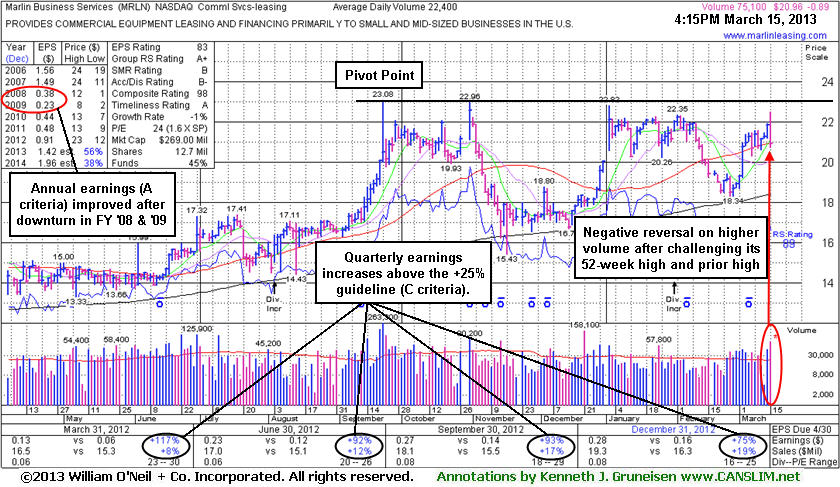
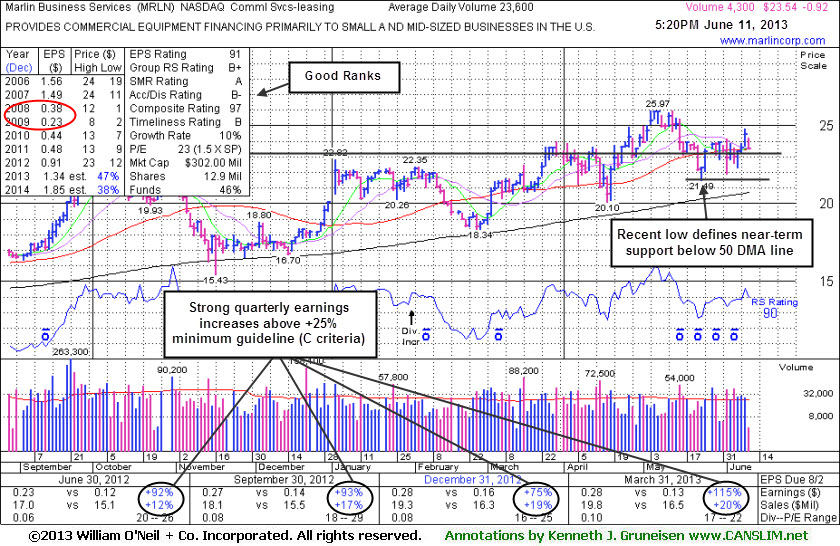
MRLN's fundamentals remain strong and it found support near its 200-day moving average (DMA) line since dropped from the Featured Stocks list on 6/21/13. Recent quarterly comparisons through Jun '13 show strong earnings increases above the +25% minimum guideline satisfying the C criteria. Annual earnings (A criteria) growth has improved following the downturn in FY '08 and '09 (see red circle). It was last shown in this FSU section on 6/11/13 under the headline, "Found Support After Undercutting 50-Day Moving Average", but subsequent losses undercut a noted low ($21.49 on 5/23/13) raising more serious concerns.
The broader market (M criteria) has technically shifted into a confirmed rally, arguing in favor of new buying efforts again - see more in today's Market Commentary section. However, MRLN hails from the Commercial Services - Leasing group which now has a 16 Group Relative Strength Rating, not a good sign concerning the L criteria. Return-On-Equity (see small red circle) is below the 17% minimum guideline.
With only 9.29 million shares (S criteria) in the publicly traded float it may be particularly volatile in the event of any institutional buying or selling. The number of top-rated funds owning its shares rose from 111 in Mar '12 to 142 in Jun '13, a reassuring sign concerning the I criteria. Its current Up/Down Volume Ratio of 1.4 is an unbiased indication that its shares have been under accumulation over the past 50 days. The weekly graph below gives investors a longer term perspective, and shows it facing no resistance due to overhead supply.
MRLN was last seen in this FSU section on 5/23/13 with an annotated graph under the headline, "Shares Did Not Flash Signs of Sufficient Buying Demand for Action Before Latest Slump". Its current Up/Down Volume Ratio of 0.8 is still unbiased bullish indication that its shares have been under distributional pressure over the past 50 days. Recent quarterly comparisons through Mar '13 show strong earnings increases above the +25% minimum guideline satisfying the C criteria. Annual earnings (A criteria) growth has improved following the downturn in FY '08 and '09 (see red circle). The Commercial Services - Leasing group has a B+ Group Relative Strength Rating, a good sign concerning the L criteria. With only 9.26 million shares (S criteria) in the publicly traded float it may be particularly volatile in the event of any institutional buying or selling. The number of top-rated funds owning its shares rose from 111 in Mar '12 to 136 in Mar '13, a reassuring sign concerning the I criteria.
Regardless of any stock's favorable characteristics, disciplined investors always limit losses by selling if the stock falls more than -7% from their purchase price. In this case, taking a small loss might not be necessary if investors heeded the cautionary notes warning that a proper technical buy signal had not occurred in this ideal-looking leader.
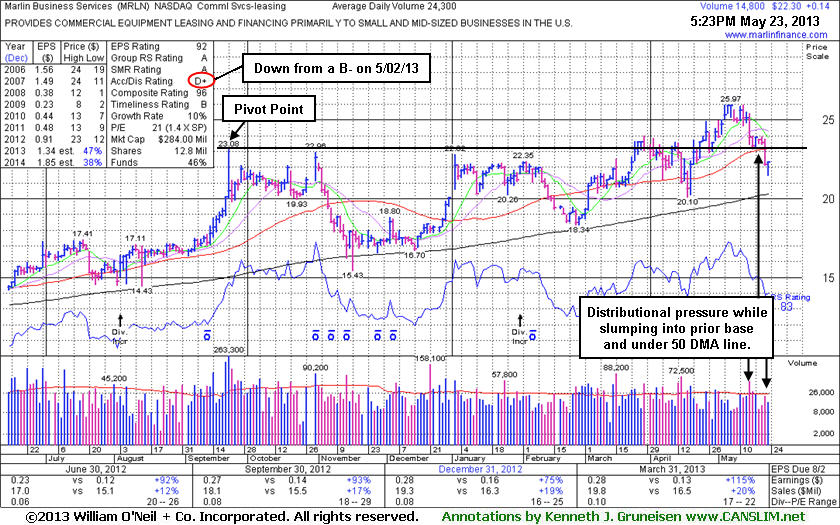
Marlin Business Services (MRLN +$0.14 or +0.63% to $22.30) posted a gain today on light volume. It recently slumped below prior highs in the $23 area and fell back into its prior base raising concerns with losses on higher volume indicating distributional pressure. Its current Up/Down Volume Ratio of 0.8 is also an unbiased bullish indication that its shares have been under distributional pressure over the past 50 days. On the prior session it also violated its 50-day moving average (DMA) line, an important technical threshold for chart readers, triggering worrisome technical sell signals. Only a prompt rebound above its 50 DMA line would help its outlook improve.
Its Accumulation/Distribution Rating has slumped to a D+ from a B- when MRLN was last seen in this FSU section on 5/02/13 with an annotated graph under the headline, "Daily and Weekly Graphs Illustrate Wedging Action". Annotated daily and weekly graphs illustrated the "wedging" action as it advanced into new high territory. As it rallied for its best close of 2013 members were cautioned that it came with a gain - "Backed by very light volume of only 17,000 shares, only 64% of its average (26,600) daily volume total. Comparing the session's lighter-than-average total to the higher-than-average volume totals seen while it was enduring distributional pressure and briefly undercut its 50-day moving average (DMA) line in recent weeks, it remains clear that the price/volume action has not been indicative of especially great new institutional buying demand. One still questions its ability to fight for meaningful and sustained gains into new high territory when it is free to rally with no resistance remaining due to overhead supply and market conditions (the M criteria) are good."
Members were also previously reminded - "Disciplined investors know that there is no advantage to getting in "early" before a technical breakout proves that fresh institutional buying demand is lurking. Watch for for it to make a stand and produce subsequent volume-driven gains for new high (N criteria) above the pivot point to trigger a technical buy signal before action may be justified under the fact-based investment system."
Recent quarterly comparisons through Mar '13 show strong earnings increases above the +25% minimum guideline satisfying the C criteria. Annual earnings (A criteria) growth has improved following the downturn in FY '08 and '09. The Commercial Services - Leasing group has a high 84 Group Relative Strength Rating, a good sign concerning the L criteria. With only 9.18 million shares (S criteria) in the publicly traded float it may be particularly volatile in the event of any institutional buying or selling. The number of top-rated funds owning its shares rose from 111 in Mar '12 to 136 in Mar '13, a reassuring sign concerning the I criteria.
Regardless of any stock's favorable characteristics, disciplined investors always limit losses by selling if the stock falls more than -7% from their purchase price. In this case, taking a small loss might not be necessary if investors heeded the cautionary notes warning that a proper technical buy signal had not occurred in this ideal-looking leader.
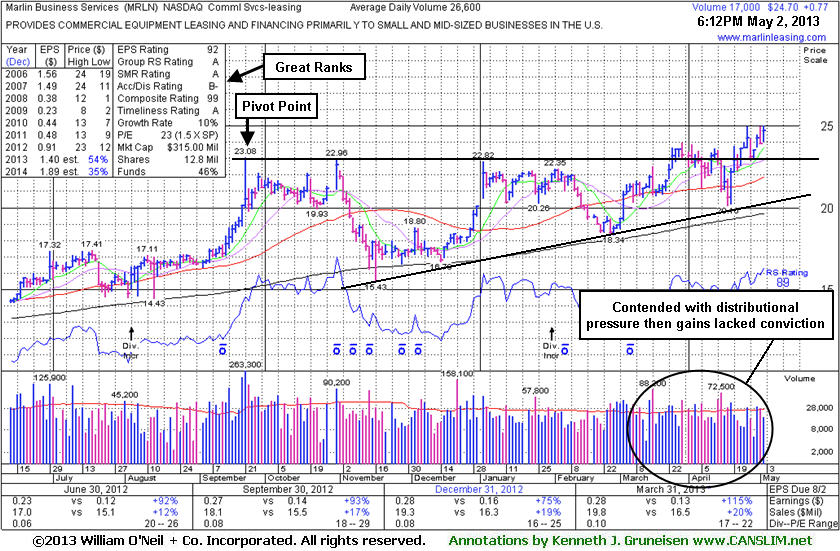
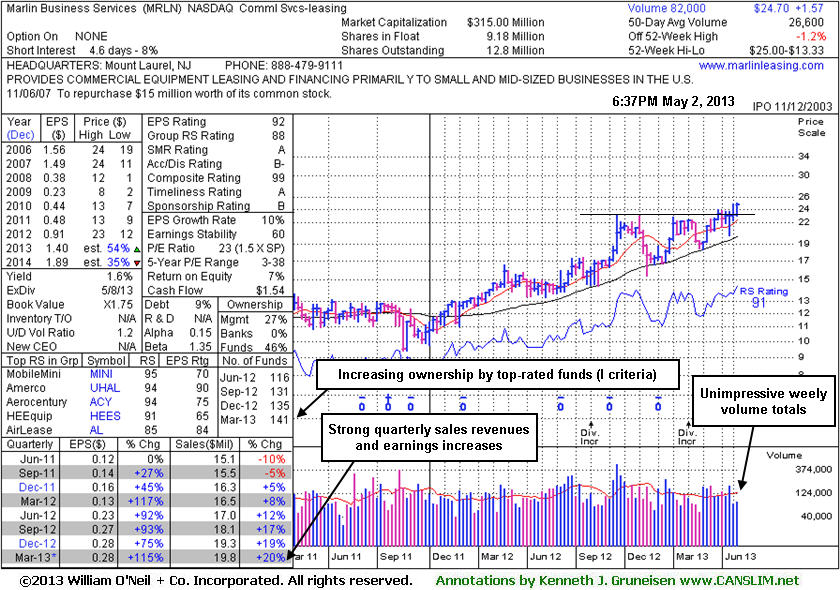
Marlin Business Services (MRLN +$0.77 or +3.22% to $24.70) rallied for its best close of 2013 with a gain today backed by very light volume of only 17,000 shares, only 64% of its average (26,600) daily volume total. Comparing the session's lighter-than-average total to the higher-than-average volume totals seen while it was enduring distributional pressure and briefly undercut its 50-day moving average (DMA) line in recent weeks, it remains clear that the price/volume action has not been indicative of especially great new institutional buying demand. One still questions its ability to fight for meaningful and sustained gains into new high territory when it is free to rally with no resistance remaining due to overhead supply and market conditions (the M criteria) are good. Meanwhile, its color code was changed to green after rallying beyond the "may buy" level.
MRLN was last seen in this FSU section on 4/09/13 with an annotated graph under the headline, "Consolidating Following 'Negative Reversal' at 52-Week High". An upward trendline and its 200 DMA line define support below its 50 DMA line. Members were previously reminded - "Disciplined investors know that there is no advantage to getting in "early" before a technical breakout proves that fresh institutional buying demand is lurking. Watch for for it to make a stand and produce subsequent volume-driven gains for new high (N criteria) above the pivot point to trigger a technical buy signal before action may be justified under the fact-based investment system."
Recent quarterly comparisons through Mar '13 show strong earnings increases above the +25% minimum guideline satisfying the C criteria. Annual earnings (A criteria) growth has improved following the downturn in FY '08 and '09. The Commercial Services - Leasing group has a high 88 Group Relative Strength Rating, a good sign concerning the L criteria. With only 9.18 million shares (S criteria) in the publicly traded float it may be particularly volatile in the event of any institutional buying or selling. The number of top-rated funds owning its shares rose from 111 in Mar '12 to 141 in Mar '13, a reassuring sign concerning the I criteria. Its current Up/Down Volume Ratio of 1.2 is also an unbiased bullish indication that its shares have been under only slight accumulation over the past 50 days. The annotated daily and weekly graphs below illustrate the wedging action as it advanced into new high territory.
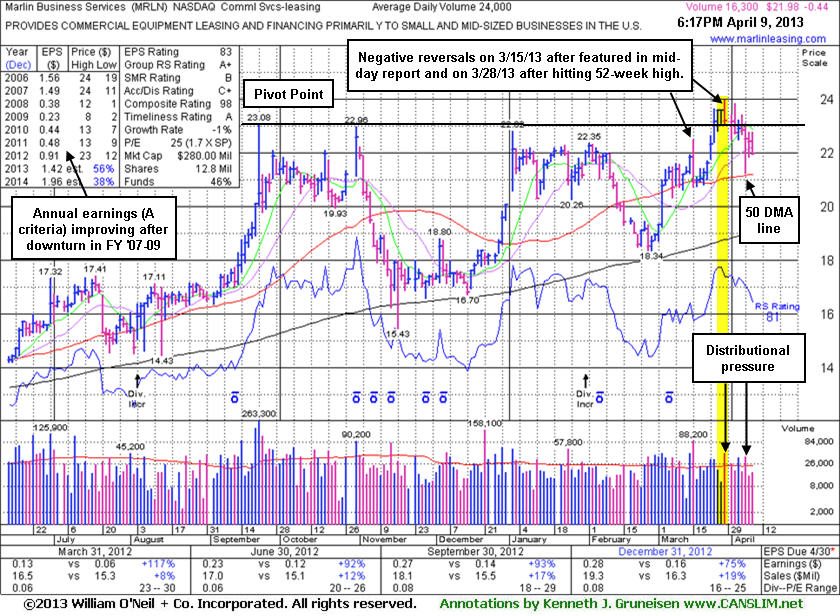
Marlin Business Services (MRLN -$0.44 or -1.96% to $21.98) has been holding its ground well above its 50-day moving average (DMA) line, still perched within close striking distance of its 52-week high. It has endured distributional pressure in recent weeks and was repeatedly noted - "Subsequent volume-driven gains above the pivot point could help clinch a more convincing technical buy signal."
When approaching its 52-week high it tallied volume-driven gains, but it was noted on 3/25/13 - "Action is indicative of institutional accumulation, however it closed the session 2 cents below the pivot point cited". Subsequent gains lacked volume conviction (see yellow highlighted area) and on 3/28/13 it erased early gains for a "negative reversal" and worrisome loss on above average volume. Negative reversals as a stock reaches new highs are signs of distributional pressure, when plenty of institutional selling pressure offsets all buying demand, instead of seeing a powerful momentum-driven breakout.
MRLN was last seen in this FSU section on 3/15/13 with an annotated graph under the headline, "Worrisome Negative Reversal After Strong Start Challenging Highs". It had been highlighted in yellow with pivot point cited based on its 9/21/12 high plus 10 cents in the 3/15/13 mid-day report but erased early gains for a "negative reversal" and worrisome loss on above average volume. Members were previously reminded - "Disciplined investors know that there is no advantage to getting in "early" before a technical breakout proves that fresh institutional buying demand is lurking. Watch for for it to make a stand and produce subsequent volume-driven gains for new high (N criteria) above the pivot point to trigger a technical buy signal before action may be justified under the fact-based investment system."
It found support near its 200-day moving average (DMA) line in recent months. Recent quarterly comparisons through Dec '12 show strong earnings increases above the +25% minimum guideline satisfying the C criteria. Annual earnings (A criteria) growth has improved following the downturn in FY '08 and '09. The Commercial Services - Leasing group has a high 96 Group Relative Strength Rating, a good sign concerning the L criteria. With only 9.18 million shares (S criteria) in the publicly traded float it may be particularly volatile in the event of any institutional buying or selling. The number of top-rated funds owning its shares rose from 111 in Mar '12 to 143 in Mar '13, a reassuring sign concerning the I criteria. Its current Up/Down Volume Ratio of 1.3 is also an unbiased bullish indication that its shares have been under accumulation over the past 50 days.
Marlin Business Services (MRLN -$0.89 or -4.07% to $20.96) was highlighted in yellow with pivot point cited based on its 9/21/12 high plus 10 cents in the earlier mid-day report (read here). It erased early gains for a "negative reversal" and worrisome loss on above average volume. Disciplined investors know that there is no advantage to getting in "early" before a technical breakout proves that fresh institutional buying demand is lurking. Watch for for it to make a stand and produce subsequent volume-driven gains for new high (N criteria) above the pivot point to trigger a technical buy signal before action may be justified under the fact-based investment system. It found support near its 200-day moving average (DMA) line in recent months and has rallied within close striking distance of its 52-week high. Recent quarterly comparisons through Dec '12 show strong earnings increases above the +25% minimum guideline satisfying the C criteria. Annual earnings (A criteria) growth has improved following the downturn in FY '08 and '09 (see red circle). The Commercial Services - Leasing group has a high 97 Group Relative Strength Rating, a good sign concerning the L criteria. With only 9.17 million shares (S criteria) in the publicly traded float it may be particularly volatile in the event of any institutional buying or selling. The number of top-rated funds owning its shares rose from 111 in Mar '12 to 136 in Dec '12, a reassuring sign concerning the I criteria. Its current Up/Down Volume Ratio of 1.6 is also an unbiased bullish indication that its shares have been under accumulation over the past 50 days.