Bounce At Support Offered By 50 Day Moving Average - Thursday, October 18, 2007
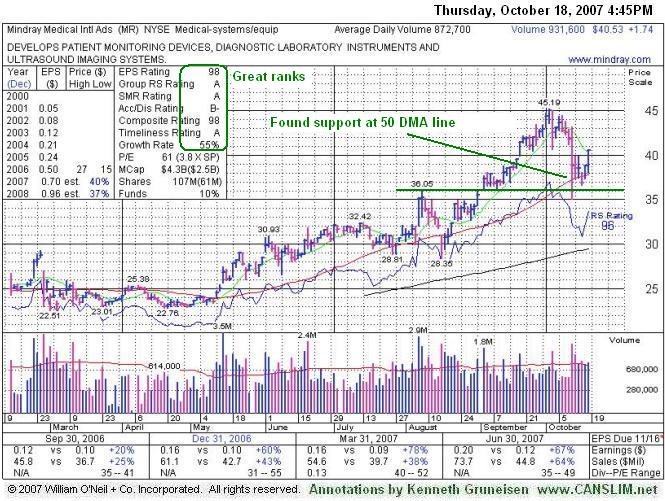
A very important technical tool that savvy investors have learned to incorporate in their technical analysis is the 50-day moving average (DMA) line. The 50 DMA line plays a pivotal role relative to a stock's price. If the price of a stock is above its 50 DMA then odds are that its 50 DMA will act as formidable support. Conversely, if the price is below its 50 DMA then the moving average acts as resistance. Healthy stocks sometimes trade under their 50 DMA lines briefly, but usually a strong candidate will promptly bounce and repair a 50 DMA violation. When a stock has violated its 50 DMA line and then lingers beneath it, the stock's outlook gets worse and worse as it spends a greater period of time trading under that important short-term average line. Once the 50 DMA line starts sloping downward it should also be acknowledged that the stock has been struggling for a while, and it might be time to reduce exposure and look for places to put that money to work in stronger buy candidates.
Mindray Medical International Ltd. (MR +$1.74 or +4.49% to $40.53) rallied after finding support near its 50-day moving average line on Thursday. A stock that finds support near its 50 DMA line after breaking out from a solid base offers investors the chance to accumulate shares before it surges to new highs. Such stocks may be considered buyable from their 50 DMA line up to +5% above their prior chart highs. In this case, that would translate to a $47.45 maximum buy price. Accumulating a stock once it gets extended beyond the maximum buy price is not advised.
The number of top-rated funds owning shares in Mindray Medical Int'l has increased from 29 in Dec '06 to 37 in Sep '07, a reassuring sign concerning the I criteria. This high-ranked Chinese firm was first featured on Thursday, February 22, 2007 in the CANSLIM.net Mid Day Breakouts Report (read here) with a $27.30 pivot point. It rallied for only a couple of days and then got smacked on February 27, 2007, when a sharp drop in Chinese shares sparked a global equity sell off. That action was discussed at length in the February 27, 2007 edition of CANSLIM.net's After Market Update (read here). MR spent a few months basing under and around its 50-day moving average (DMA) line, then it finally started repairing the damage with bullish action throughout May. A few months later, MR appeared in the Tuesday, September 4, 2007 edition of the CANSLIM.net Mid Day Breakouts Report (read here) as it was surging into new high territory. This exemplifies how strong leaders occasionally suffer tough price corrections, but provided they maintain their strong earnings growth, they will often return again as buyable candidates. CANSLIM.net reports often include current details along with references and link to earlier appearances, allowing members to review and learn from past examples.
C A N S L I M | StockTalk | News | Chart | SEC | Zacks Reports | ![]()
![]()
![]()
View all notes | Alert me of new notes | CANSLIM.net Company Profile
Bullish Action In Chinese Medical Firm - Tuesday, September 04, 2007
Volume is a vital component of technical analysis. Prudent investors that incorporate volume into their stock analysis have often benefited several fold. Ideally, healthy stocks will more often tend to rise on higher volume and pullback on lighter volume. Volume is a great proxy for institutional sponsorship. Conversely, high volume declines can be an ominous, as this usually signals distribution and further price deterioration are more likely to follow.
Mindray Medical International Ltd. (MR +$1.83 or +5.16% to $37.32) gapped up and rallied for a new all-time high close, with gains today backed by more than twice its average volume. A stock that finds support near its 50 DMA line after breaking out from a first stage base offers investors the chance to accumulate shares before it surges to new highs. Such stocks may be considered buyable from their 50 DMA line up to +5% above their prior chart highs. In this case, that would translate to a $37.96 maximum buy price. Accumulating a stock once it gets extended beyond the maximum buy price is not advised.
It is one of only two black-boxed stocks on the latest IBD 100 List. Its weekly chart is bullish, with more up weeks on heavier volume and less down weeks on high volume. The number of top-rated funds owning shares has increased from 18 in Sept '06 to 31 in June '07, a reassuring sign concerning the I criteria. This high-ranked Chinese firm was first featured on Thursday, February 22, 2007 in the CANSLIM.net Mid Day Breakouts Report (read here) with a $27.30 pivot point. It rallied for only a couple of days and then got smacked on February 27, 2007, when a sharp drop in Chinese shares sparked a global equity sell off. That action was discussed at length in the February 27, 2007 edition of CANSLIM.net's After Market Update (read here). MR spent a few months basing under and around its 50-day moving average (DMA) line, then it finally started repairing the damage with bullish action throughout May. The healthy action helped prompt its appearance at $29.80 in the "Stocks To Watch In This New Market" section of the June 2007 edition of CANSLIM.net News (read here) which highlighted its strong characteristics with an annotated graph and extensive details. A few weeks later, MR appeared in the July 18, 2007 edition of the CANSLIM.net Mid Day Breakouts Report (read here) as it was pulling back towards its 50 DMA line.
C A N S L I M | StockTalk | News | Chart | ![]() DGO | SEC | Zacks Reports
DGO | SEC | Zacks Reports

View all notes | Alert me of new notes | CANSLIM.net Company Profile
Before 7-8% Rule May Apply, Expect Support at 50 DMA and Prior Highs - 7/18/2007
A very important technical tool that savvy investors have learned to incorporate in their technical analysis is the 50-day moving average (DMA) line. The 50 DMA line plays a pivotal role relative to a stock's price. If the price of a stock is above its 50 DMA then odds are that its 50 DMA will act as formidable support. Conversely, if the price is below its 50 DMA then the moving average acts as resistance. Healthy stocks sometimes trade under their 50 DMA lines briefly, but usually a strong candidate will promptly bounce and repair a 50 DMA violation. When a stock has violated its 50 DMA line and then lingers beneath it, the stock's outlook gets worse and worse as it spends a greater period of time trading under that important short-term average line. Once the 50 DMA line starts sloping downward it should also be acknowledged that the stock has been struggling for a while, and it might be time to reduce exposure and look for places to put that money to work in stronger buy candidates.
Mindray Medical International Ltd. (MR -$1.12 or -3.62% to $29.85) gapped down today, violating a previously noted upward trendline (not shown), and quickly pulling back toward chart support offered by its 50-day moving average (DMA) line and its prior (February) chart highs in the $29.00 area. It is of the utmost importance to see the bulls show up and quell the bearish pressure, rather than having further declines cause more serious technical damage. The volume patterns during its pullback are healthy thus far, which suggests that large institutional investors are not eagerly dumping shares. But further declines could negate the recent breakout and hurt its near term chances of going on to produce great gains. MR is still trading above the its most recent $29.13 pivot point. A definitive technical sell signal could be triggered if it closes below its 50 DMA line and/or falls under the prior chart highs or its pivot point, especially if damaging losses are accompanied by heavier than average trading volume totals. As always, a stock should be sold it falls 7-8% below your purchase price. However, once a stock you've bought has traded up, you may often be able to identify technical points where it makes sense to sell even sooner. Experienced investors know that it is important to protect profits and/or to sometimes minimize losses by selling a weakening issue before it is given a chance to fall as much as 7-8%.
MR was first featured on Thursday, February 22, 2007 in the CANSLIM.net Mid Day Breakouts Report (read here) with a $27.30 pivot point. It rallied for only a couple of days and then got smacked on February 27, 2007, when a sharp drop in Chinese shares sparked a global equity sell off. That action was discussed at length in the February 27, 2007 edition of CANSLIM.net's After Market Update (read here). MR spent a few months basing under and around its 50-day moving average (DMA) line, then it finally started repairing the damage with bullish action throughout May. The healthy action helped prompt its appearance in the "Stocks To Watch In This New Market" section of the June 2007 edition of CANSLIM.net News (read here) which highlighted its strong characteristics. That detailed report identified the stock's most recent $29.13 pivot point and $30.59 "maximum buy" price. Undisciplined investors who may have purchased the stock at $32 or more need to review their trade history and improve upon the manner in which they trade in the future, avoiding chasing stocks that are extended beyond the proper guidelines.
C A N S L I M | StockTalk | News | Chart | ![]() DGO | SEC | Zacks Reports
DGO | SEC | Zacks Reports

View all notes | Alert me of new notes | CANSLIM.net Company Profile
Negative Reversal Raises Concerns - Wednesday, June 20, 2007
After a stock breaks out, it is imperative to continue monitoring its daily and weekly price and volume patterns for any possible ailments that may develop. Every so often, there are a few ominous technical signals that emerge. Prudent investors have learned to identify them due to the fact that they tend to lead to lower prices. One of these disconcerting technical signals is called a negative reversal.
A negative reversal occurs when a stock opens up the session heading higher but then reverses and ultimately closes lower. Reversals are often considered more severe if the stock's initial gains lift it to a new high, but it then reverses and closes for a loss on heavier than average volume and ends near the session's utmost lows. Negative reversals can occur on a daily, weekly and monthly chart. In general, the longer the time frame involved, the more concern is prompted by the severity of the reversal. Volume is directly correlated with the severity as well.
Mindray Medical International Ltd. (MR -$0.51 or -1.68% to $29.88) negatively reversed from a new all-time high today, ending with a loss on higher volume that raises some concerns. It is of the utmost importance to see the bulls show up and quell the bearish pressure, rather than having further declines cause more serious technical damage. It closed slightly above its pivot point, but further declines could negate the recent breakout and hurt its chances of going on to produce great gains. If so, the stock will probably need to spend a fair amount more time consolidating before it is finally ready to put together a meaningful rally. As always, a stock should be sold before it falls -8% below your purchase price. MR was first featured on Thursday, February 22, 2007 in the CANSLIM.net Mid Day Breakouts Report (read here) with a $27.30 pivot point. It rallied for only a couple of days and then got smacked on February 27, 2007, when a sharp drop in Chinese shares sparked a global equity sell off. That action was discussed at length in the February 27, 2007 edition of CANSLIM.net's After Market Update (read here).
MR spent a few months basing under and around its 50-day moving average (DMA) line, then it finally started repairing the damage with bullish action throughout May. The healthy action helped prompt its appearance in the "Stocks To Watch In This New Market" section of the June 2007 edition of CANSLIM.net News (read here) which highlighted its strong characteristics. That detailed report identified the stock's most recent $29.13 pivot point and $30.59 "maximum buy" price.
C A N S L I M | StockTalk | News | Chart | SEC | Zacks Reports

View all notes | Alert me of new notes | CANSLIM.net Company Profile
Chinese Medical Firm Stages Strong Breakout - Saturday, June 02, 2007
|
Mindray Medical International Ltd |
||
|
Ticker Symbol: MR (NYSE) |
Industry Group: Medical Instruments & Supplies |
Shares Outstanding: 106,000,000 |
|
Price: $29.80 |
Day's Volume: 1,439,800 6/1/2007 |
Shares in Float: 28,200,000 |
|
52 Week High: $30.73 6/1/2007 |
50-Day Average Volume: 556,200 |
Up/Down Volume Ratio: 1.5 |
|
Pivot Point: $29.13 5/22/2007 high plus .10 |
Pivot Point +5% = Max Buy Price: $30.59 |
Web Address: http://www.mindray.com.cn |
C A N S L I M | StockTalk | News | Chart | ![]() DGO | SEC | Zacks Reports
DGO | SEC | Zacks Reports
View all notes | Alert me of new notes | CANSLIM.net Company Profile
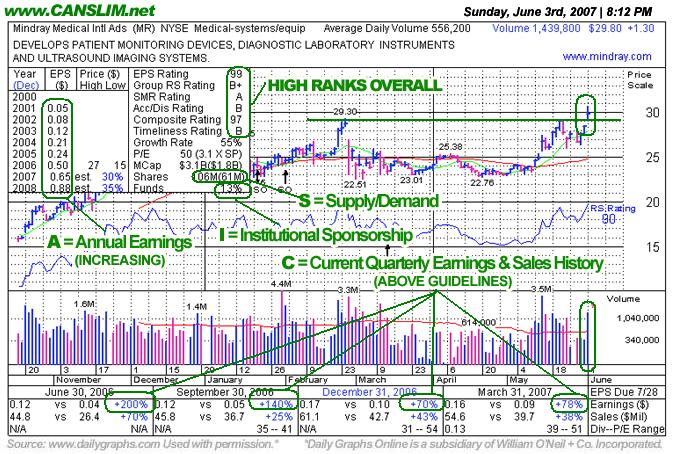
CANSLIM.net Profile: Mindray Medical International Limited was incorporated in 2005 and is headquartered in Shenzhen, the Peoples Republic of China. It develops, manufactures, and markets medical devices in China and throughout Asia and Europe. It offers approximately 40 products through its three segments: Patient Monitoring Devices, Diagnostic Laboratory Instruments, and Ultrasound Imaging Systems. The company sells its products primarily to distributors and directly to hospitals, clinics, government agencies, original design manufacturers, and original equipment manufacturers. It also designs and develops equipment to customers specifications. The stock has scored healthy percentage gains in each of its past four quarterly comparisons versus the year earlier quarter, satisfying the "C" criteria. Its annual history is also steadily improving which helps this healthy stock satisfy the "A" guideline. The "I" criteria is clinched by the number of top rated funds owning an interest rising from 18 funds in Sept '06 to 32 funds as of March '07, and its bullish price/volume chart action also suggests that its shares are being accumulated. MR is a member of the 55th ranked Medical - systems/equip group out of the 197 Industry Groups covered in the paper, which is just outside the much coveted top quartile. There is additional leadership in the group to help satisfy the "L" criteria, including Cynosure Inc. (CYNO), another stock featured in this month's newsletter.
What to Look For and What to Look Out For: For the best results it is often wise to avoid buying stocks extended beyond guidelines, so be careful not to buy this stock after it trades above its $30.59 maximum buy price. Look for this stock to continue advancing in the next few days and weeks with gains on heavier volume and lighter volume consolidations. Conversely, if MR rolls over and falls back into its prior base then the recent bullish action will be negated. Volatility associated with the China market could also offer some challenges, however, so managing risk is critical. Any serious reversal and technical breakdown beyond 7-8% from one's purchase price would serve as a decisive technical sell signal.
Technical Analysis: The stock surged above its chart highs from 3-month earlier and cleared its pivot point on Friday, June 1st, 2007 with a considerable gain while 1.4 million shares traded on the stock which normally trades about 556,200 shares daily. Whenever a stock jumps into new high territory on heavy volume it is a classic sign of heavy institutional buying demand (the "I" criteria). The breakout to new all-time highs may signal the beginning of a substantial and sustained rise, which is why there is always a focus on stocks with very heavy volume behind a meaningful rise in price. The weekly chart for MR also has bullish characteristics that include several up weeks on above average volume with only one or two down weeks on above average volume in the past few months.
When to Sell - Chinese Stock Smacked - Tuesday, February 27, 2007
One of the critical characteristics of successful investing is knowing when to sell. CANSLIM oriented investors are best served when the buy based on the combination of strong fundamentals and technicals, then sell based on the technicals. The reason is because fundamentals often tend to lag a stock's technical condition and come to light later to help explain the technical chart action after the fact.
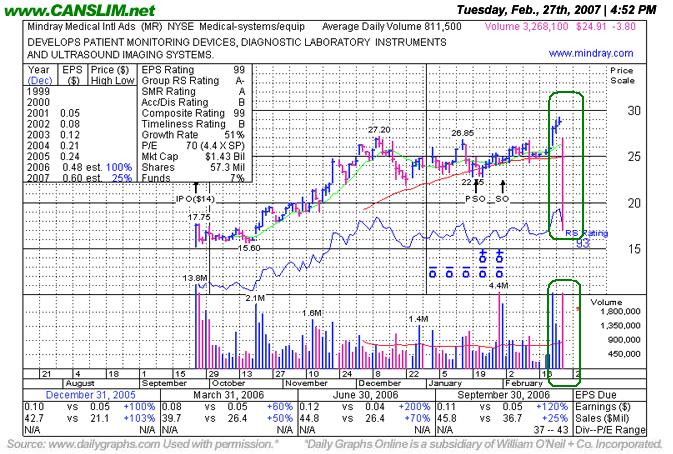
Mindray Medical International Ltd. (MR -$3.691 or -12.91% to $24.91), a Chinese medical company, gapped lower today and negated its recent breakout. It fell more than enough that any investors who made recent purchases (within proper guidelines) would have been prompted to limit their loss - specifically due to the usual 7-8% "maximum loss" sell rule. This stock was first featured on Thursday, February 22, 2007 in the CANSLIM.net Mid Day Breakouts Report (read here) with a $27.30 pivot point. It rallied over the course of the next two days, and it closed on Monday, February 26, 2007 above its $28.67 maximum buy price. In the three days after it was featured, this stock was experiencing nearly perfect post-breakout action, steadily marching higher without pulling back and testing its pivot point.
Overnight, the Chinese stock market plunged a whopping -9% and triggered a massive tsunami of selling across the globe. By the time the US markets opened, a slew of Chinese stocks gapped lower including Mindray. At the session's open it had immediately negated its recent breakout and subsequent bullish action. It closed well above its session lows and near the 50-day moving average (DMA) line, which is normally a place to expect support to step up. However, the fact that this candidate has dropped back into its prior base greatly hurts its chances for a sustained near-term advance. It is of the utmost importance to sell stocks when sell rules are triggered, and in this case the stock should have been sold once it dropped -7-8% below any disciplined investors' purchase price.
C A N S L I M | StockTalk | News | Chart | ![]() DGO | SEC | Zacks Reports
DGO | SEC | Zacks Reports
View all notes | Alert me of new notes | CANSLIM.net Company Profile
Medical Stock Heats Up - Thursday, February 22, 2007
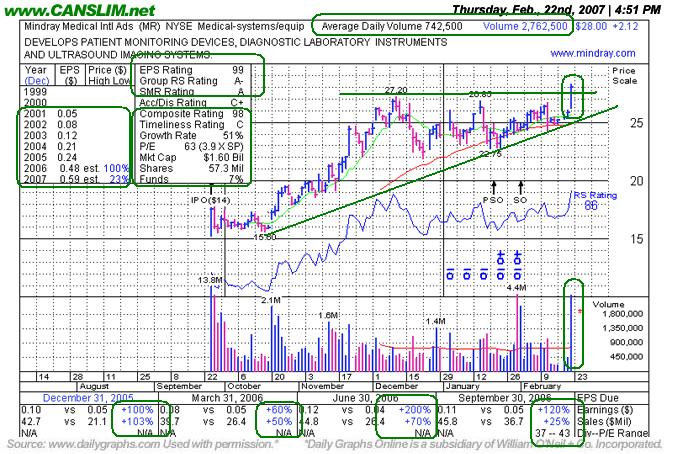
Group action plays a very important role, and experienced investors learn that they can increase their odds of picking a great winner by always focusing their buying efforts in the market's leading groups. The "L" criteria in CAN SLIM(R) tells us to choose leading companies in leading industry groups, thus it is suggested that investors choose from the top quartile of the 197 Industry Groups (listed in the paper most days on page B4).
Mindray Medical International Ltd. (MR $2.12 or +7.21% to $27.28) jumped out of a flat base with a considerable gain on nearly four times normal volume. This stock was first featured in today's CANSLIM.net Mid Day Breakouts Report (read here) with a $27.30 pivot point and a $28.67 maximum buy price. Mindray Medical sports a very healthy Earnings Per Share (EPS) rating of 99. It is also encouraging to see the company earn a healthy Relative Strength (RS) rating of 86, which will probably increase after today's impressive price progress. The company has managed to increase its earnings by well over the +25% guideline in each of the past four quarterly comparisons versus the year earlier, satisfying the "C" criteria. MR resides in the Medical-systems/equip group which is currently ranked 37th of out the 197 Industry Groups covered in the paper, placing it in the much preferred top quartile and satisfying the "L" criteria. On Thursday, MR jumped above its pivot point with gains and the necessary volume to trigger a proper technical buy signal. It would be very encouraging to see MR follow through with more healthy gains on heavier volume over the next few days and weeks. It is important to note that this stock is quickly approaching its "maximum buy" price of $28.67, where buying beyond that level is not proper under the guidelines. As always, it is of the utmost importance to sell a stock if it drops 7-8% below your purchase price.
C A N S L I M | StockTalk | News | Chart | ![]() DGO | SEC | Zacks Reports
DGO | SEC | Zacks Reports
View all notes | Alert me of new notes | CANSLIM.net Company Profile