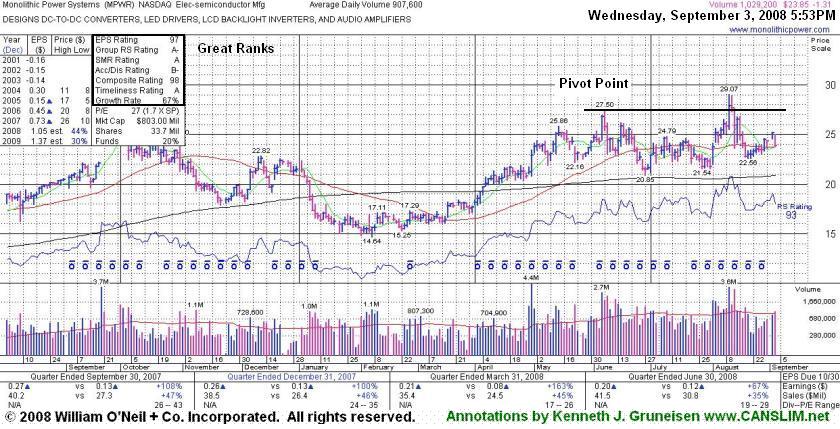
Pullbacks Under Pivot Points Negated Breakouts - Wednesday, September 03, 2008
Statistically, about 40% of winning stocks will pull back after breaking out. In other words, it is not uncommon for stocks to pullback and retest support near their pivot point after breaking out. It is important to see the bulls show up and offer support at or above the pivot point. This may offer investors a chance to increase their exposure before the stock continues advancing. However, an important caveat is that volume should contract as the stock pulls back towards its pivot point. Heavy volume behind losses can be cause for concern, especially if the stock does not find support at its pivot point. Whenever a recent breakout is completely negated by a loss that leads to a close back in the prior base, this is construed as a technical sell signal and a sign that the bears are regaining control.
Monolithic Power Systems Inc. (MPWR -$1.34 or -5.96% to $23.82) fell today with volume increasing to slightly above average levels, slumping toward its 50-day moving average (DMA) line. It was recently featured in yellow after it had rebounded, making it into the 08/11/2008 Mid-Day Breakouts Report; but it encountered distributional pressure and negated that breakout, promptly falling back below its pivot point. It has not been able to make meaningful headway this year, and failed once before after a similar breakout. It was first featured on Friday, June 06, 2008 in the CANSLIM.net Mid Day Breakouts Report (read here), but shorty thereafter the stock encountered resistance. It raised concerns as it pulled back considerably, and an annotated graph was included on Thursday, June 12, 2008 under the headline "Distributional Action Negated Recent Breakout".
C A N S L I M | StockTalk | News | Chart | SEC | Zacks Reports | ![]()
![]()
![]()
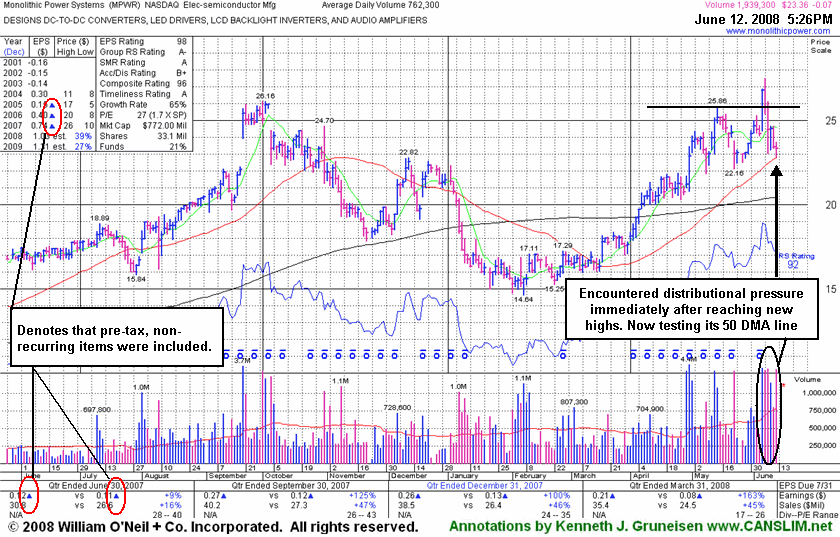
Distributional Action Negated Recent Breakout - Thursday, June 12, 2008
A very important technical tool that savvy investors have learned to incorporate in their technical analysis is the 50-day moving average (DMA) line. The 50 DMA line plays a pivotal role relative to a stock's price. If the price of a stock is above its 50 DMA then odds are that its 50 DMA will act as formidable support. Conversely, if the price is below its 50 DMA then the moving average acts as resistance. Healthy stocks sometimes trade under their 50 DMA lines briefly, but usually a strong candidate will promptly bounce and repair a 50 DMA violation. When a stock has violated its 50 DMA line and then lingers beneath it, the stock's outlook gets worse and worse as it spends a greater period of time trading under that important short-term average line. Once the 50 DMA line starts sloping downward it should also be acknowledged that the stock has been struggling for a while, and it might be time to reduce exposure and look for places to put that money to work in stronger buy candidates.
Monolithic Power Systems (MPWR -$0.07 or -0.30% to $23.36) has encountered distributional pressure since it was first featured on Friday, June 06, 2008 in the CANSLIM.net Mid Day Breakouts Report (read here) with a $25.96 pivot point and $27.26 max buy price. At the time it was noted as follows - "Negatively reversed today's early gains after hitting a new all-time high, pulling back near its pivot point. Considerable gain on 6/05/08 with heavy volume helped it technically break out to all-time highs following a previously noted 7-month cup-shaped pattern. It has high ranks and apparently good sales revenues and earnings growth, however some concerns are raised by either re-statements or quarterly pre-tax, non-recurring items included in every quarterly financial report in recent years."
In the annotated graph below you can see that heavy volume accompanied the losses leading MPWR to pull back into its prior base, which is a sign of institutional selling pressure called "distribution". That negated its breakout. A subsequent violation of its 50 DMA line, which it closed just above, would raise greater concerns and trigger a technical sell signal. Also note the blue triangles to the right of the figures (by the annual and quarterly earnings per share numbers) in the graph below, which denote that pre-tax, non-recurring items were included. When there are lots of these it raises questions about the company's fundamentals. Nonetheless, all other criteria appear to be strong, and this high-ranked leader should remain on an active watch list for now. Future gains back above its pivot point would be very encouraging, however that improvement needs to occur along with the major averages producing a sound follow-through day, otherwise the investment system's guidelines discourage new buys.
C A N S L I M | StockTalk | News | Chart | SEC | Zacks Reports | ![]()
![]()
![]()
View all notes | Alert me of new notes | CANSLIM.net Company Profile