Pullback Testing Prior Highs Following Latest Breakout - Monday, June 25, 2012
Mellanox Technologies Ltd (MLNX -$1.09 or -1.57% to $68.24) ended in the upper third of its intra-day range and above its pivot point today. Prior highs define chart support to watch. Disciplined investors limit losses if ever a stock falls more than -7% from their purchase price. The weekly graph below illustrates it recently hitting new 52-week highs while rising from a 9-week cup-shaped base without a handle.
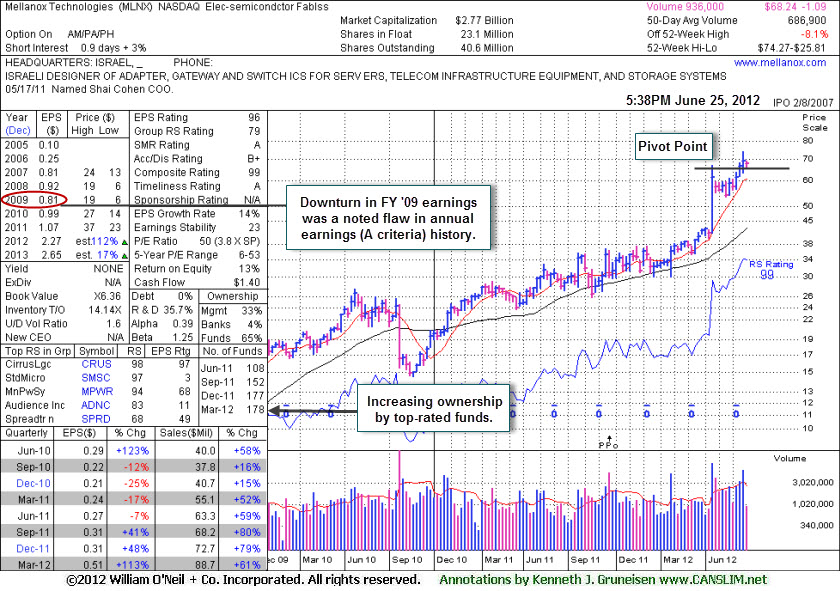
It was featured with an annotated daily graph in yellow in the 6/18/12 mid-day report (read here) with a pivot point cited based on its 4/19/12 high plus 10 cents. It stayed well above its 50-day moving average (DMA) line during the latest consolidation. Reported earnings +113% on +61% sales revenues for the quarter ended March 31, 2012 versus the year ago period. Its streak of 3 strong quarterly earnings comparisons now satisfies the C criteria. A downturn in FY '09 earnings is a small flaw in its annual earnings (A criteria) history. Top-rated funds owning its shares rose from 108 in Jun '11 to 178 in Mar '12 a reassuring sign concerning the I criteria.