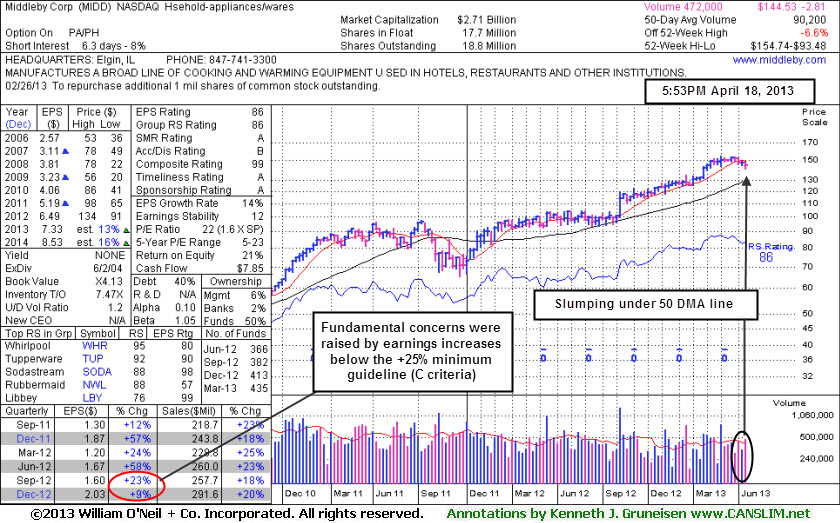
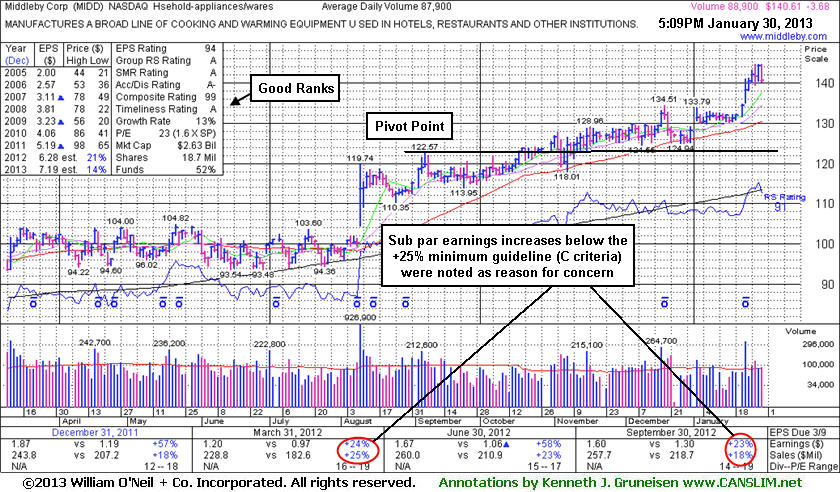
Middleby Corp (MIDD +$1.51 or +1.06% to $144.53) is still lingering below its 50-day moving average (DMA) line, and it recently slumped under prior lows in the $144 area raising greater concerns. Technically, a rebound above its 50 DMA line is needed for its outlook to improve. It Relative Strength rating is 86 and it is only -6.6% off its 52-week high. Fundamental concerns were repeatedly noted since its last appearance in this FSU section on 3/25/13 with an annotated graph under the headline, "Resilient Leader Still Near Highs After Fundamental Flaws Raised Concerns". Prior reports noted - "Disciplined investors may watch closely for sell signals if holding it and giving it a chance to produce more climactic gains."
Earnings +9% on +20% sales for the Dec '12 quarter marked its 2nd consecutive quarterly comparison with an earnings increase below the +25% minimum earnings guideline (C criteria), raising more concerns. The number of top-rated funds owning its shares rose from 351 in Dec '11 to 435 in Mar '13, a reassuring sign concerning the I criteria. Its small supply (S criteria) of only 17.1 million shares in the public float can contribute to greater price volatility in the event of institutional buying or selling. Based on its recent fundamental and technical weakness it will be dropped from the Featured Stocks list tonight.
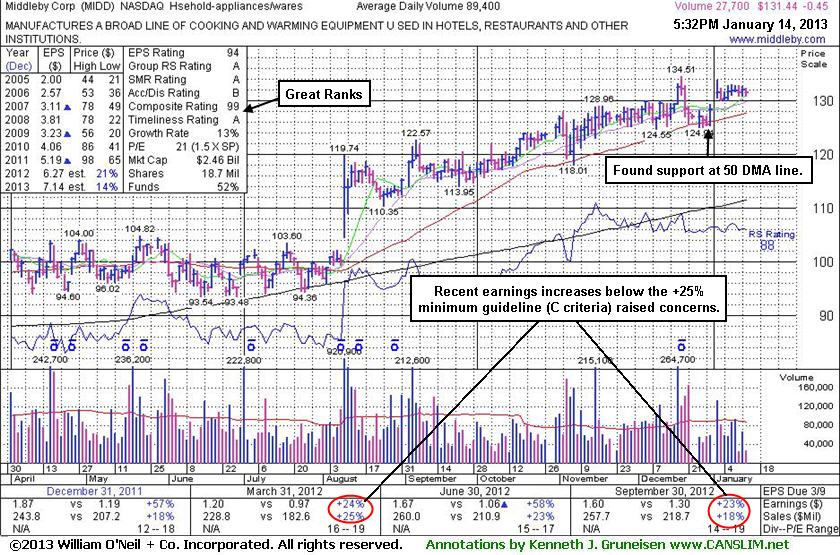
Earnings +9% on +20% sales for the Dec '12 quarter marked its 2nd consecutive quarterly comparison with an earnings increase below the +25% minimum earnings guideline (C criteria), raising more concerns. The number of top-rated funds owning its shares rose from 351 in Dec '11 to 413 in Dec '12, a reassuring sign concerning the I criteria. Its current Up/Down Volume Ratio of 2.0 is still an unbiased indication its shares have been under accumulation over the past 50 days. Its small supply (S criteria) of only 17.1 million shares in the public float can contribute to greater price volatility in the event of institutional buying or selling.
MIDD has traded up as much as +29% since first highlighted in yellow in the 8/09/12 mid-day report as it gapped up and broke out from a long flat base with a considerable gain 9 times average volume. Prior reports cautioned members - "Investors who are disciplined, selective, and patient would likely watch for a fresh breakout in another high-ranked stock without any fundamental flaws, rather than looking for excuses to buy one that has flaws."
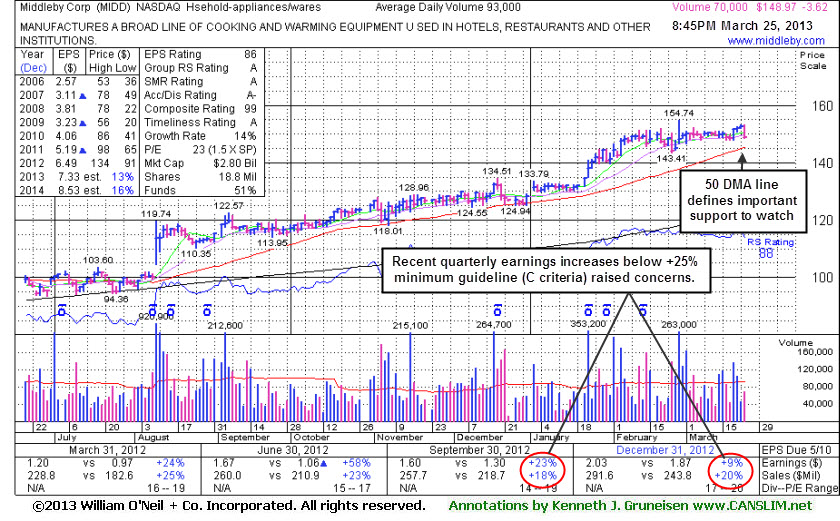
Earnings +23% on +18% sales for the Sep '12 quarter, below the +25% minimum earnings guideline (C criteria), raised concerns. The number of top-rated funds owning its shares rose from 351 in Dec '11 to 406 in Dec '12, a reassuring sign concerning the I criteria. Its current Up/Down Volume Ratio of 1.8 is still an unbiased indication its shares have been under accumulation over the past 50 days, despite the worrisome negative reversals noted. Its small supply (S criteria) of only 17.1 million shares in the public float can contribute to greater price volatility in the event of institutional buying or selling.
MIDD has traded up as much as +28.8% since first highlighted in yellow in the 8/09/12 mid-day report as it gapped up and broke out from a long flat base with a considerable gain 9 times average volume. Investors who are disciplined, selective, and patient would likely watch for a fresh breakout in another high-ranked stock without any fundamental flaws, rather than looking for excuses to buy one that has flaws and one that is also extended from a sound base and enduring distributional pressure.
Its last appearance in this FSU section was on 1/14/13 with an annotated graph under the headline, "Found Technical Support But Fundamental Flaws Remain a Concern". The number of top-rated funds owning its shares rose from 351 in Dec '11 to 389 in Dec '12, a reassuring sign concerning the I criteria. Today its current Up/Down Volume Ratio of 1.7 is an unbiased indication its shares have been under accumulation over the past 50 days. Its small supply (S criteria) of only 17.1 million shares in the public float can contribute to greater price volatility in the event of institutional buying or selling. It has traded up as much as +22% since first highlighted in yellow in the 8/09/12 mid-day report as it gapped up and broke out from a long flat base with a considerable gain 9 times average volume. A "breakaway gap" was noted as the one exception where buying at more than +5% above prior highs is permitted under the fact-based system (read here).
Investors who are disciplined, selective, and patient would likely watch for a fresh breakout in another high-ranked stock without any fundamental flaws, rather than looking for excuses to buy one with flaws and one that is extended from a sound base.
Prior reports cautioned members - "Disciplined investors may watch closely for sell signals if holding it and giving it a chance to produce more climactic gains. Its 50-day moving average (DMA) line defines near-term chart support to watch where any violation would trigger a technical sell signal. It reported earnings +23% on +18% sales for the Sep '12 quarter, below the +25% minimum earnings guideline (C criteria), raising fundamental concerns. Prior reports also cautioned that its annual earnings (A criteria) had a downturn in FY '09, yet they have otherwise been good and steady."
The number of top-rated funds owning its shares rose from 351 in Dec '11 to 388 in Dec '12, a reassuring sign concerning the I criteria. Today its current Up/Down Volume Ratio of 1.5 is an unbiased indication its shares have been under accumulation over the past 50 days. Its small supply (S criteria) of only 17.1 million shares in the public float can contribute to greater price volatility in the event of institutional buying or selling.
Investors who are disciplined, selective, and patient would likely watch for a fresh breakout in another high-ranked stock without any fundamental flaws, rather than looking for excuses to buy one with flaws.
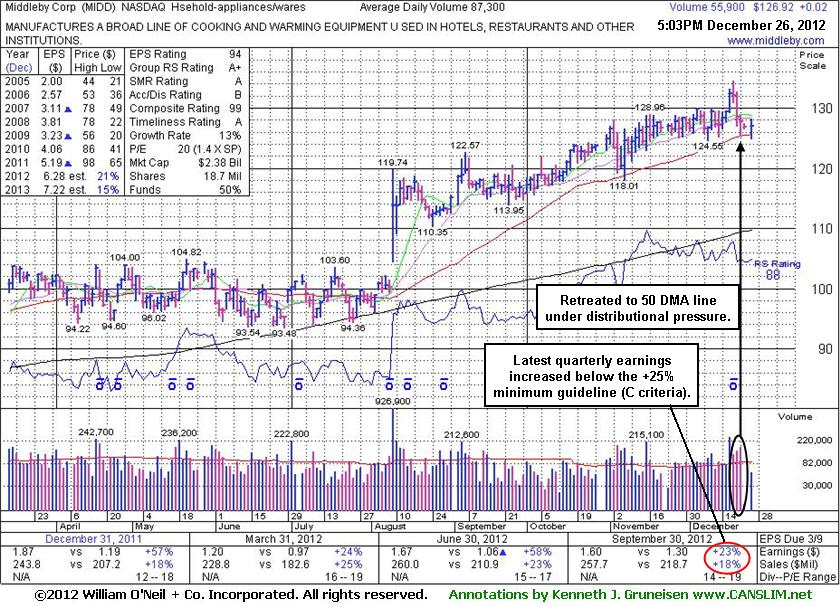
Middleby Corp (MIDD +0.02 or +0.02% to $126.92) halted its slide with a gain on light volume today. That followed 3 consecutive losses with above average volume and increasing volume, enduring distributional pressure after a negative reversal on 12/19/12 at its new 52-week and all-time high. Its last appearance in this FSU section was on 12/06/12 with an annotated graph under the headline, "Wedging Higher But Flaws Give Cause For Concern". That report cautioned members - "Disciplined investors may watch closely for sell signals if holding it and giving it a chance to produce more climactic gains. Its 50-day moving average (DMA) line defines near-term chart support to watch where any violation would trigger a technical sell signal. It reported earnings +23% on +18% sales for the Sep '12 quarter, below the +25% minimum earnings guideline (C criteria), raising fundamental concerns. Prior reports also cautioned that its annual earnings (A criteria) had a downturn in FY '09, yet they have otherwise been good and steady."
The number of top-rated funds owning its shares rose from 351 in Dec '11 to 389 in Sep '12, a reassuring sign concerning the I criteria. Today its current Up/Down Volume Ratio of 1.3 is an unbiased indication its shares have been under accumulation over the past 50 days. Its small supply (S criteria) of only 17.1 million shares can contribute to greater price volatility in the event of institutional buying or selling.
Investors who are disciplined, selective, and patient would likely watch for a fresh breakout in another high-ranked stock without any fundamental flaws, rather than looking for excuses to buy one with flaws.
The number of top-rated funds owning its shares rose from 351 in Dec '11 to 392 in Sep '12, a reassuring sign concerning the I criteria. Today its current Up/Down Volume Ratio of 1.5 is an unbiased indication its shares have been under accumulation over the past 50 days. Its small supply (S criteria) of only 17.1 million shares can contribute to greater price volatility in the event of institutional buying or selling.
Investors who are disciplined, selective, and patient would likely watch for a fresh breakout in another high-ranked stock without any fundamental flaws, rather than looking for excuses to buy one with flaws.
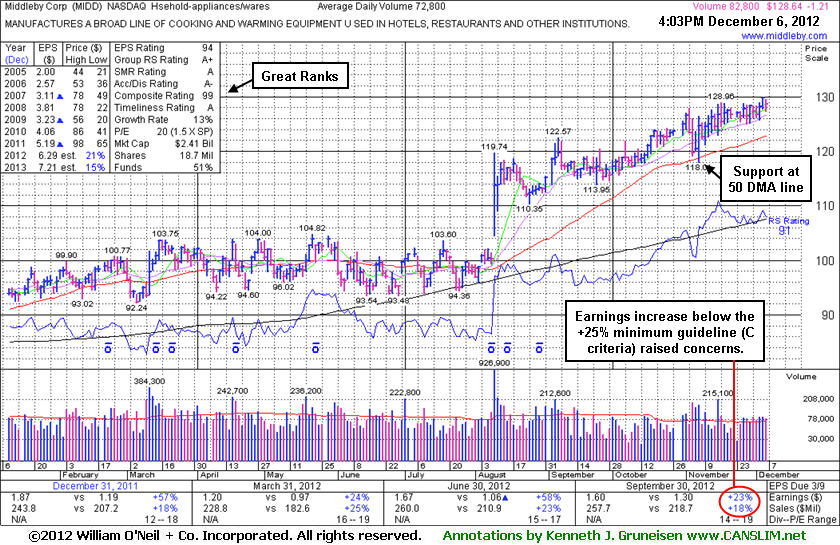
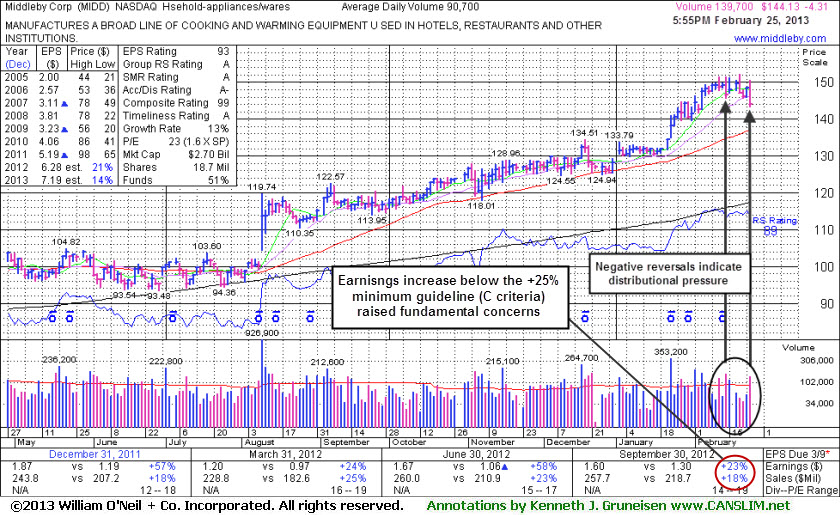
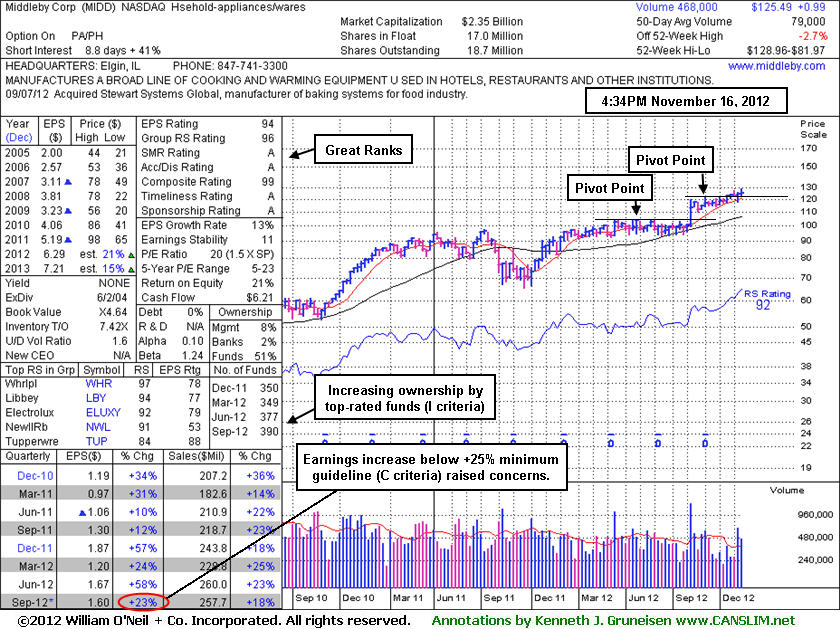
Middleby Corp (MIDD -$1.33 or -1.05% to $125.49) touched a new 52-week high today but reversed into the red at the close. Recently the high-ranked appliance maker reported earnings +23% on +18% sales for the Sep '12 quarter, below the +25% minimum earnings guideline (C criteria). Its last appearance in this FSU section was on 10/22/12 with an annotated graph under the headline, "Awaiting Technical Breakout Following New Base". Volume totals have been above average in recent weeks while it has made limited progress above its latest pivot point. When consolidating it stubbornly held its ground near its 50-day moving average (DMA) line.defining near-term chart support to watch.
Disciplined investors may watch closely for sell signals if holding it and giving it a chance to produce more climactic gains. The M criteria also remains an overriding concern that argues in favor of investors reducing exposure. Selective investors may sooner consider a fresh buy candidate without fundamental flaws once the M criteria improves with a follow -through day (FTD) confirming a new rally.
Prior quarterly comparisons showed stronger sales and earnings reasonably meeting the C criteria. Its annual earnings (A criteria) had a downturn in FY '09, yet they have otherwise been good and steady. The weekly graph below shows that the number of top-rated funds owning its shares rose from 350 in Dec '11 to 390 in Sep '12, a reassuring sign concerning the I criteria. Its current Up/Down Volume Ratio of 1.6 is an unbiased indication its shares have been under accumulation over the past 50 days. Its small supply (S criteria) of only 17.0 million shares can contribute to greater price volatility in the event of institutional buying or selling.
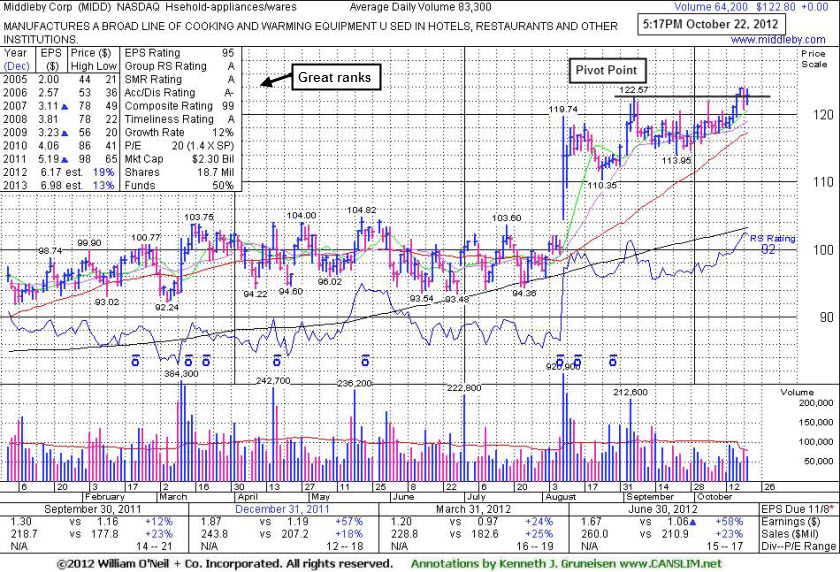
Its last appearance in this FSU section was on 9/18/12 with an annotated graph under the headline, "Appliance Maker Extended From Prior Base", when it was explained - "Patient investors may watch for secondary buy points of new bases to eventually be formed and noted, but disciplined investors do not chase stocks that are too extended from a sound base pattern." After it spent more time basing, on 10/08/12 its color code was changed to yellow with new pivot point cited based on its 9/06/12 high plus 10 cents. Since then, however, it has not triggered a new technical buy signal. Disciplined investors will watch for fresh signs of institutional buying demand before taking action.
It reported earnings +58% on +23% sales revenues for the Jun '12 quarter. Recent quarterly comparisons show strong sales and earnings reasonably meeting the C criteria. Its annual earnings (A criteria) had a downturn in FY '09, yet they have otherwise been good and steady.
The number of top-rated funds owning its shares rose from 340 in Sep '11 to 383 in Sep '12, a reassuring sign concerning the I criteria. Its current Up/Down Volume Ratio of 1.6 is an unbiased indication its shares have been under accumulation over the past 50 days. Its small supply (S criteria) of only 17.0 million shares can contribute to greater price volatility in the event of institutional buying or selling.
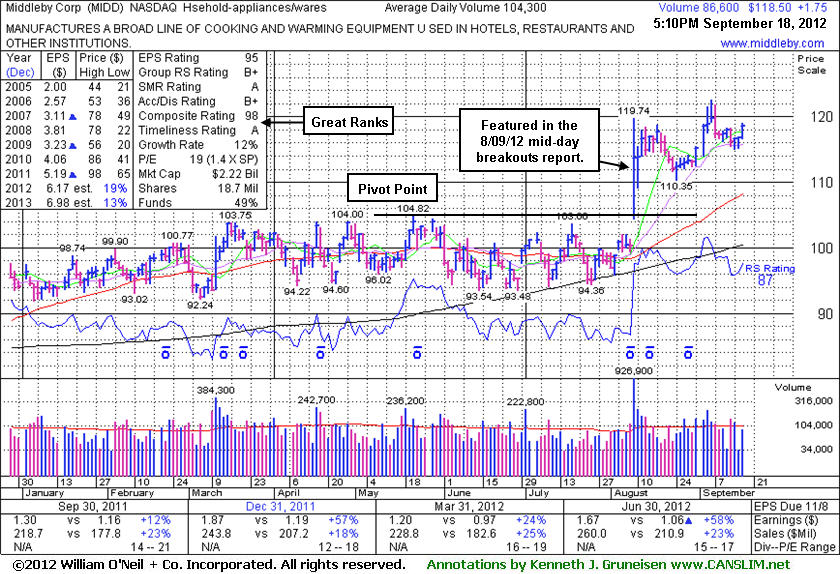
It was highlighted in yellow in the 8/09/12 mid-day report as it gapped up and broke out from a long flat base, and it finished the session with a considerable gain 9 times average volume. A "breakaway gap" was noted as the one exception where buying at more than +5% above prior highs is permitted under the fact-based system, however risk increases the further one chases a stock above its pivot point. It reported earnings +58% on +23% sales revenues for the Jun '12 quarter. Recent quarterly comparisons show strong sales and earnings reasonably meeting the C criteria. Its annual earnings (A criteria) had a downturn in FY '09, yet they have otherwise been good and steady.
The number of top-rated funds owning its shares rose from 340 in Sep '11 to 375 in Jun '12, a reassuring sign concerning the I criteria. Its current Up/Down Volume Ratio of 1.9 is an unbiased indication its shares have been under accumulation over the past 50 days. Its small supply (S criteria) of only 17.0 million shares can contribute to greater price volatility in the event of institutional buying or selling.
Often, when a leading stock is setting up to breakout of a solid base it is highlighted in CANSLIM.net's Mid-Day Breakouts Report. The most relevant factors are noted in the report which alerts prudent CANSLIM oriented investors to place the issue in their watch list. After doing any necessary backup research, the investor is prepared to act after the stock triggers a technical buy signal (breaks above its pivot point on more than +50% average turnover) but before it gets too extended from a sound base. In the event the stock fails to trigger a technical buy signal and its price declines then it will simply be removed from the watch list. Disciplined investors know to buy as near as possible to the pivot point and avoid chasing stocks after they have rallied more than +5% above their pivot point. It is crucial to always limit losses whenever any stock heads the wrong direction, and disciplined investors sell if a struggling stock ever falls more than -7% from their purchase price.
Middleby Corp (MIDD +$2.83 or +2.48% to $116.64) got more extended with today's 3rd consecutive volume-driven gain into new high territory, and its color code was changed to green. It was highlighted in yellow in the 8/09/12 mid-day report as it gapped up and broke out from a long flat base, and it finished the session with a considerable gain 9 times average volume. A "breakaway gap" has been noted as the one exception where buying at more than +5% above prior highs is permitted under the fact-based system, however risk increases the further one chases a stock above its pivot point.
It reported earnings +58% on +23% sales revenues for the Jun '12 quarter. Recent quarterly comparisons show strong sales and earnings reasonably meeting the C criteria. Its annual earnings (A criteria) had a downturn in FY '09, yet they have otherwise been good and steady.
The number of top-rated funds owning its shares rose from 341 in Sep '11 to 377 in Jun '12, a reassuring sign concerning the I criteria. Its current Up/Down Volume Ratio of 1.4 is an unbiased indication its shares have been under accumulation over the past 50 days. Its small supply (S criteria) of only 17.0 million shares can contribute to greater price volatility in the event of institutional buying or selling.
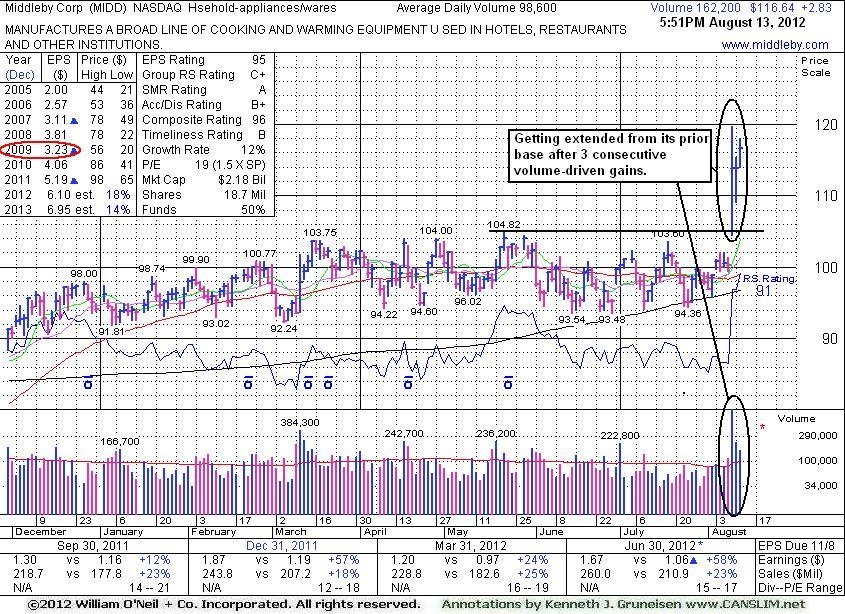
It is not uncommon for leading stocks to pull back after breaking out. Ideally, volume is lighter when the stock retraces back toward a chart support area such as prior chart highs, an upward trend line, or a key moving average such as the 50-day moving average or 200-day moving average. Violations of those technical support levels are a concern, and they are a much greater concern when they occur on higher than average volume. It is especially worrisome when the volume on the down day exceeds the above average volume which had accompanied the prior gains.
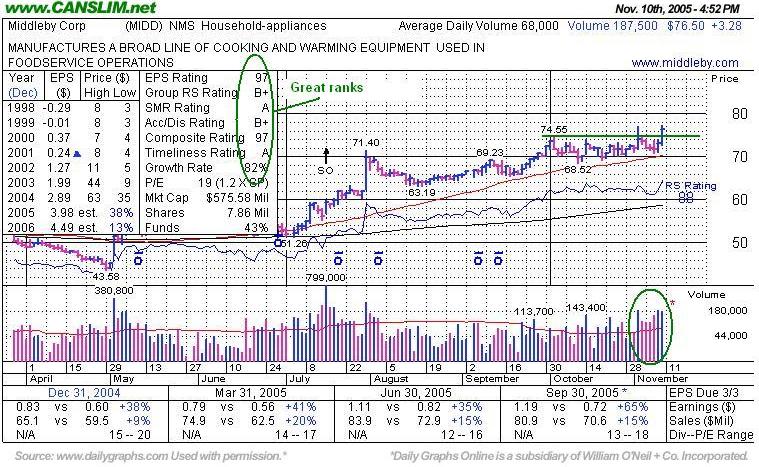
It was encouraging to see Middleby Corp. (MIDD +$3.86 or +4.20% to $88.10) find support, earlier this week, at its 50-DMA. MIDD was recently featured on November 02, 2005 in the CANSLIM.net's Mid-Day Breakouts Report (read here) as it was emerging from a short flat base at $75.85. Since this issue was featured it has advanced nearly 17%. After an impressive rally, prudent investors know, a pullback is inevitable. It was impressive to see Middleby Corp find support when it recently pulled back, precisely at its 50 DMA. The bulls remain in control until support is violated.
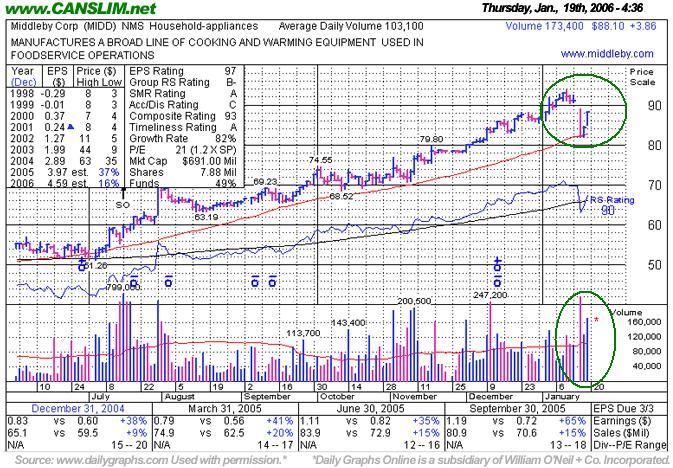
In order for disciplined investors to adhere to the proper guidelines for new buys, as always, it is imperative to avoid "chasing" stocks that move past the pivot point by more than +5%, thus exceeding the "maximum buy price". Buying extended stocks increases the chances investors may be prompted to sell for a 7-8% loss.
Middleby Corp. (MIDD +$2.47 or +3.05% to $78.47) blasted higher today on about average volume, triggering another fresh technical buy signal. Regular readers of CANSLIM.net's Mid-Day BreakOuts Report would have been able to take advantage of this breakout in the middle of the trading session, if not earlier. The company was recently re-featured in yellow at $75.85 with an annotated DailyGraph ® in the November 2nd issue of the CANSLIM.net Mid-Day BreakOuts Report (read here). Today's note (Thursday, November 17th, 2005) in the CANSLIM.net Mid-Day BreakOuts Report (read here) was "Above average volume advance today triggering a technical buy signal. Was first featured on 10/24/03 at +$21.75. Now being re-featured as it has built a new base to buy from."
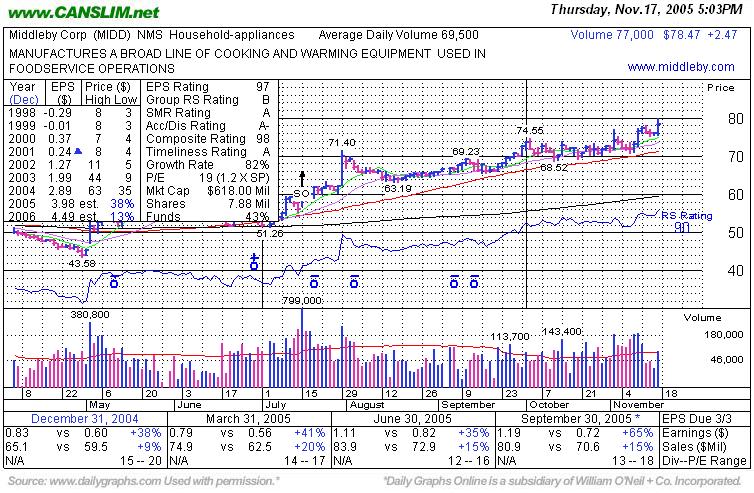
This issue was first featured at CANSLIM.net way back on 10/24/03 at $21.75. Recently, on 11/2/2005 it was re-featured in the CANSLIM.net Mid-Day BreakOuts Report as it was attempting to break out of a tight trading range (read here). However, it promptly reversed, and four consecutive down days on above average volume followed. No technical damage occurred, as during that consolidation the stock stayed well above its 50 DMA. Middleby Corp. (MIDD +$3.28 or +4.11% to $76.50) blasted above its pivot point of $74.65 with nearly three times its average daily volume, triggering a new technical buy signal today. The strong finish suggests that the upward momentum may continue, and it is still within reasonable range of its latest base to be considered a proper buy candidate.
Our main concern would be that its sales revenue growth has been lower than the +25% guideline. However, its ROE is reported at a massive 83%, far beyond the +17% guideline. This may look like an "expensive" stock, but investors should realize that its share prices could still move very rapidly with only 4.8 million shares circulating in the public float. If the shares were split 3/1 and it was priced at $25.50 with a 14.4 million share float, would you feel differently about this candidate? The point is that investors should not rule out stocks because the shares' price tag looks too expensive, especially when provided that all other factors are positive.