Fundamental News Leads To Big Technical Sell-Off - Thursday, February 26, 2009
Mantech International A (MANT -$5.06 or -10.84% to $51.74) suffered a considerable loss today, falling on very heavy volume after reporting earnings for the quarter ended December 31, 2008 that were up only +13%. That was under the +25% guideline of the investment system, and clearly a disappointment following at least 4 prior quarters with solid increases above that minimum. The fundamental weakness prompted quick technical violations of its 50-day and 200-day moving average lines along with a breach of its January low ($53.41).
Any recent stock buying efforts may be categorized as "undisciplined" and dangerous, and those investors who lack discipline might ignore today's technical sell signals at their portfolio's peril. MANT was first featured on Tuesday, April 01, 2008 in the CANSLIM.net Mid Day Breakouts Report (read here).
C A N S L I M | StockTalk | News | Chart | SEC | Zacks Reports | ![]()
![]()
![]()
View all notes | Alert me of new notes | CANSLIM.net Company Profile
New Pivot Point Noted, But Patience Is Required - Thursday, February 12, 2009
Mantech International A (MANT +$0.25 to $57.66) is quietly consolidating above its 50 & 200 DMA lines within close striking distance of all-time highs. Its color code was changed to yellow with new pivot point and max buy levels noted. It has held up well in a tough market environment since gapping down on 1/27/08 with a considerable loss on 3 times average volume following an analyst downgrade. It was featured again in the January 2009 CANSLIM.net News (read here), returning it to the CANSLIM.net Featured Stocks list after having rebounded nicely from its lows below its 50 & 200 DMA lines. This stock was first featured on Tuesday, April 01, 2008 in the CANSLIM.net Mid Day Breakouts Report (read here).C A N S L I M | StockTalk | News | Chart | SEC | Zacks Reports | ![]()
![]()
![]()
View all notes | Alert me of new notes | CANSLIM.net Company Profile
Consolidation and 50 &200 DMA Lines Key After Reversal Near Prior Chart Highs - Wednesday, February 04, 2009
One of the advanced technical chart patterns investors should be familiar with is called an "island reversal" pattern. An island reversal can be either a bearish or bullish pattern depending on the circumstances. A bullish island reversal might occur when a stock first gaps down, but then subsequently gaps back up again several days or weeks later - leaving an "island" of trading activity away from an otherwise continuous stretch of trading in a mostly orderly price range where the intra-day action is overlapping. Today's example below is only a one-day island, which may not be as meaningful of an indicator, yet the bearish reversal raised a caution flag for investors right as the stock hit resistance near prior chart highs.
Mantech International A (MANT +$0.66 or +1.20% to $55.78) rose today on light volume while consolidating above its 50-day and 200-day moving average (DMA) lines - important technical support levels. To register a technical breakout now requires a fresh rally above its 1/26/09 chart high of $60.62 with solid volume conviction. It gapped down on 1/27/08 and suffered a considerable loss with 3 times average volume following an analyst downgrade. That amounts to an "island reversal" after the prior session's gap up gain had helped it rally beyond its max buy level. MANT was featured again in the January 2009 CANSLIM.net News (read here), returning it to the CANSLIM.net Featured Stocks list after having rebounded nicely from its lows below its 50 & 200 DMA lines. This stock was first featured on Tuesday, April 1, 2008 in the CANSLIM.net Mid Day Breakouts Report (read here).
C A N S L I M | StockTalk | News | Chart | SEC | Zacks Reports | ![]()
![]()
![]()
View all notes | Alert me of new notes | CANSLIM.net Company Profile
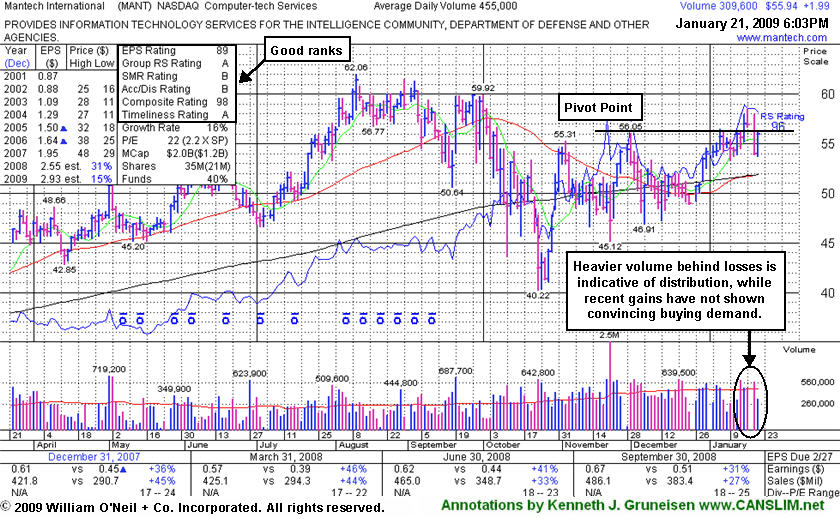
Volume Has Yet To Signal A Convincing New Breakout - Wednesday, January 21, 2009
Volume is a vital component of technical analysis. Prudent investors that incorporate volume into their stock analysis have often benefited several fold. Ideally, healthy stocks will more often tend to rise on higher volume and pullback on lighter volume. Volume is a great proxy for institutional sponsorship (the I criteria). Conversely, high volume declines can be ominous, as this usually signals distribution and further price deterioration are more likely to follow.
Mantech International A (MANT +$1.99 or +3.69% to $55.94) ended the session up today on light volume. It closed the session slightly under its previously cited pivot point. It had rallied above that pivot point on 1/15/09 with only average volume, not the +50% above average volume or greater conviction required for a proper technical buy signal. Disciplined investors will watch for better market conditions (the M criteria) and a confirmed breakout on volume before taking action.
MANT was featured again in the January 2009 CANSLIM.net News (read here), returning it to the CANSLIM.net Featured Stocks list after having rebounded nicely from its lows below its 50 & 200 DMA lines. MANT hails from the Computer - Tech Services group which was ranked 70th on the 197 Industry Groups list at the start of the month, yet the group has risen to now rank 29th on the list - putting it solidly in the much preferred top quartile of groups. There are strong leaders in the group including N C I Inc (NCIT), which is currently on the CANSLIM.net Featured Stocks list, also helping satisfy the L criteria. Its sales and earnings in recent quarterly comparisons show strong increases above the +25%, and its annual growth has been steady. The company's Return On Equity is reported at at +13%, under the +17% guideline, giving cause for some concern. The number of top-rated funds owning its shares increased from 109 in Dec '07 to 128 in Sep '08, which is reassuring concerning the I criteria. It was first featured on Tuesday, April 01, 2008 in the CANSLIM.net Mid Day Breakouts Report (read here).
C A N S L I M | StockTalk | News | Chart | SEC | Zacks Reports | ![]()
![]()
![]()
View all notes | Alert me of new notes | CANSLIM.net Company Profile
Tech Firm Perched Near Pivot Point - Sunday, January 04, 2009
|
Mantech International |
||
|
Ticker Symbol: MANT (NASDAQ) |
Industry Group: Business Software & Services |
Shares Outstanding: 35,000,000 |
|
Price: $54.19 (1/02/2009 close) |
Day's Volume: 272,700 (1/02/09 close) |
Shares in Float: 21,000,000 |
|
52 Week High: $62.06 |
50-Day Average Volume: 448,200 |
Up/Down Volume Ratio: 0.8 |
|
Pivot Point: $56.15 (12/01/08 high plus .10) |
Pivot Point +5% = Max Buy Price: $58.96 |
Web Address: http://www.mantech.com/ |
C A N S L I M | StockTalk | News | Chart | SEC | Zacks Reports | ![]()
![]()
![]()
View all notes | Alert me of new notes | CANSLIM.net Company Profile
CANSLIM.net Company Profile: Mantech International A (MANT $54.19) is a high-ranked provider of technologies and solutions for national security programs in the United States and internationally. It offers information technology solutions comprising secure information sharing and collaboration, enterprise systems engineering, information operations, and Web-enabled mission software applications for customers information systems and network infrastructures. It was founded in 1968 and is headquartered in Fairfax, Virginia. It hails from the Computer - Tech Services group which is currently ranked 70th on the 197 Industry Groups list, however there are strong leaders in the group including N C I Inc (NCIT), which is currently on the CANSLIM.net Featured Stocks list, helping satisfy the L criteria. Its sales and earnings in recent quarterly comparisons show strong increases above the +25%, and its annual growth has been steady. The company's Return On Equity is reported at at +13%, under the +17% guideline, giving cause for some concern. The number of top-rated funds owning its shares increased from 109 in Dec '07 to 128 in Sep '08, which is reassuring concerning the I criteria.
What to Look For and What to Look Out For: Look for the stock to trigger a new technical buy signal by breaking out in the coming days and weeks. Remember that buyable breakouts must clear their pivot point with convincing gains backed by at least +50% above average volume during a confirmed rally. That said, much of its success will depend on the broader market's (the M criteria) ability to maintain its current rally, otherwise 3 out of 4 stocks are likely to struggle. Its small supply (the S criteria) of 35 million shares outstanding could contribute to greater volatility in the event of institutional positioning (accumulation/distribution). Any deterioration under its 200 DMA or is 50 DMA lines would hurt its outlook and raise concerns. A gain with heavy volume leading to a close above its pivot point would be a hard-to-ignore sign of strength.
Technical Analysis: The stock has been consolidating in an orderly fashion and produced a streak of gains on average volume in the past week to rise above its 50 & 200 DMA lines, approaching its pivot point. It faces a bit of additional resistance due to overhead supply up through the $60 area. A considerable loss with above average volume on 10/23/2008 and weak action including a gap down on 10/22/08, violating its 200 DMA line, prompted this previously featured stock to be dropped from the Featured Stocks list. A convincing and proper technical buy signal has yet to be triggered since. Disciplined investors would wait for a solid buy signal.
More Technical Weakness Indicated By Recent Gap Down - Thursday, October 23, 2008
Mantech Int'l (MANT -$4.56 or -12.04% to $42.44) fell on higher volume today after gapping down under its 200-DMA line on 10/22/08. Gaps down indicate more serious institutional selling pressure. It will be dropped from the Featured Stocks list tonight. Distributional action has brought on more damage since it was last summarized in detail in this section on Friday, October 10, 2008 under the headline "200-Day Moving Average - Important Long-Term Support Level". This stock was first featured on Tuesday, April 01, 2008 in the CANSLIM.net Mid Day Breakouts Report (read here).
C A N S L I M | StockTalk | News | Chart | SEC | Zacks Reports | ![]()
![]()
![]()

View all notes | Alert me of new notes | CANSLIM.net Company Profile
200-Day Moving Average - Important Long-Term Support Level - Friday, October 10, 2008
A very important technical tool that savvy investors have learned to incorporate in their technical analysis is the 200-day moving average (DMA) line. The 200 DMA line plays a pivotal role relative to a stock's price. If the price of a stock is above its 200 DMA then odds are that its 200 DMA will act as longer term support. Conversely, if the price is below its 200 DMA then the moving average acts as resistance. Obviously, if a technical breakdown or violation takes place on heavy volume it is a more serious concern. Sometimes quiet violations are repaired quickly, without a lot of additional losses. However, the key moving averages are always an important line to watch.
Mantech International (MANT -$0.34 or -0.70% to $48.73) gapped down today, and after a steep early loss, it almost rebounded for a positive reversal. It finished the session just shy of a gain or rising back above its 200 DMA line; however its close in the upper third of its intra-day trading range was an encouraging sign that it was finding support near that long-term average. The last time it had traded below its 200 DMA line was August 10, 2007. Its prior appearance in this Featured Stock Update section was on Wednesday, August 27, 2008 under the headline "Group Strength Contributes to Stock's Success". This stock was first featured on Tuesday, April 01, 2008 in the CANSLIM.net Mid Day Breakouts Report (read here).
C A N S L I M | StockTalk | News | Chart | SEC | Zacks Reports | ![]()
![]()
![]()
View all notes | Alert me of new notes | CANSLIM.net Company Profile
Group Strength Contributes to Stock's Success - Wednesday, August 27, 2008
Group action plays a very important role, and experienced investors learn that they can increase their odds of picking a great winner by always focusing their buying efforts in the market's leading groups. The "L" criteria in tells us to choose leading companies in leading industry groups, thus it is suggested that investors choose from the top quartile of the 197 Industry Groups (listed in the paper most days on page B4).
Mantech Inc. (MANT +$0.32 or +0.55% to $59.03) has been consolidating in a tight trading range for the past couple of weeks just above its max buy level. This high-ranked leader hails from the Computer - Tech Services group which is presently ranked in the top quartile of the 197 Industry Groups, satisfying the L criteria. Its prior chart highs in the $54 area are an initial support level to watch along with its 50 DMA line. It was first featured in yellow at $46.84 in the 4/01/08 CANSLIM.net Mid-Day BreakOuts Report after it gapped up (read
here), with the following note, "Gapped up today, and recently it has been challenging its all-time highs in the $48 area, leaving little resistance remaining due to overhead supply. Sales and earnings in recent quarterly comparisons show stronger increases, and its annual growth has been steady."It is extended from a proper base now, but it should remain on an active watchlist. In the weeks ahead it may build a base-on-base type pattern and eventually produce a new technical buy signal.
C A N S L I M | StockTalk | News | Chart | SEC | Zacks Reports | ![]()
![]()
![]()

View all notes | Alert me of new notes | CANSLIM.net Company Profile
Computer Services Firm Finds Support at 50 DMA and Upward Trendline - Wednesday, June 25, 2008
Healthy stocks that are within close striking distance of new highs are often great buy candidates for investors to keep on their watch lists, especially when the companies match favorably with all of the investment system's criteria. When a stock is more than -10% off its 52-week high, and if it has violated its 50-day moving average (DMA) line, then the outlook only gets worse and worse as it spends a greater period of time trading deeper under that important short-term average line. By the time a stock's 50 DMA line starts sloping downward it should also be acknowledged that the stock has been struggling for a long while, in which case it might be time to reduce exposure and look for places to put that money to work in stronger buy candidates.
Mantech International (MANT +$1.26 or +2.58% to $50.01) ended with a gain on light volume as it bounced from support near its 50 DMA line and upward trendline connecting recent months' chart lows. This stock was first featured on Tuesday, April 01, 2008 in the CANSLIM.net Featured Stocks Page with a $47.58 pivot point and $49.96 max buy level (read here). Since then, the stock quietly advanced while the market slid into a correction. However, MANT remains a high-ranked leader that continues acting well despite the negative action in the major averages. The stock may also have support above its prior chart highs that were previously a stubborn resistance level (near $48-49 area). MANT remains a strong leader in a strong industry group (good L criteria) with very healthy earnings and sales acceleration in recent quarterly comparisons. Any subsequent violation of its 50 DMA and upward trendline would raise concerns and trigger technical sell signals, and deterioration under its prior chart highs would be more worrisome technical action. Meanwhile, if market conditions improve and the major averages produce a follow through day, odds will then favor it clearing recent highs and continuing higher.
C A N S L I M | StockTalk | News | Chart | SEC | Zacks Reports | ![]()
![]()
![]()
View all notes | Alert me of new notes | CANSLIM.net Company Profile
Gap Up Today Leaves Tech Services Firm Just Below Pivot Point - Tuesday, April 01, 2008
Often, when a leading stock is setting up to breakout of a solid base it is highlighted in CANSLIM.net's Mid-Day Breakouts Report. The most relevant factors are noted in the report which allows prudent CANSLIM oriented investors to place the issue in their watch list. After doing any necessary backup research, the investor is prepared to act if and when the stock triggers a technical buy signal (breaks above its pivot point on more than +50% average turnover). In the event the stock fails to trigger a technical buy signal and its price declines then it will simply be removed from the watch list.
Mantech International (MANT +$1.64 or +3.62% to $47.00) gapped higher today and closed with a solid gain on above average volume, closing less than a dollar below its pivot point. MANT has shown accelerating sales revenues and earnings growth in recent quarterly comparisons, and it also has a steady annual earnings growth history. Its Earnings Per Share (EPS) stands at a firm 87 and its Relative Strength (RS) rating is a solid 95. MANT sports very healthy ranks, and faces very little resistance due to overhead supply now. This stock was first featured on Tuesday, April 01, 2008 in the CANSLIM.net Mid Day Breakouts Report (read here) with a $47.58 pivot point and a $49.96 maximum buy point. A technical buy signal would be triggered when the stock trades and closes above its pivot point with gains backed by at least +50% above average volume, preferrably more. Until then, this high ranked leader should remain on an active watch list. Remember that proper discipline requires investors to sell if any stock falls 7-8% from their buy price, as that is the only way to eliminate the chance of even larger losses occurring.
C A N S L I M | StockTalk | News | Chart | SEC | Zacks Reports | ![]()
![]()
![]()
View all notes | Alert me of new notes | CANSLIM.net Company Profile