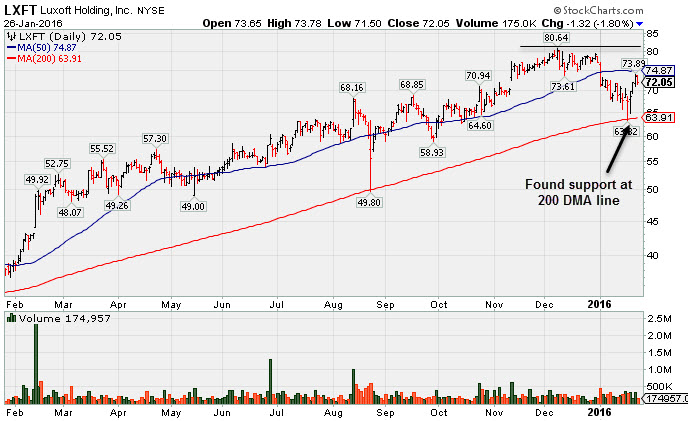
Rebounded Near 50-Day Moving Average Following 200 DMA Test - Tuesday, January 26, 2016
Luxoft Holding Inc Cl A (LXFT -$1.32 or -1.80% to $72.05) is consolidating ove its 50 DMA line ($74.94) is needed for its outlook to improve, and it faces resistance due to overhead supply up through the $80 level. Found support at its 200 DMA line. LXFT was last shown in this FSU section on 12/31/15 with an annotated graph under the headline, "Still Consolidating Above 50-Day Moving Average Line". It was first highlighted in yellow in the 5/26/15 mid-day report (read here).Continuing its strong earning track record, it reported Sep '15 earnings +45% on +29% sales revenues and raised guidance. Earnings +36% on +32% sales revenues for the Jun '15 quarter, so it has a strong quarterly and annual earnings history (C and A criteria) matching the guidelines of the fact-based investment system. Sales revenues growth has been strong while it reported earnings +32%, +23%, +50%, and +28% in the Jun, Sep, Dec '14 and Mar '15 quarters versus the year ago periods.
The number of top-rated funds owning its shares rose from 185 in Jun '14 to 330 in Sep '15, a reassuring sign concerning the I criteria. Its current Up/Down Volume ratio of 1.6 is an unbiased indication its shares have been under accumulation over the past 50 days. It has earned a Timeliness Rating of A and a Sponsorship Rating of D. Its small supply of only 30.6 million shares (S criteria) in the public float can contribute to greater price volatility in the event of institutional buying or selling.
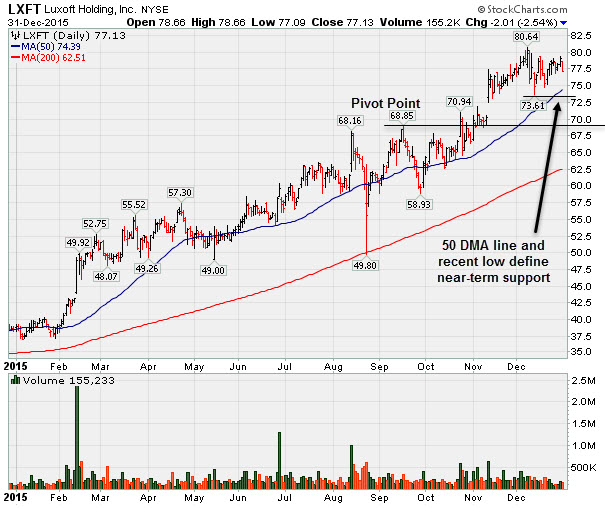
Still Consolidating Above 50-Day Moving Average Line - Thursday, December 31, 2015
Luxoft Holding Inc Cl A (LXFT -$2.01 or -2.54% to $$77.13) volume totals have still been cooling while consolidating near all-time highs. Disciplined investors avoid chasing extended stocks. Its 50 DMA line ($74.39) and prior lows define near-term support to watch on pullbacks. LXFT was last shown in this FSU section on 12/18/15 with an annotated graph under the headline, "Consolidating Well Above 50-Day Moving Average Line". It was first highlighted in yellow in the 5/26/15 mid-day report (read here).
Continuing its strong earning track record, it reported Sep '15 earnings +45% on +29% sales revenues and raised guidance. Earnings +36% on +32% sales revenues for the Jun '15 quarter, so it has a strong quarterly and annual earnings history (C and A criteria) matching the guidelines of the fact-based investment system. Sales revenues growth has been strong while it reported earnings +32%, +23%, +50%, and +28% in the Jun, Sep, Dec '14 and Mar '15 quarters versus the year ago periods.
The number of top-rated funds owning its shares rose from 185 in Jun '14 to 307 in Sep '15, a reassuring sign concerning the I criteria. Its current Up/Down Volume ratio of 1.8 is an unbiased indication its shares have been under accumulation over the past 50 days. It has earned a Timeliness Rating of A and a Sponsorship Rating of C. Its small supply of only 30.6 million shares (S criteria) in the public float can contribute to greater price volatility in the event of institutional buying or selling.
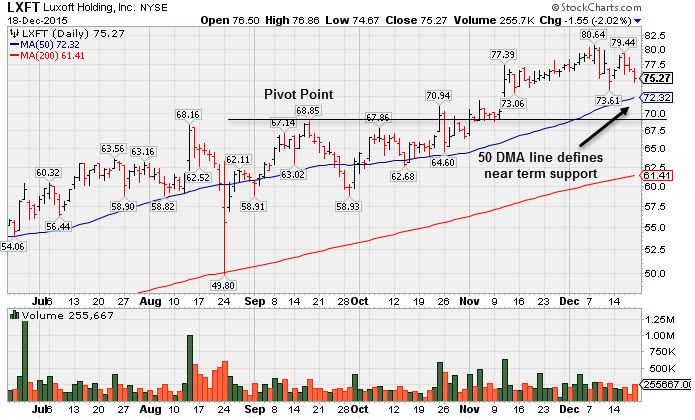
Consolidating Well Above 50-Day Moving Average Line - Friday, December 18, 2015
Luxoft Holding Inc Cl A (LXFT -$1.55 or -2.02% to $75.27) has been consolidating near all-time highs. Disciplined investors avoid chasing extended stocks. Its 50-day moving average (DMA) line ($72.32) defines near-term support to watch on pullbacks. LXFT was last shown in this FSU section on 12/02/15 with an annotated graph under the headline, "Another Gain on Average Volume to a New High Close". It was first highlighted in yellow in the 5/26/15 mid-day report (read here).
Continuing its strong earning track record, it reported Sep '15 earnings +45% on +29% sales revenues and raised guidance. Earnings +36% on +32% sales revenues for the Jun '15 quarter, so it has a strong quarterly and annual earnings history (C and A criteria) matching the guidelines of the fact-based investment system. Sales revenues growth has been strong while it reported earnings +32%, +23%, +50%, and +28% in the Jun, Sep, Dec '14 and Mar '15 quarters versus the year ago periods.
The number of top-rated funds owning its shares rose from 185 in Jun '14 to 303 in Sep '15, a reassuring sign concerning the I criteria. Its current Up/Down Volume ratio of 1.5 is an unbiased indication its shares have been under accumulation over the past 50 days. It has earned a Timeliness Rating of A and a Sponsorship Rating of C. Its small supply of only 30.6 million shares (S criteria) in the public float can contribute to greater price volatility in the event of institutional buying or selling.
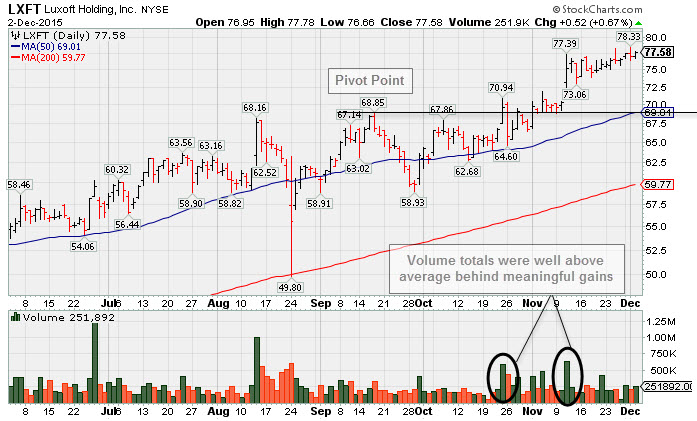
Another Gain on Average Volume to a New High Close - Wednesday, December 2, 2015
Luxoft Holding Inc Cl A (LXFT +$0.52 or +0.67% to $77.58) posted a small gain on average volume for a best-ever close today. Volume totals have generally cooled while stubbornly holding its ground near its all-time high, a sign that very few investors have been heading to the exit. Volume was above average behind meaningful gains in recent months. Disciplined investors avoid chasing extended stocks. LXFT was last shown in this FSU section on 11/11/15 with an annotated graph under the headline, "Gap Up Gain Getting More Extended From Prior Base". It was first highlighted in yellow in the 5/26/15 mid-day report (read here).
Continuing its strong earning track record, it reported Sep '15 earnings +45% on +29% sales revenues and raised guidance. Earnings +36% on +32% sales revenues for the Jun '15 quarter, so it has a strong quarterly and annual earnings history (C and A criteria) matching the guidelines of the fact-based investment system. Sales revenues growth has been strong while it reported earnings +32%, +23%, +50%, and +28% in the Jun, Sep, Dec '14 and Mar '15 quarters versus the year ago periods.
The number of top-rated funds owning its shares rose from 185 in Jun '14 to 300 in Sep '15, a reassuring sign concerning the I criteria. Its current Up/Down Volume ratio of 1.3 is an unbiased indication its shares have been under accumulation over the past 50 days. It has earned a Timeliness Rating of A and a Sponsorship Rating of C. Its small supply of only 30.6 million shares (S criteria) in the public float can contribute to greater price volatility in the event of institutional buying or selling.
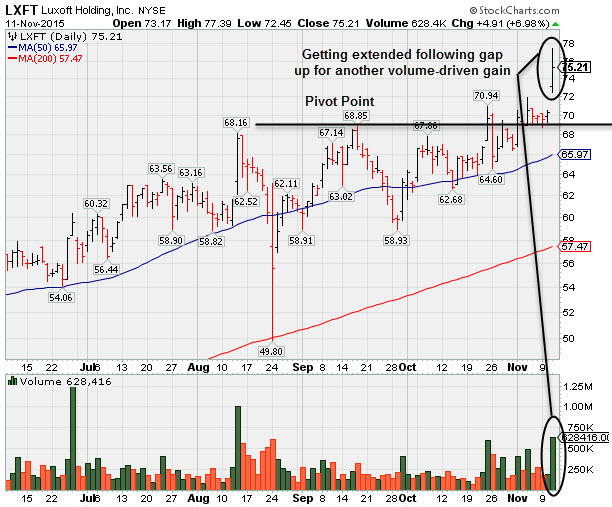
Gap Up Gain Getting More Extended From Prior Base - Wednesday, November 11, 2015
Luxoft Holding Inc Cl A (LXFT +$4.91 or +6.98% to $75.21) posted a solid volume-driven gain today. It is very extended from the prior base after rallying above its "max buy" level, and its color code was changed to green. Disciplined investors avoid chasing extended stocks.
Continuing its strong earning track record, it reported Sep '15 earnings +45% on +29% sales revenues and raised guidance. Earnings +36% on +32% sales revenues for the Jun '15 quarter, so it has a strong quarterly and annual earnings history (C and A criteria) matching the guidelines of the fact-based investment system. Sales revenues growth has been strong while it reported earnings +32%, +23%, +50%, and +28% in the Jun, Sep, Dec '14 and Mar '15 quarters versus the year ago periods.
LXFT found prompt support after was last shown in this FSU section on 10/26/15 with an annotated graph under the headline, "Retreat Into Prior Base Following Latest Breakout". It was first highlighted in yellow with a pivot point cited based on its 4/23/15 high plus 10 cents in the 5/26/15 mid-day report (read here).
The number of top-rated funds owning its shares rose from 185 in Jun '14 to 291 in Sep '15, a reassuring sign concerning the I criteria. It has earned a Timeliness Rating of A and a Sponsorship Rating of C. Its small supply of only 30.6 million shares (S criteria) in the public float can contribute to greater price volatility in the event of institutional buying or selling.
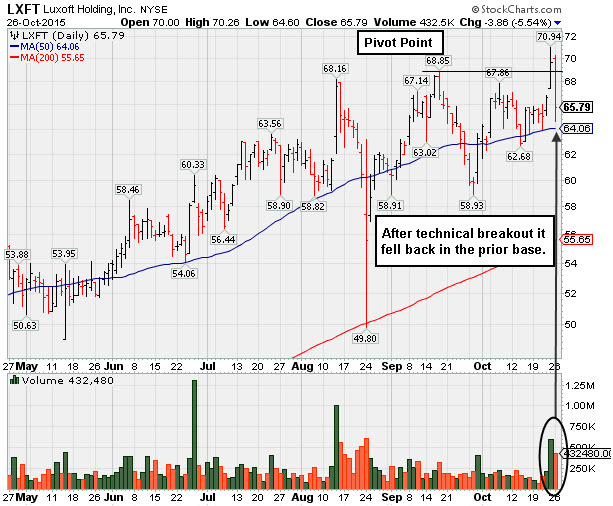
Retreat Into Prior Base Following Latest Breakout - Monday, October 26, 2015
Luxoft Holding Inc Cl A (LXFT -$3.86 or -5.54% to $65.79) slumped back into its prior base as today's abrupt loss with +82% above average volume raised concerns. It had gapped up and hit a new 52-week high triggering a technical buy signal with Friday's big gain on heavier volume +142% above. Disciplined investors always limit losses by selling any stock that falls more than -7% from their purchase price.
The new pivot point cited was based on its 9/17/15 high plus 10 cents. It found support above its 50-day moving average (DMA) line while building a new flat base. LXFT was last shown in this FSU section on 10/13/15 with an annotated graph under the headline, "Consolidating After Rebound Above 50-Day Moving Average". It was first highlighted in yellow with a pivot point cited based on its 4/23/15 high plus 10 cents in the 5/26/15 mid-day report (read here). The high-ranked Computer Software firm is due to report Sep '15 quarterly earnings on November 10th. Earnings +36% on +32% sales revenues for the Jun '15 quarter, so it has a strong quarterly and annual earnings history (C and A criteria) matching the guidelines of the fact-based investment system. Sales revenues growth has been strong while it reported earnings +32%, +23%, +50%, and +28% in the Jun, Sep, Dec '14 and Mar '15 quarters versus the year ago periods.
The number of top-rated funds owning its shares rose from 185 in Jun '14 to 283 in Sep '15, a reassuring sign concerning the I criteria. However, its current Up/Down Volume Ratio of 0.6 is an unbiased indication its shares have been under distributional pressure over the past 50 days. It has earned a Timeliness Rating of A and a Sponsorship Rating of B. Its small supply of only 30.3 million shares (S criteria) in the public float can contribute to greater price volatility in the event of institutional buying or selling.
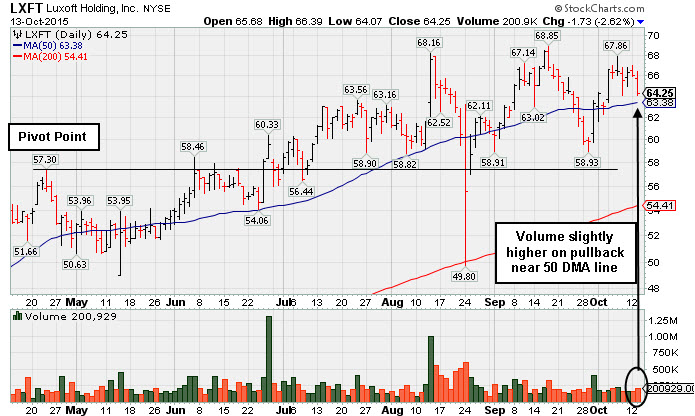
Consolidating After Rebound Above 50-Day Moving Average - Tuesday, October 13, 2015
Luxoft Holding Inc Cl A (LXFT -$1.73 or -2.62% to $64.25) pulled back on slightly higher volume today, slumping near its 50-day moving average (DMA) line ($63.38). It remains perched within close striking distance of prior highs. Little resistance remains due to overhead supply however it has not formed a sound base. It was last shown in this FSU section on 9/30/15 with an annotated graph under the headline, " Volume-Driven Gain and Rebound Above 50-Day Moving Average Line ". Prior reports cautioned members - "Faces little resistances due to overhead supply, however, its deep "V" shaped consolidation is not recognized as a sound base. It found prompt support at its 200-day moving average (DMA) line on 8/24/15 after violating its 50 DMA line."
LXFT was first highlighted in yellow with a pivot point cited based on its 4/23/15 high plus 10 cents in the 5/26/15 mid-day report (read here). The high-ranked Computer Software firm reported earnings +36% on +32% sales revenues for the Jun '15 quarter, continuing its strong quarterly and annual earnings history (C and A criteria) matching the guidelines of the fact-based investment system. Sales revenues growth has been strong while it reported earnings +32%, +23%, +50%, and +28% in the Jun, Sep, Dec '14 and Mar '15 quarters versus the year ago periods.
The number of top-rated funds owning its shares rose from 185 in Jun '14 to 276 in Jun '15, a reassuring sign concerning the I criteria. However, its current Up/Down Volume Ratio of 0.7 is an unbiased indication its shares have been under distributional pressure over the past 50 days. It has earned a Timeliness Rating of A and a Sponsorship Rating of B. Its small supply of only 30.3 million shares (S criteria) in the public float can contribute to greater price volatility in the event of institutional buying or selling.
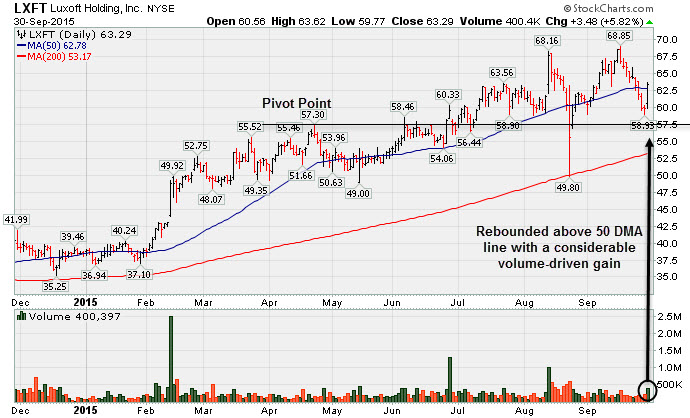
Volume-Driven Gain and Rebound Above 50-Day Moving Average Line - Wednesday, September 30, 2015
Luxoft Holding Inc Cl A (LXFT +$3.48 or +5.82% to $63.29) rebounded above its 50-day moving average (DMA) line today. There was +60% above average volume behind its big gain helping its outlook improve, however, it still has not formed a sound base pattern. It was last shown in this FSU section on 9/15/15 with an annotated graph under the headline, "Quiet Gain For Second Best Close Ever", perched within close striking distance of its 52-week high. It was then noted - "Faces little resistances due to overhead supply, however, its deep "V" shaped consolidation is not recognized as a sound base. It found prompt support at its 200-day moving average (DMA) line on 8/24/15 after violating its 50 DMA line."
LXFT was first highlighted in yellow with a pivot point cited based on its 4/23/15 high plus 10 cents in the 5/26/15 mid-day report (read here). The high-ranked Computer Software firm reported earnings +36% on +32% sales revenues for the Jun '15 quarter, continuing its strong quarterly and annual earnings history (C and A criteria) matching the guidelines of the fact-based investment system. Sales revenues growth has been strong while it reported earnings +32%, +23%, +50%, and +28% in the Jun, Sep, Dec '14 and Mar '15 quarters versus the year ago periods.
The number of top-rated funds owning its shares rose from 185 in Jun '14 to 265 in Jun '15, a reassuring sign concerning the I criteria. It has earned a Timeliness Rating of A. Its small supply of only 30.2 million shares (S criteria) in the public float can contribute to greater price volatility in the event of institutional buying or selling.
Patient investors may watch for a new base of sufficient length to form. Disciplined investors also will be willing to wait and watch the major market averages (M criteria) for more convincing signs that broad strength is returning.
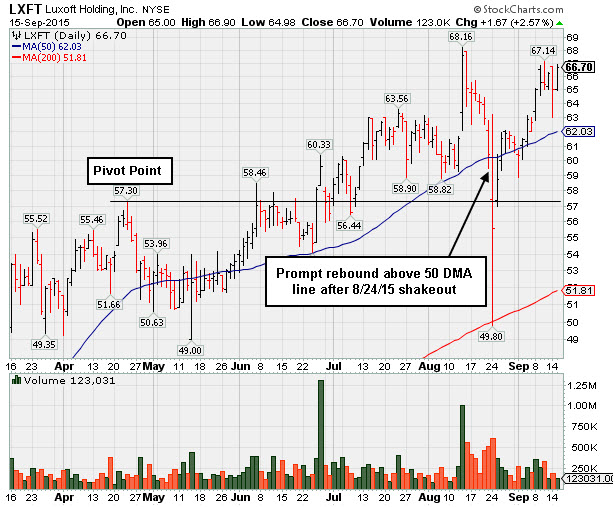
Quiet Gain For Second Best Close Ever - Tuesday, September 15, 2015
Luxoft Holding Inc Cl A (LXFT +$1.67 or +2.57% to $66.70) is consolidating within close striking distance of its 52-week high. It faces little resistances due to overhead supply, however, its deep "V" shaped consolidation is not recognized as a sound base. It found prompt support at its 200-day moving average (DMA) line on 8/24/15 after violating its 50 DMA line.
It was last shown in this FSU section on 9/08/15 with an annotated graph under the headline, " Approaching Highs With Solid Gain on Higher Volume ". It had triggered technical sell signals with damaging volume-driven losses as it sank deep into the prior base on 8/24/15 amid broad-based market weakness (M criteria). The prompt rebound above its 50 DMA line was a sign of institutional support that helped its outlook improve.
LXFT was first highlighted in yellow with a pivot point cited based on its 4/23/15 high plus 10 cents in the 5/26/15 mid-day report (read here). The high-ranked Computer Software firm reported earnings +36% on +32% sales revenues for the Jun '15 quarter, continuing its strong quarterly and annual earnings history (C and A criteria) matching the guidelines of the fact-based investment system. Sales revenues growth has been strong while it reported earnings +32%, +23%, +50%, and +28% in the Jun, Sep, Dec '14 and Mar '15 quarters versus the year ago periods.
The number of top-rated funds owning its shares rose from 185 in Jun '14 to 266 in Jun '15, a reassuring sign concerning the I criteria. It has earned a Timeliness Rating of A. Its small supply of only 30.2 million shares (S criteria) in the public float can contribute to greater price volatility in the event of institutional buying or selling.
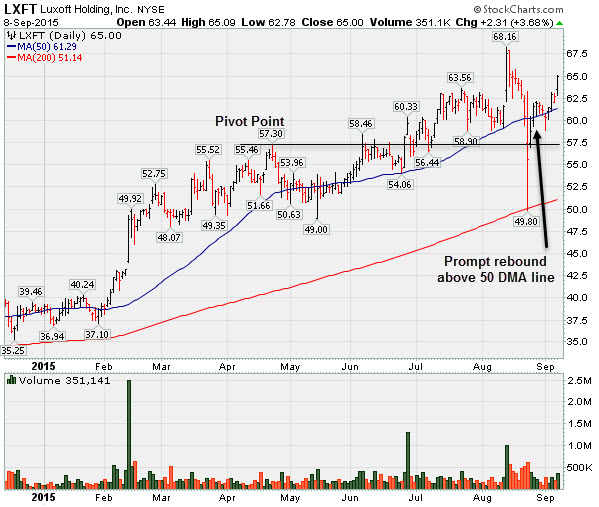
Approaching Highs With Solid Gain on Higher Volume - Tuesday, September 8, 2015
Luxoft Holding Inc Cl A (LXFT +$2.31 or +3.68% to $65.00) posted a solid gain with above average volume. It was last shown in this FSU section on 8/27/15 with an annotated graph under the headline, "After Shakeout a Prompt Rebound Above 50-Day Moving Average". The prompt rebound above its 50-day moving average (DMA) line was a sign of institutional support that helped its outlook improve. It had triggered technical sell signals with damaging volume-driven losses as it sank deep into the prior base on 8/24/15 amid broad-based market weakness (M criteria).
LXFT was first highlighted in yellow with a pivot point cited based on its 4/23/15 high plus 10 cents in the 5/26/15 mid-day report (read here). The high-ranked Computer Software firm reported earnings +36% on +32% sales revenues for the Jun '15 quarter, continuing its strong quarterly and annual earnings history (C and A criteria) matching the guidelines of the fact-based investment system. Sales revenues growth has been strong while it reported earnings +32%, +23%, +50%, and +28% in the Jun, Sep, Dec '14 and Mar '15 quarters versus the year ago periods.
The number of top-rated funds owning its shares rose from 185 in Jun '14 to 266 in Jun '15, a reassuring sign concerning the I criteria. It has earned a Timeliness Rating of A. Its small supply of only 30.2 million shares (S criteria) in the public float can contribute to greater price volatility in the event of institutional buying or selling.
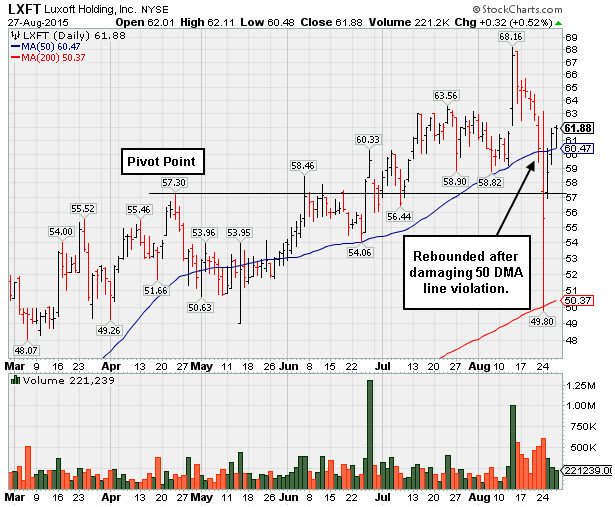
After Shakeout a Prompt Rebound Above 50-Day Moving Average - Thursday, August 27, 2015
Luxoft Holding Inc Cl A (LXFT +$0.32 or +0.52% to $61.88) has promptly rebounded above its 50-day moving average (DMA) line ($60.47) helping its outlook improve. It triggered technical sell signals with damaging volume-driven losses as it sank deep into the prior base on 8/24/15 amid broad-based market weakness (M crieria). While it has found encouraging support, more damaging losses would raise greater concerns.
LXFT blasted to new highs after last shown in this FSU section on 8/10/15 with an annotated graph under the headline, "Earnings News Often Leads to Greater Volume and Volatility". It reported earnings +36% on +32% sales revenues for the Jun '15 quarter, continuing its strong quarterly and annual earnings history (C and A criteria) matching the guidelines of the fact-based investment system. Sales revenues growth has been strong while it reported earnings +32%, +23%, +50%, and +28% in the Jun, Sep, Dec '14 and Mar '15 quarters versus the year ago periods.
It was first highlighted in yellow with a pivot point cited based on its 4/23/15 high plus 10 cents in the 5/26/15 mid-day report (read here). Members were reminded - "Disciplined investors know that subsequent volume-driven gains above the pivot point for new highs (N criteria) are needed to trigger a proper technical buy signal." The confirming gains with heavy volume came later, on June 25th and 26th.
The number of top-rated funds owning its shares rose from 185 in Jun '14 to 265 in Jun '15, a reassuring sign concerning the I criteria. It has earned a Timeliness Rating of B. Its small supply of only 30.2 million shares (S criteria) in the public float can contribute to greater price volatility in the event of institutional buying or selling.
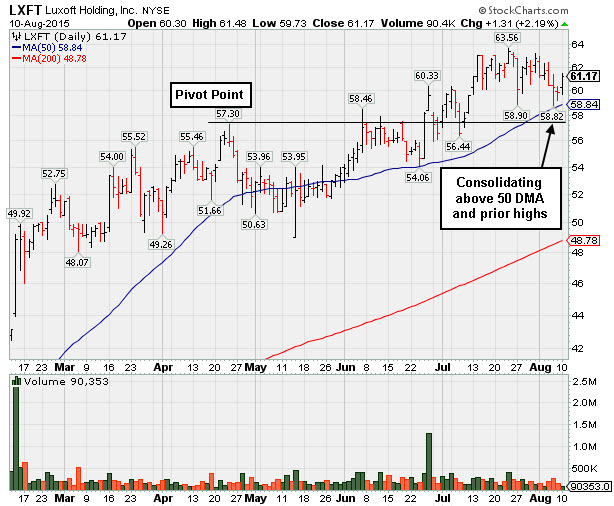
Earnings News Often Leads to Greater Volume and Volatility - Monday, August 10, 2015
Luxoft Holding Inc Cl A (LXFT +$1.31 or +2.19% to $61.17) is consolidating above its 50-day moving average (DMA) line ($58.84) and prior highs in the $57 area. Subsequent violations would trigger technical sell signals. It was last shown in this FSU section on 7/16/15 with an annotated graph under the headline, "Extended From Base After Wedging Higher". It was first highlighted in yellow with a pivot point cited based on its 4/23/15 high plus 10 cents in the 5/26/15 mid-day report (read here). Members were reminded - "Disciplined investors know that subsequent volume-driven gains above the pivot point for new highs (N criteria) are needed to trigger a proper technical buy signal." The confirming gains with heavy volume came later, on June 25th and 26th.
Keep in mind that it is due to report its Jun '15 quarterly earnings on 8/12/15, and volume and volatility often increase near earnings news. Sales revenues growth has been strong while it reported earnings +32%, +23%, +50%, and +28% in the Jun, Sep, Dec '14 and Mar '15 quarters versus the year ago periods. Its strong quarterly and annual earnings history (C and A criteria) matches the guidelines of the fact-based investment system.
The number of top-rated funds owning its shares rose from 185 in Jun '14 to 263 in Jun '15. Its current Up/Down Volume Ratio of 1.8 is an unbiased indication its shares have been under accumulation over the past 50 days, very reassuring signs concerning the I criteria. It has earned a Timeliness Rating of A. Its small supply of only 30.2 million shares (S criteria) in the public float can contribute to greater price volatility in the event of institutional buying or selling.
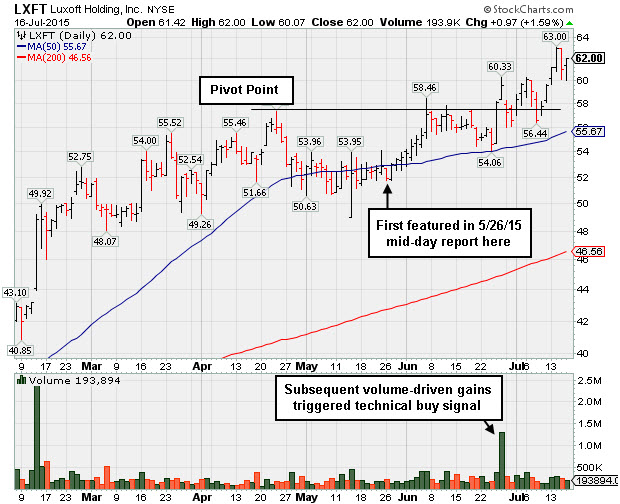
Extended From Base After Wedging Higher - Thursday, July 16, 2015
Luxoft Holding Inc Cl A (LXFT +$0.97 or +1.59% to $62.00) is extended from its prior base after rising above its "max buy" level with recent gains lacking great volume conviction. Technically, the action is termed "wedging". Volume-driven gains which occurred weeks earlier have been followed by pullbacks on lighter and near average volume, so it is not showing signs of distributional pressure. Prior highs in the $57-58 area define near-term support above its 50-day moving average (DMA) line ($55.67), levels where subsequent violations would trigger technical sell signals.
LXFT has shown bullish action since last shown in this FSU section on 6/17/15 with annotated graphs under the headline, "Quietly Consolidating Near Highs With No Overhead Supply". It was first highlighted in yellow with a pivot point cited based on its 4/23/15 high plus 10 cents in the 5/26/15 mid-day report (read here). Members were reminded - "Disciplined investors know that subsequent volume-driven gains above the pivot point for new highs (N criteria) are needed to trigger a proper technical buy signal." The confirming gains with heavy volume came later, on June 25th and 26th.
Sales revenues growth has been strong while it reported earnings +32%, +23%, +50%, and +28% in the Jun, Sep, Dec '14 and Mar '15 quarters versus the year ago periods. Its strong quarterly and annual earnings history (C and A criteria) matches the guidelines of the fact-based investment system. Keep in mind that it is due to report its Jun '15 quarterly earnings on 8/12/15, and volume and volatility often increase near earnings news.
The number of top-rated funds owning its shares rose from 185 in Jun '14 to 257 in Jun '15. Its current Up/Down Volume Ratio of 2.0 is an unbiased indication its shares have been under accumulation over the past 50 days, very reassuring signs concerning the I criteria. It has earned a Timeliness Rating of A. Its small supply of only 30.2 million shares (S criteria) in the public float can contribute to greater price volatility in the event of institutional buying or selling.
Charts courtesy www.stockcharts.com
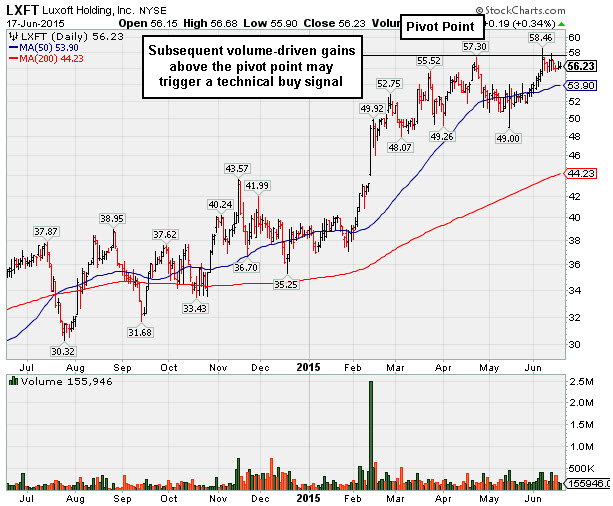
Quietly Consolidating Near Highs With No Overhead Supply - Wednesday, June 17, 2015
Luxoft Holding Inc Cl A (LXFT +$0.19 or +0.34% to $56.23) remains perched within close striking distance of its 52-week high following its latest small gains backed by average volume. LXFT was last shown in this FSU section on 5/26/15 with annotated graphs under the headline, "Gains For News Highs Still Needed to Trigger Technical Buy Signal", after highlighted in yellow with a pivot point cited based on its 4/23/15 high plus 10 cents in the earlier mid-day report (read here). Members were reminded - "Disciplined investors know that subsequent volume-driven gains above the pivot point for new highs (N criteria) are needed to trigger a proper technical buy signal."
Sales revenues growth has been strong while it reported earnings +32%, +23%, +50%, and +28% in the Jun, Sep, Dec '14 and Mar '15 quarters versus the year ago periods. Its strong quarterly and annual earnings history (C and A criteria) matches the guidelines of the fact-based investment system.
The number of top-rated funds owning its shares rose from 185 in Jun '14 to 251 in Mar '15. Its current Up/Down Volume Ratio of 1.4 is an unbiased indication its shares have been under accumulation over the past 50 days, very reassuring signs concerning the I criteria. It has earned a Timeliness Rating of A. Its small supply of only 30.2 million shares (S criteria) in the public float can contribute to greater price volatility in the event of institutional buying or selling.
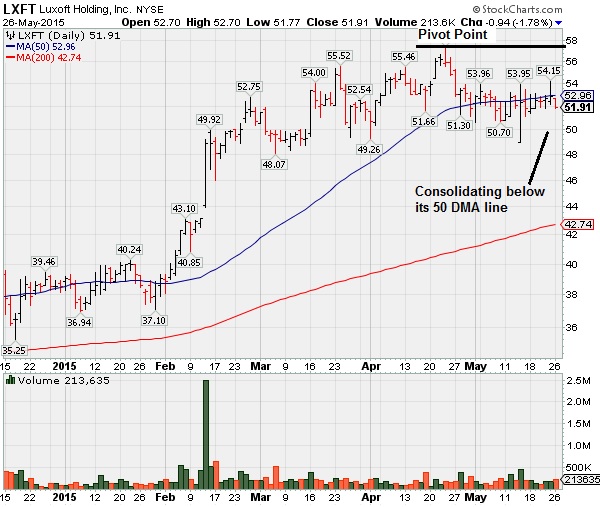
Gains For News Highs Still Needed to Trigger Technical Buy Signal - Tuesday, May 26, 2015
Luxoft Holding Inc Cl A (LXFT -$0.94 or -1.78% to $51.91) finished lower after highlighted in yellow with new pivot point cited based on its 4/23/15 high plus 10 cents in the earlier mid-day report (read here). Disciplined investors know that subsequent volume-driven gains above the pivot point for new highs (N criteria) are needed to trigger a proper technical buy signal. It has made gradual progress following the previously noted "breakaway gap" on 2/12/15.
Sales revenues growth has been strong while it reported earnings +32%, +23%, +50%, and +28% in the Jun, Sep, Dec '14 and Mar '15 quarters versus the year ago periods. Its strong quarterly and annual earnings history (C and A criteria) matches the guidelines of the fact-based investment system.
The number of top-rated funds owning its shares rose from 185 in Jun '14 to 254 in Mar '15, a reassuring sign concerning the I criteria. Its small supply of only 30.2 million shares (S criteria) in the public float can contribute to greater price volatility in the event of institutional buying or selling.