Rebounding After Finding Support at 200-Day Average - Wednesday, March 14, 2018
Logmein Inc (LOGM -$0.35 or -0.27% to $127.15) is perched within -5.7% of its record high. Keep in mind that any stock that was sold can be bought again if strength returns. The recent rebound above the 50-day moving average (DMA) line ($121.88) helped its outlook improve after it found support at its 200 DMA line. However, its Relative Strength rating is 76, still below the 80+ minimum guideline for buy candidates.
LOGM was highlighted in yellow with pivot point cited based on its 10/27/17 high plus 10 cents in the 2/15/18 mid-day report (read here). A strong gain on the prior session triggered a technical buy signal. The Computer Software - Enterprise firm reported Dec '17 earnings +94% on +214% sales revenues versus the year ago period, and prior quarters have been above the +25% minimum guideline (C criteria). Annual earnings (A criteria) history has been strong after a downturn in FY '13).
The number of top-rated funds owning its shares rose from 754 in Jun '17 to 771 in Dec '17, a reassuring sign concerning the I criteria. Its current Up/Down Volume Ratio of 1.3 is an unbiased indication its shares have been under accumulation over the past 50 days. It has earned a Timeliness Rating of A and Sponsorship Rating of B.

Technical Breakout Came Ahead of Earnings News - Thursday, February 15, 2018
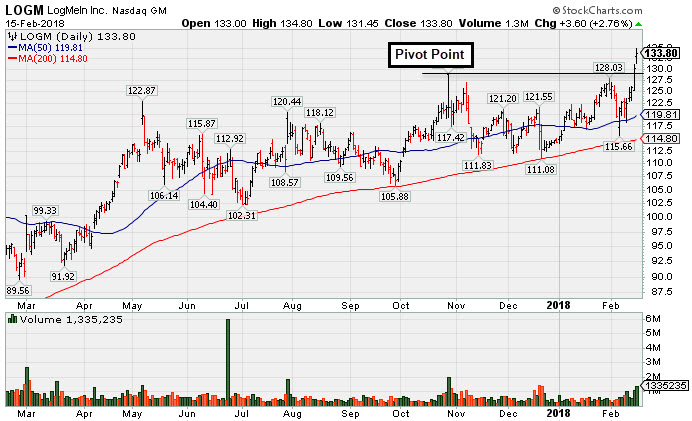
Logmein Inc (LOGM +$3.60 or +2.76% $133.80) was highlighted in yellow with pivot point cited based on its 10/27/17 high plus 10 cents in the earlier mid-day report (read here). Rallying into new all-time high territory after finding support near its 50-day moving average (DMA) line. A strong gain on the prior session triggered a technical buy signal as it rose above the pivot point cited based on its 10/27/17.
After the close it reported Dec '17 earnings +94% on +214% sales revenues versus the year ago period. Volume and volatility often increase near earnings news. Market reactions are based on the combination of the actual news as well as future guidance provided. Reported earnings +107% on +216% sales revenues for the Sep '17 quarter, and prior quarters have been above the +25% minimum guideline (C criteria). Annual earnings (A criteria) history has been strong after a downturn in FY '13).
The number of top-rated funds owning its shares rose from 754 in Jun '17 to 769 in Dec '17, a reassuring sign concerning the I criteria. Its current Up/Down Volume Ratio of 1.6 is an unbiased indication its shares have been under accumulation over the past 50 days. It has earned a Timeliness Rating of A and Sponsorship Rating of C.