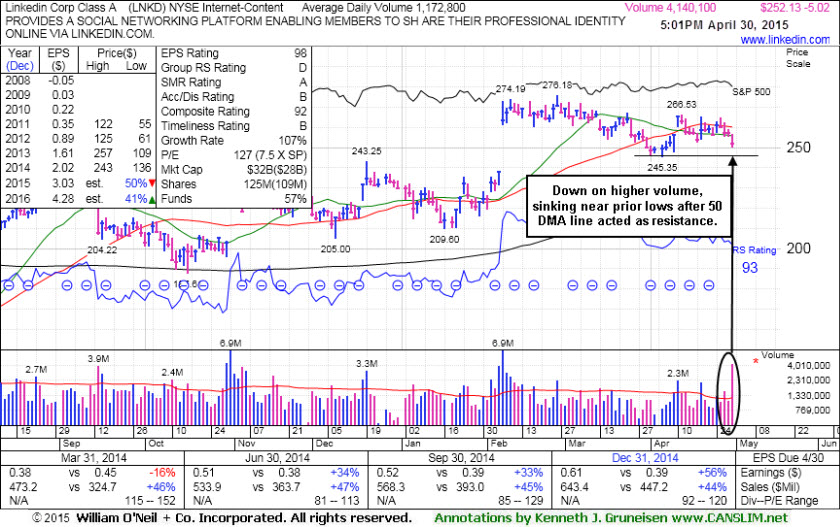
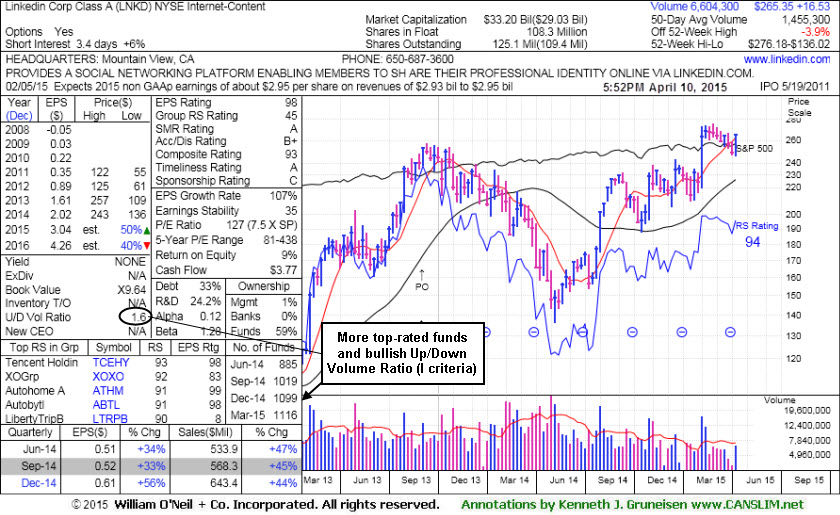
Linkedin Corp (LNKD -$5.02 or -1.95% to $252.13) sank further below its 50-day moving average (DMA) line and ended weak today, suffering a damaging loss on heavy volume indicative of distributional pressure. A convincing rebound above that important short-term average is needed to help its outlook to improve. After the close, it reported Mar '15 earnings and gave disappointing forward-looking guidance. In after-hours trading shares changed hands at prices well below prior lows in the $245 area which would define the next important support level, triggering worrisome technical sell signals. It will be dropped from the Featured Stocks list tonight.
LNKD was last shown in this FSU section on 4/10/15 with annotated graphs under the headline, "Rebound Above 50-Day Moving Average Helped Technical Stance". Subsequent losses soon led to a slump below the 50 DMA line, and afterward that short-term average acted as resistance. It really made no meaningful progress since the considerable "breakaway gap" noted in the 2/06/15 mid-day report (read here).
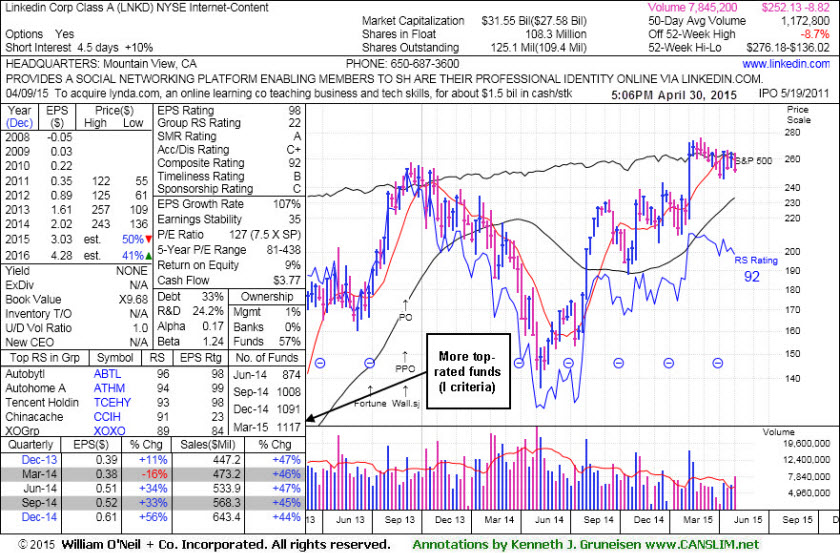
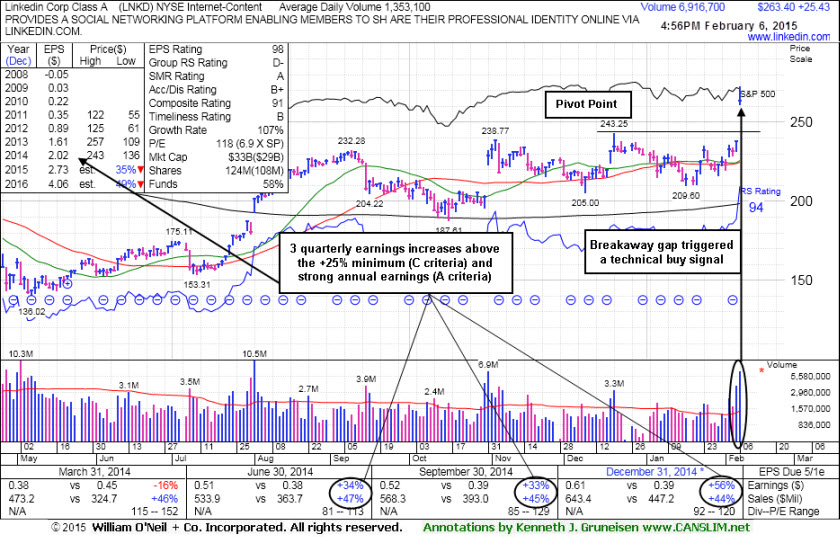
It reported earnings +56% on +44% sales revenues for the Dec '14 quarter. That marked its 3rd consecutive quarter with earnings above the +25% minimum guideline (C criteria), following sub par Dec '13 and Mar '14 earnings results. It has maintained a strong annual earnings (A criteria) history. The high-ranked leader from the Internet - Content group's Return On Equity of 9% is still below the 17% guideline, which is a minor concern. Ownership by top-rated funds has been on the rise from 874 in Jun '14 to 1,117 in Mar '15, an encouraging sign concerning the I criteria.
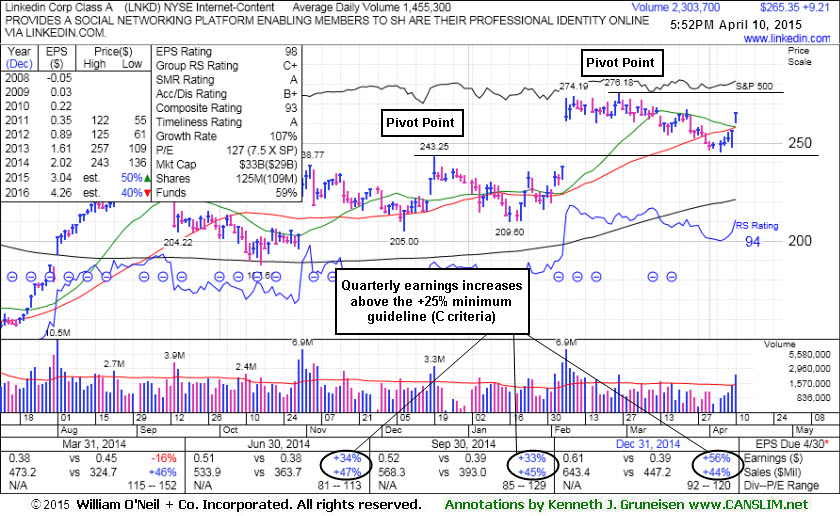
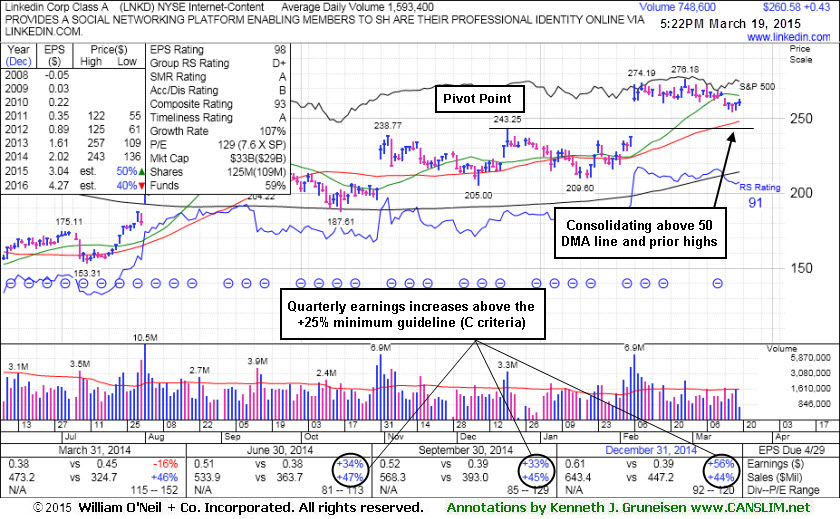
Linkedin Corp (LNKD +$9.21 or +3.60% to $265.35) gapped up today, rebounding above its 50-day moving average (DMA) line, helping its technical stance improve. It found support while consolidating above prior highs in the $243 area. Its color code was changed to yellow with new pivot point cited based on its 2/26/15 high plus 10 cents. Subsequent volume-driven gains for new highs may trigger a new (or add-on) technical buy signal.
LNKD was last shown in this FSU section on 3/19/15 with annotated graphs under the headline, "Stalled Following 'Breakaway Gap' 6 Weeks Ago ". It has made no progress since the considerable "breakaway gap" noted in the 2/06/15 mid-day report (read here).
It reported earnings +56% on +44% sales revenues for the Dec '14 quarter. That marked its 3rd consecutive quarter with earnings above the +25% minimum guideline (C criteria), following sub par Dec '13 and Mar '14 earnings results. It has maintained a strong annual earnings (A criteria) history.
The high-ranked leader from the Internet - Content group's Return On Equity of 9% is still below the 17% guideline, which is a minor concern. Its Up/Down Volume Ratio of 1.6 is an unbiased indication its shares have been under accumulation over the past 50 days. Ownership by top-rated funds has been on the rise from 885 in Jun '14 to 1,116 in Mar '15, an encouraging sign concerning the I criteria.
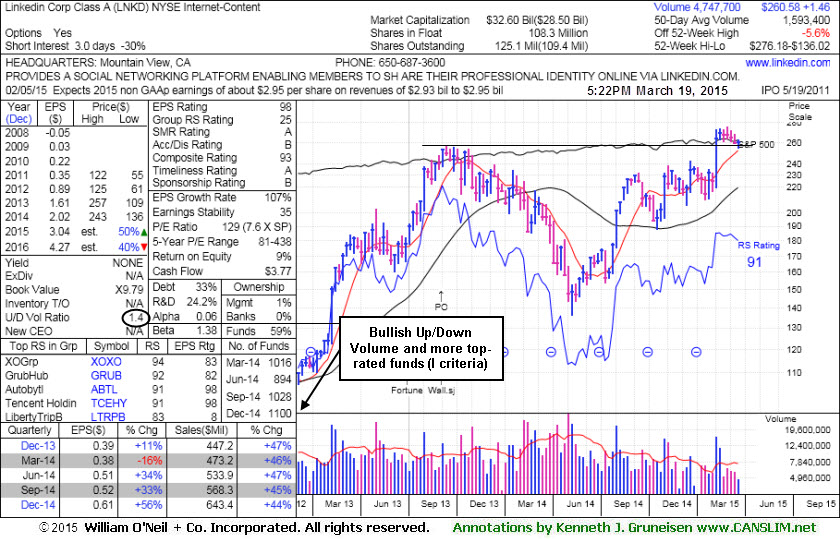
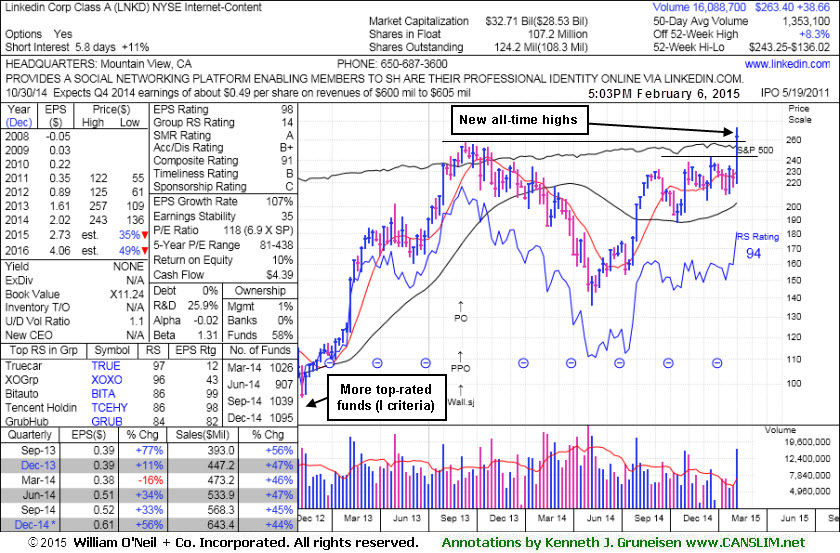
Linkedin Corp (LNKD +$0.43 or +0.17% to $260.58) is consolidating above its 50-day moving average (DMA) line and prior highs. It stalled and has made no progress since the considerable "breakaway gap" noted in the 2/06/15 mid-day report (read here). It hit new 52-week and all-time highs (N criteria) clearing all resistance due to overhead supply, triggering a technical buy signal.
LNKD was last shown in this FSU section on 2/27/15 with annotated graphs under the headline, "Holding Ground Following Breakaway Gap". A "breakaway gap" has been noted as the one exception where investors may chase a stock more than +5% above prior highs, however risk increases that an ordinary pullback may trigger the strict sell rules requiring investors to always limit losses.
It reported earnings +56% on +44% sales revenues for the Dec '14 quarter. That marked its 3rd consecutive quarter with earnings above the +25% minimum guideline (C criteria), following sub par Dec '13 and Mar '14 earnings results. It has maintained a strong annual earnings (A criteria) history.
The high-ranked leader from the Internet - Content group's Return On Equity of 9% is still below the 17% guideline, which is a minor concern. Its Up/Down Volume Ratio of 1.4 is an unbiased indication its shares have been under accumulation over the past 50 days. Ownership by top-rated funds has been on the rise from 907 in Jun '14 to 1,100 in Dec '14, an encouraging sign concerning the I criteria.
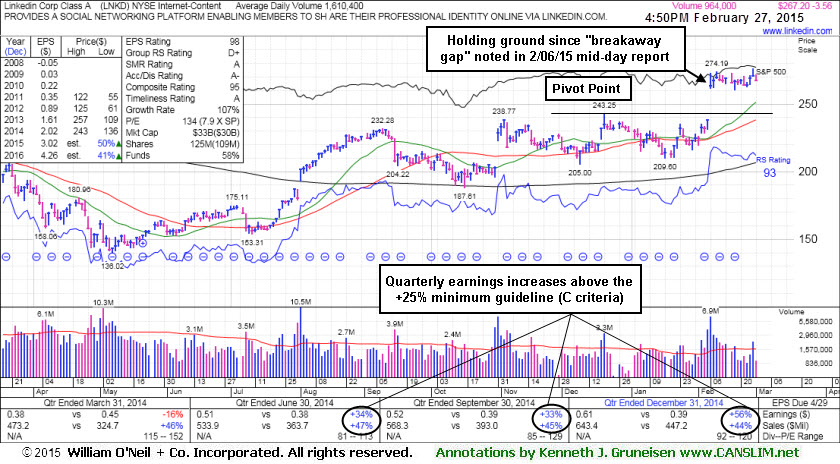
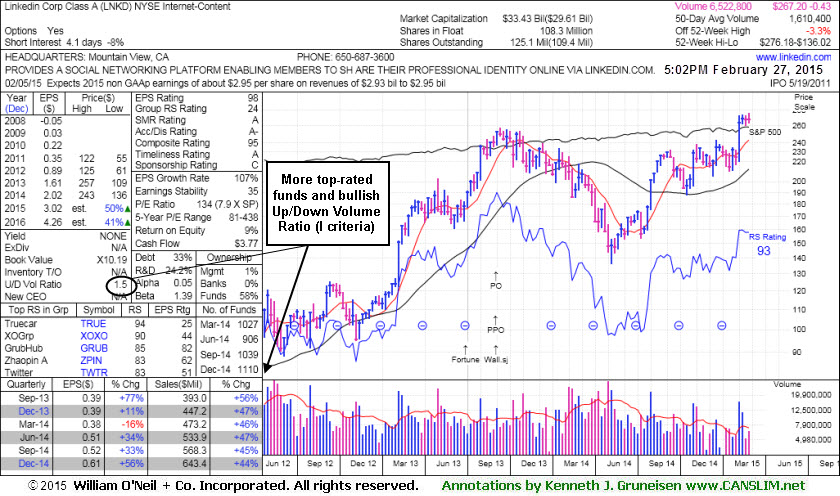
Linkedin Corp (LNKD -$3.56 or -1.31% to $267.20) has been stubbornly holding its ground with volume totals generally cooling, yet it tallied one more gain with above average volume this week. It is extended from prior highs following the considerable "breakaway gap" noted in the 2/06/15 mid-day report (read here). A "breakaway gap" has been noted as the one exception where investors may chase a stock more than +5% above prior highs, however risk increases that an ordinary pullback may trigger the strict sell rules requiring investors to always limit losses. Disciplined investors avoid chasing extended stocks and may watch for a new base or secondary buy point to possibly develop and be noted.
LNKD was last shown in this FSU section on 2/06/15 with annotated graphs under the headline, "Breakaway Gap Cleared All Resistance Due to Overhead Supply". It hit new 52-week and all-time highs (N criteria) clearing all resistance due to overhead supply, triggering a technical buy signal. It reported earnings +56% on +44% sales revenues for the Dec '14 quarter. That marked its 3rd consecutive quarter with earnings above the +25% minimum guideline (C criteria), following sub par Dec '13 and Mar '14 earnings results. It has maintained a strong annual earnings (A criteria) history.
The high-ranked leader from the Internet - Content group's Return On Equity of 9% is still below the 17% guideline, which is a minor concern. Its Up/Down Volume Ratio of 1.5 is an unbiased indication its shares have been under accumulation over the past 50 days. Ownership by top-rated funds has been on the rise from 907 in Jun '14 to 1,110 in Dec '14, an encouraging sign concerning the I criteria.
LNKD was dropped from the Featured Stocks list on 5/28/13, and it was last shown in this FSU section on 4/07/14 with annotated graphs under the headline, "Overhead Supply Likely to Hinder Any Subsequent Rally Effort". Following a deep consolidation below its 200-day moving average (DMA) line it gradually rebounded. A "breakaway gap" is the one noted exception where investors may chase a stock more than +5% above prior highs, however risk increases that an ordinary pullback may trigger the strict sell rules requiring disciplined investors to always limit losses.
The high-ranked leader from the Internet - Content group's Return On Equity of 10% is still below the 17% guideline, which is a minor concern. Ownership by top-rated funds has been on the rise from 907 in Jun '14 to 1,095 in Dec '14, an encouraging sign concerning the I criteria.
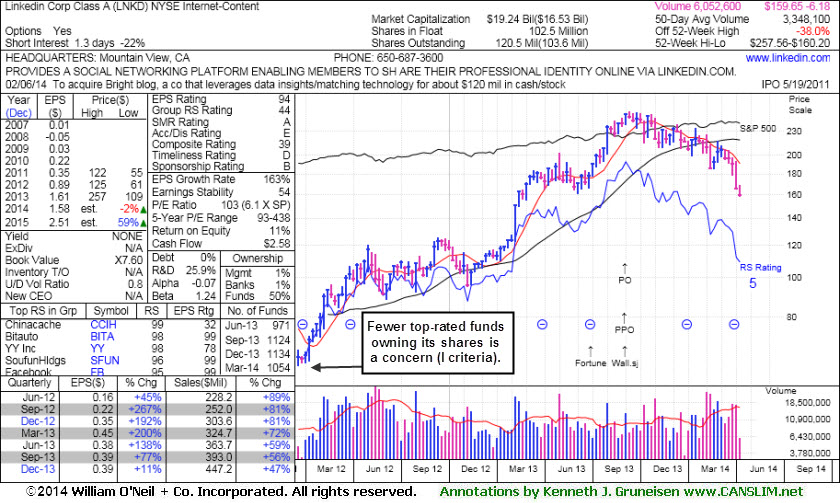
Linkedin Corp (LNKD +$2.00 or +1.10% to $184.31) is not currently Featured Stocks list. It slumped badly with today's 4th consecutive loss, its 2nd consecutive loss marked by heavy volume. It is in poor technical shape, trading well below both its 50-day and its 200-day moving average (DMA) lines which recently converged and crossed over, an ominously bearish signal. Fundamental concerns have also been raised after the latest quarter ended December 31, 2013 versus the year ago period as it reported earnings +11% on +47% sales revenues, below the +25% minimum earnings guideline (C criteria).
It was dropped from the Featured Stocks list on 5/28/13. Weak action of late has LNKD trading near the lows hit after its last appearance in this FSU section long ago on 5/21/13 with annotated graphs under the headline, "Found Encouraging Support at 50-Day Moving Average With Volume-Driven Gains". Subsequent violations raised greater concerns and triggered more worrisome technical sell signals. Some investors may have been frustrated by its rebound and the impressive rally into new high territory that followed. Anyone who held on for the long-term may be in trouble now, as it faces a tremendous amount of overhead supply which is likely to hinder any upward price progress.
The high-ranked leader from the Internet - Content group's Return On Equity of 11% is still below the 17% guideline, which is a minor concern. Ownership by top-rated funds has been on the decline recently, falling from 1,124 in Sep '13 to 1,054 in Mar '14, not an encouraging sign concerning the I criteria. Its current Up/Down Volume Ratio of 0.8 is also an unbiased indication that its shares have been under distributional pressure over the past 50 days. 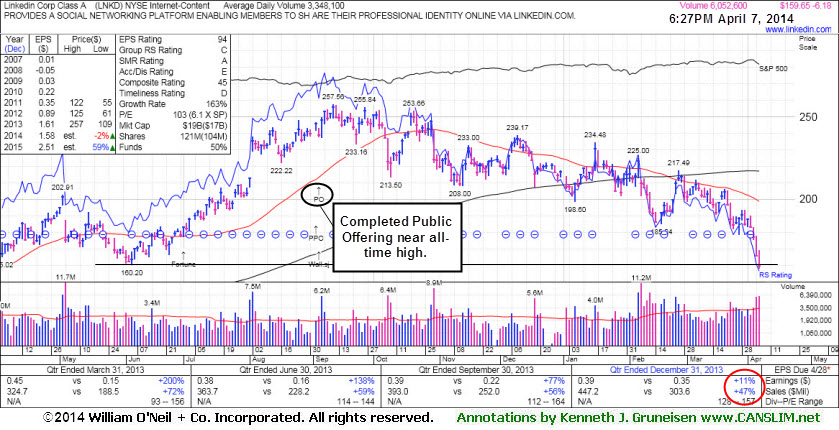
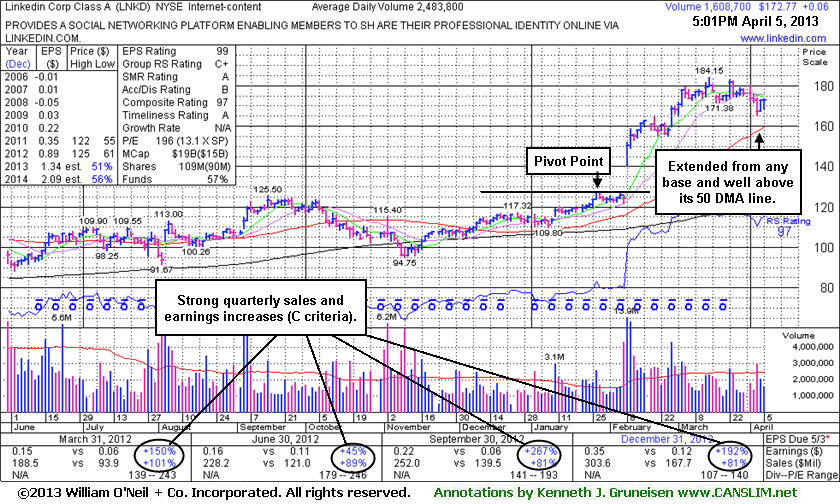
The company's fundamentals (C and A criteria) remain strong, and it reported a solid +200% earnings increase for the Mar '13 quarter versus the year ago period. The high-ranked leader from the Internet - Content group's Return On Equity of 13% is still below the 17% guideline, which is a minor concern. Ownership by top-rated funds has been on the rise, increasing from 601 in Jun '12 to 867 in Mar '13, a very reassuring sign concerning the I criteria. Its current Up/Down Volume Ratio of 1.4 is an unbiased indication that its shares have been under accumulation over the past 50 days. More time is needed for it to possibly form a new base and for a new pivot point to be noted.
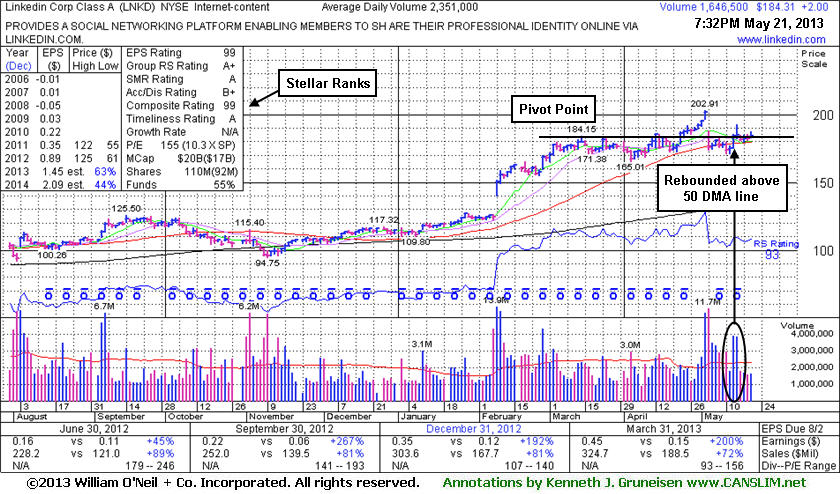
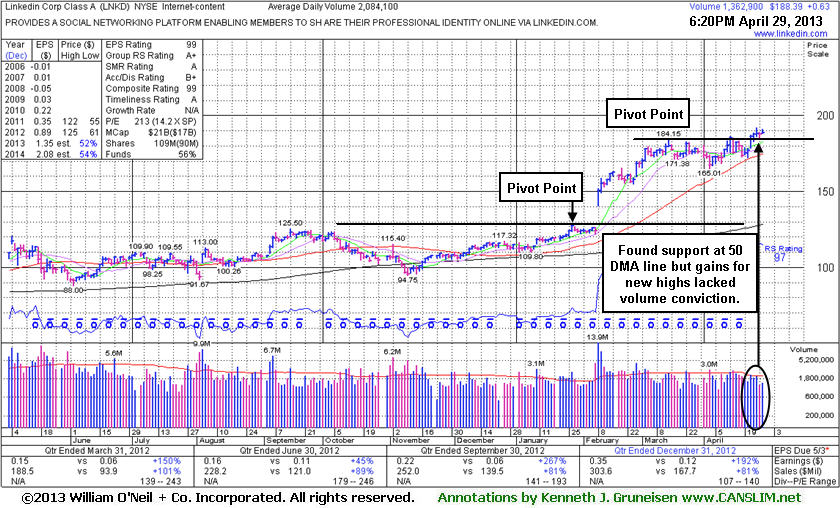
Linkedin Corp (LNKD +$0.63 or +0.34% to $188.39) rallied with near average volume recently for new 52-week highs. Gains above the pivot point backed by a minimum of +40% above average volume are needed to trigger a proper new (or add-on) technical buy signal. Its 50-day moving average (DMA) line and recent low define important near-term chart support to watch. Its last appearance in this FSU section was on 4/05/13 with an annotated graph under the headline, "Extended From Prior Base 8-Weeks After Breakaway Gap".
Investors should be especially watchful for any subsequent sell signals, especially with consideration that the broader market direction (M criteria) is always likely to impact 3 out of 4 stocks. The company's fundamentals (C and A criteria) remain strong. The high-ranked leader from the Internet - Content group's Return On Equity of 13% is still below the 17% guideline, which is a minor concern. Ownership by top-rated funds has been on the rise, increasing from 601 in Jun '12 to 845 in Mar '13, a very reassuring sign concerning the I criteria. Its current Up/Down Volume Ratio of 1.2 is an unbiased indication that its shares have been under accumulation over the past 50 days.
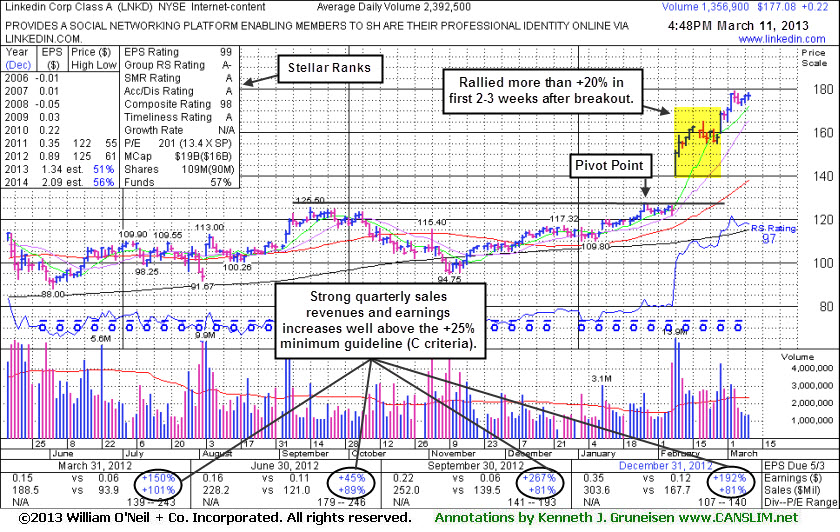
Having quickly rallied more than +20% in the first 2-3 weeks after its technical breakout, regular readers were reminded that the investment system rules suggest holding such explosive winners for a minimum of 8 weeks to allow for potentially greater gains. It has been 8 weeks since its breakout, and it may produce more climatic gains. However, investors should be especially watchful for any subsequent sell signals, especially with consideration that the broader market direction (M criteria) is always likely to impact 3 out of 4 stocks. The company's fundamentals (C and A criteria) remain strong. The high-ranked leader from the Internet - Content group's Return On Equity of 13% is still below the 17% guideline, which is a minor concern. Ownership by top-rated funds has been on the rise, increasing from 601 in Jun '12 to 848 in Mar '13, a very reassuring sign concerning the I criteria. Its current Up/Down Volume Ratio of 1.6 is an unbiased indication that its shares have been under accumulation over the past 50 days.
Linkedin Corp (LNKD +$26.39 or +21.27% to $150.48) is holding its ground stubbornly while perched near its all-time high. It is very extended from any sound base, yet may produce more climatic gains. It has recently been noted - "Disciplined investors may watch for secondary buy points or additional bases to possibly form and be noted in the weeks ahead." Having quickly rallied more than +20% in the first 2-3 weeks after its technical breakout, the investment system rules suggest holding such explosive winners for a minimum of 8 weeks to allow for potentially greater gains. Disciplined investors never hold any stock if it fails badly however, or if it falls more than -7% from their purchase price.
LNKD was last seen in this FSU section on 2/08/13 with an annotated graph under the headline -"Quickly Extended From Prior Highs Following Big Breakaway Gap", after highlighted in yellow in that day's mid-day report (read here) with a new pivot point cited based on its 1/28/13 high plus 10 cents. In reaction to its report of earnings +192% on +81% sales revenues for the Dec '12 quarter there was a considerable "breakaway gap" into new all-time high territory helped it blast from a 4-month cup-with-handle base. Longtime members may recall that a breakaway gap has previously been noted as the one exception which allows for new buying efforts more than +5% above prior highs, however risk increases the further one chases any stock above prior highs that an ordinary pullback may trigger the fact-based system's strict sell rule.
The stock rebounded impressively from lows below its 200-day moving average (DMA) line since dropped from the Featured Stocks list on 10/19/12. The company's fundamentals (C and A criteria) remain strong. The high-ranked leader from the Internet - Content Its Return On Equity of 13% is still below the 17% guideline, which is a minor concern. Ownership by top-rated funds has been on the rise, increasing from 185 in Sep '11 to 828 in Dec '12, a very reassuring sign concerning the I criteria. Its current Up/Down Volume Ratio of 1.6 is an unbiased indication that its shares have been under accumulation over the past 50 days.
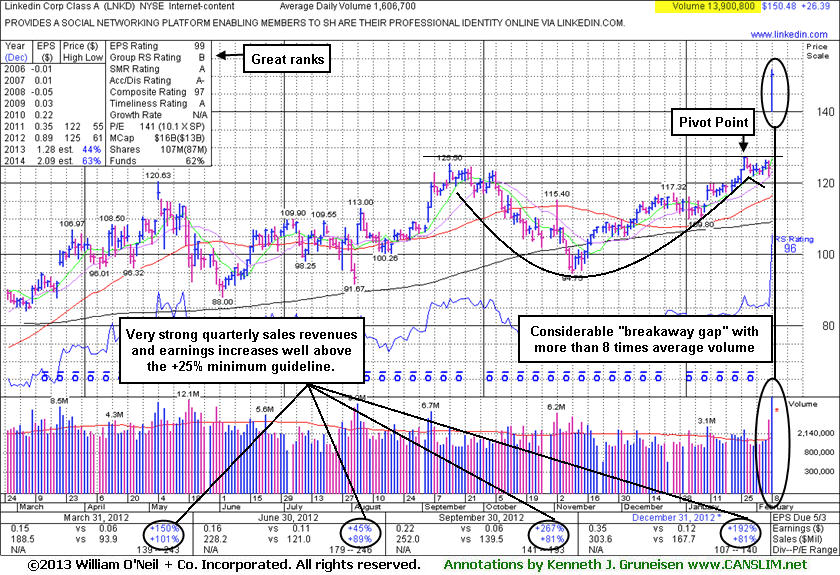
Linkedin Corp (LNKD +$26.39 or +21.27% to $150.48) was highlighted in yellow in the earlier mid-day report (read here) with new pivot point cited based on its 1/28/13 high plus 10 cents. It reported earnings +192% on +81% sales revenues for the Dec '12 quarter and it gapped up today. Its considerable "breakaway gap" into new all-time high territory helped it blast from a 4-month cup-with-handle base. Longtime members may recall that a breakaway gap has previously been noted as the one exception which allows for new buying efforts more than +5% above prior highs, however risk increases the further one chases any stock above prior highs that an ordinary pullback may trigger the fact-based system's strict sell rule. Disciplined investors always limit losses by selling if ever any stock fall more than -7% from its purchase price.
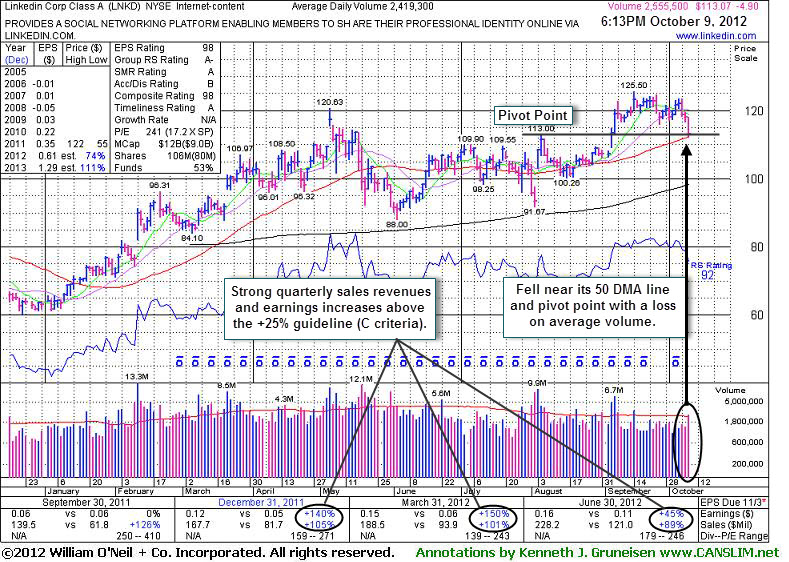
LNKD was last seen in this FSU section on 10/09/12 with an annotated graph under the headline, "Pullback Testing Prior Highs And 50-Day Moving Average", when retreating near prior highs in the $113 area along with its 50-day moving average (DMA) line. Subsequent violations triggered technical sell signals. It has rebounded impressively from lows below its 200-day moving average (DMA) line since dropped from the Featured Stocks list on 10/19/12.
Its fundamentals (C and A criteria) remain strong. It was most recently noted in the 1/10/13 mid-day report - "Patient and disciplined investors may keep it on their watch list and wait for a proper base and breakout to possibly be noted in the coming weeks."
The high-ranked leader from the Internet - Content Its Return On Equity of 11% (previously noted) is below the 17% guideline, which is a minor concern. Ownership by top-rated funds has been on the rise, increasing from 185 in Sep '11 to 809 in Dec '12, a very reassuring sign concerning the I criteria.
If it resumes its rally there is some overhead supply up through the $125 area that may hinder its upward progress after trading at higher levels in recent weeks, however it remains perched only 9.9% off its all-time high. Keep in mind that disciplined investors always limit losses by selling if ever any stock fall more than -7% from its purchase price. Proper discipline with this fact-based system always starts by only buying stocks after they have triggered a technical buy signal, but before they are extended more than +5% above their pivot point. In bullish market environments, high-ranked leaders often form multiple bases. Odds are most favorable for investors when buying fresh technical breakouts from proper bases, and odds are not as favorable when buying stocks on pullbacks near support.
Strong quarterly earnings increases satisfy the C criteria and its annual earnings history (A criteria) has been strong. It completed another Public Offering on 11/16/11 following its IPO in May '11. Its Return On Equity of 11% (previously noted) is below the 17% guideline, which is a minor concern. Ownership by top-rated funds has been on the rise, increasing from 185 in Sep '11 to 643 in Sep '12, a very reassuring sign concerning the I criteria.
Often, when a leading stock is breaking of a solid base it is highlighted in CANSLIM.net's Mid-Day Breakouts Report. The most relevant factors are noted in the report which alerts prudent CANSLIM oriented investors. After doing any necessary backup research, the investor is prepared to act after the stock triggers a technical buy signal (breaks above its pivot point on more than +50% average turnover) but before it gets too extended from a sound base. Disciplined investors know to buy as near as possible to the pivot point and avoid chasing stocks after they have rallied more than +5% above their pivot point. It is crucial to always limit losses whenever any stock heads the wrong direction, and disciplined investors sell if a struggling stock ever falls more than -7% from their purchase price.
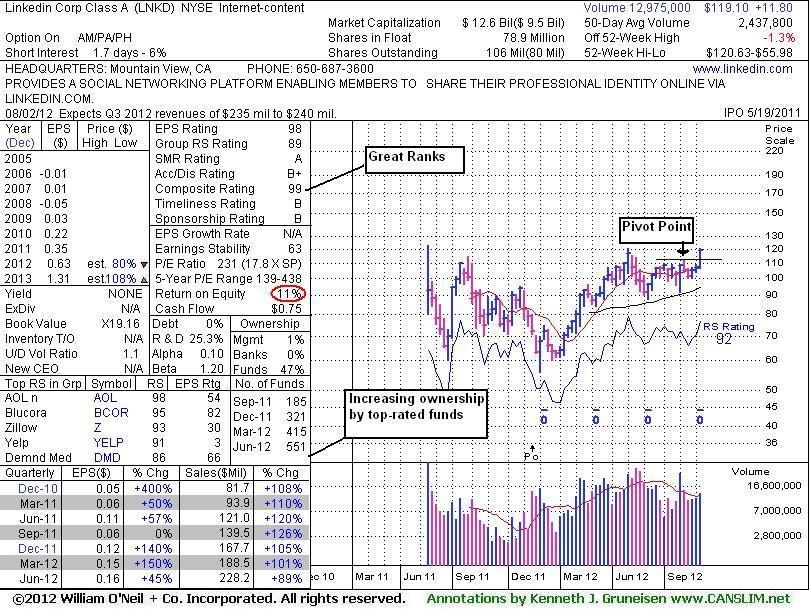
Linkedin Corp (LNKD +$5.82 or +5.14% to $119.10) traded up above its "max buy" level today with above average volume behind another gain while approaching its 52-week high and its color code was changed to green. The high-ranked leader from the Internet - Content group was highlighted in yellow in the 9/05/12 mid-day report (read here) with an annotated daily graph included. It cleared the pivot point cited based on its 8/06/12 high plus 10 cents with a considerable gain backed by twice average volume and finished strong that day clinching a technical buy signal.
Strong quarterly earnings increases satisfy the C criteria and its annual earnings history (A criteria) has been strong. It completed another Public Offering on 11/16/11 following its IPO in May '11. The annotated weekly graph below shows that it cleared the pivot point cited and faces no overhead supply while trading within close striking distance of all-time highs. Its Return On Equity of 11% (see red circle) is below the 17% guideline, which is a minor concern. Ownership by top-rated funds has been on the rise, increasing from 185 in Sep '11 to 551 in Jun '12, a very reassuring sign concerning the I criteria.