Holding Ground new 52-Week High After Negative Reversal - Friday, November 30, 2012
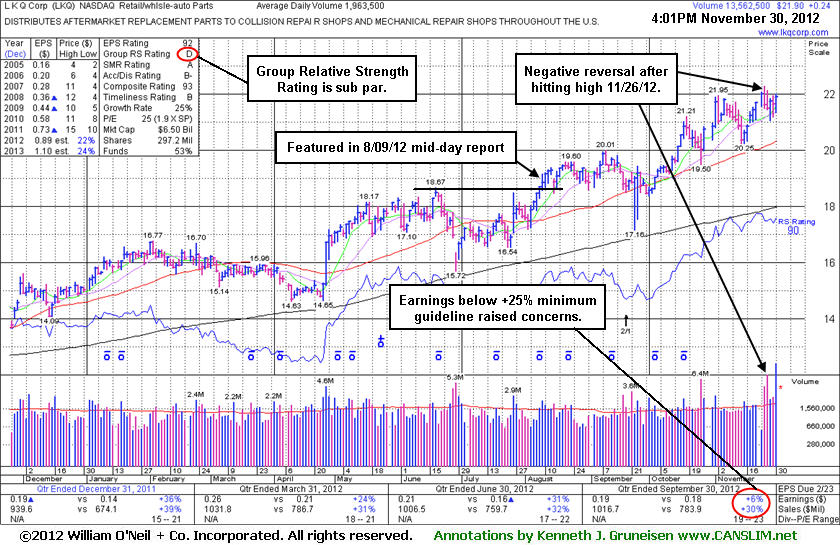
L K Q Corp (LKQ +$0.24 or +1.1% to $21.90) is still holding its ground near its 52-week high today following a worrisome "negative reversal" and finish near the session low on 11/26/12 followed by additional losses on above average volume. It has shown resilience and stayed well above its 50-day moving average (DMA) line since its last appearance in this FSU section on 11/14/12 with an annotated graph under the headline, "Consolidating Following Sub Par Earnings Report". No resistance remains due to overhead supply and it could tally more meaningful gains. Disciplined investors may sooner look for a more ideal buy candidate without any fundamental flaws now that the market (M criteria) has resumed its rally.
Earnings were reported +6% on +30% sales revenues for the Sep '12 quarter (see red circle) and noted as below the +25% minimum earnings guideline (C criteria) while recently raising fundamental concerns. Another lingering concern is the group's below average Group Relative Strength Rating (D) while other leaders in the group have struggled in recent months. Ownership by top-rated funds rose from 456 in Sep '11 to 578 in Sep '12, a reassuring sign concerning the I criteria. The company has maintained a strong annual earnings (A criteria) growth history. It changed its ticker symbol (from LKQX) and found support above its 200 DMA line in recent months. It had survived but failed to impress since dropped from the Featured Stocks list on 4/09/08.

Consolidating Following Sub Par Earnings Report - Wednesday, November 14, 2012
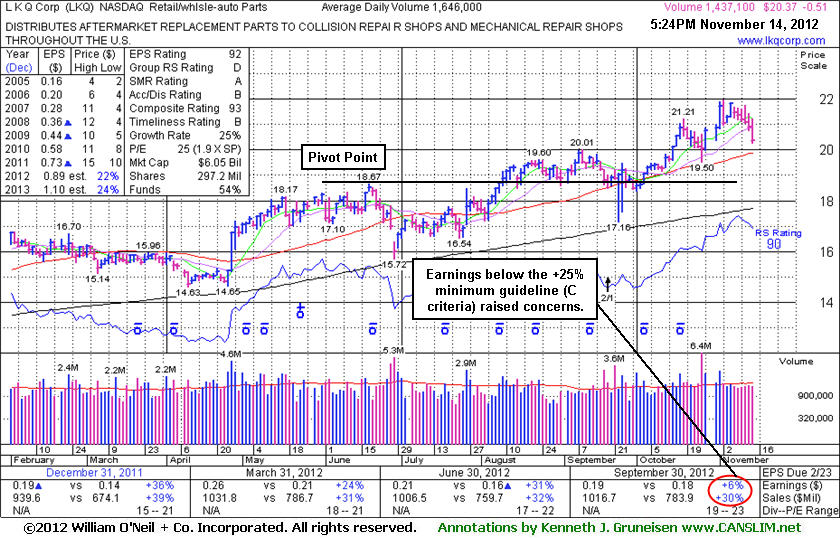
L K Q Corp (LKQ -$0.51 or -2.44% to $20.37) suffered its 6th consecutive small loss today with below average volume. No resistance remains due to overhead supply. It has been showing impressive resilience and strength after reporting earnings +6% on +30% sales revenues for the Sep '12 quarter (see red circle). Results below the +25% minimum earnings guideline (C criteria) raised fundamental concerns. Disciplined investors may sooner look for a more ideal buy candidate without any fundamental flaws once the market resumes its rally. The M criteria currently argues against new buying efforts and strongly suggests that investors protect capital.
Its last appearance in this FSU section was on 10/19/12 with an annotated graph under the headline, " Resilient Action Following Prior Shakeouts", and it went on to new all-time highs before its latest consolidation. Another lingering concern is the group's below average Group Relative Strength Rating (D) while other leaders in the group have struggled in recent months. Ownership by top-rated funds rose from 456 in Sep '11 to 580 in Sep '12, a reassuring sign concerning the I criteria. The company has maintained a strong annual earnings (A criteria) growth history. It changed its ticker symbol (from LKQX) and found support above its 200 DMA line in recent months. It had survived but failed to impress since dropped from the Featured Stocks list on 4/09/08.

Resilient Action Following Prior Shakeouts - Friday, October 19, 2012
L K Q Corp (LKQ -$0.37 or -1.77% to $20.43) is perched near its all-time high following volume-driven gains. It will release third quarter 2012 financial results on Thursday, October 25, 2012, before the market opens. Volume and volatility often increase near earnings news.
LKQ was highlighted in yellow with pivot point based on its 6/19/12 high plus 10 cents in the 8/09/12 mid-day report (read here). A solid gain with +55% above average volume while rising above its pivot point triggered a technical buy signal. Action has been mostly bullish in recent weeks, however a new pivot point was not cited due to its choppy action and the lack of meaningful price progress following the prior technical breakout. Do not be confused by a 2:1 share split effective 9/19/12 (Featured Price, Pivot Point and Max Buy were adjusted). Recently the high-ranked the Retail/Wholesale - AutoParts firm rallied well above its "max buy" level, unhindered by resistance remaining due to overhead supply.
Its last appearance in this FSU section was on 9/17/12 with an annotated graph under the headline, "Consolidating Under 'Max Buy' Level Again", as it retreated below its "max buy" level and its color code was changed to yellow. It found prompt support after shakeouts below its 50-day moving average (DMA) line intra-day on 9/24/12 and 9/25/12 very likely forced disciplined investors to sell and protect their interest.
It reported earnings +31% on +32% sales revenues for the Jun '12 quarter. Three of the past 4 quarters showed earnings increases above the +25% minimum guideline (C criteria). The company also has maintained a strong annual earnings (A criteria) growth history. It changed its ticker symbol (from LKQX) and found support above its 200 DMA line in recent months. It had survived but failed to impress since dropped from the Featured Stocks list on 4/09/08.
One concern previously noted is the group's below average Group Relative Strength Rating (E - see red circle) while other leaders in the group have struggled in recent months. However, ownership by top-rated funds rose from 456 in Sep '11 to 569 in Sep '12, a reassuring sign concerning the I criteria. Its current Up/Down Volume Ratio of 1.3 is an unbiased indication that its shares have been under accumulation over the past 50 days.
Consolidating Under "Max Buy" Level Again - Monday, September 17, 2012
L K Q Corp (LKQ -$0.63 or -1.61% to $38.47) retreated below its "max buy" level and its color code was changed to yellow again. Prior highs in the $37 area define initial support to watch above its 50-day moving average (DMA) line. Its last appearance in this FSU section was on 8/10/12 with an annotated graph under the headline, "New 52-Week High Territory After Six Straight Gains", during what ended up being a streak of 8 consecutive gains. Since then the Retail/Wholesale - AutoParts firm has held its ground above the prior highs.It reported earnings +28% on +32% sales revenues for the Jun '12 quarter. Three of the past 4 quarters showed earnings increases above the +25% minimum guideline (C criteria). The company also has maintained a strong annual earnings (A criteria) growth history. It changed its ticker symbol (from LKQX) and found support above its 200 DMA line in recent months. It had survived but failed to impress since dropped from the Featured Stocks list on 4/09/08.
One concern is the group's below average Group Relative Strength Rating (E) while other leaders in the group have struggled in recent months. However, ownership by top-rated funds rose from 456 in Sep '11 to 554 in Jun '12, a reassuring sign concerning the I criteria.
New 52-Week High Territory After Six Straight Gains - Friday, August 10, 2012
Often, when a leading stock is setting up to breakout of a solid base it is highlighted in CANSLIM.net's Mid-Day Breakouts Report. The most relevant factors are noted in the report which alerts prudent CANSLIM oriented investors to place the issue in their watch list. After doing any necessary backup research, the investor is prepared to act after the stock triggers a technical buy signal (breaks above its pivot point on more than +50% average turnover) but before it gets too extended from a sound base. In the event the stock fails to trigger a technical buy signal and its price declines then it will simply be removed from the watch list. Disciplined investors know to buy as near as possible to the pivot point and avoid chasing stocks after they have rallied more than +5% above their pivot point. It is crucial to always limit losses whenever any stock heads the wrong direction, and disciplined investors sell if a struggling stock ever falls more than -7% from their purchase price.L K Q Corp (LKQ +$0.59 or +1.56% to $38.32) hit another new 52-week high today and finished near the session high with its 6th consecutive gain. The Retail/Wholesale - AutoParts firm was highlighted in yellow with pivot point based on its 6/19/12 high plus 10 cents when featured in the 8/09/12 mid-day report (read here). It finished that session with a gain backed by +55% above average volume while rising above its pivot point and triggering a technical buy signal.
It reported earnings +28% on +32% sales revenues for the Jun '12 quarter. Three of the past 4 quarters showed earnings increases above the +25% minimum guideline (C criteria). The company also has maintained a strong annual earnings (A criteria) growth history. It changed its ticker symbol (from LKQX) and found support above its 200 DMA line in recent months. It survived but failed to impress since dropped from the Featured Stocks list on 4/09/08.
One concern is the group's below average Group Relative Strength Rating (D+) while other leaders in the group have struggled in recent months. However, ownership by top-rated funds rose from 458 in Sep '11 to 547 in Jun '12, a reassuring sign concerning the I criteria.