Testing 200-Day Average as Relatve Strength Fades - Thursday, September 26, 2019
50-Day Moving Average Recently Acted as Resistance - Thursday, September 12, 2019
Sputtering Below 50-Day Average and Below Pivot Point - Tuesday, August 20, 2019
Consolidating Following a Negative Reversal at High - Monday, July 22, 2019
Prior Gains Lacked Volume; 50-Day Moving Average Defines Support - Monday, June 17, 2019
Long-Term Care Firm Hovering Near All-Time High - Tuesday, May 14, 2019
Sputtering Near 50-Day Moving Average Line - Monday, April 1, 2019
Recent Gains for New Highs Lacked Great Volume Conviction - Thursday, February 21, 2019
Healthcare Services Firm Reached a New High - Wednesday, January 23, 2019
Avoid "Chasing" Stocks Past Pivot By +5% - Tuesday, March 27, 2007
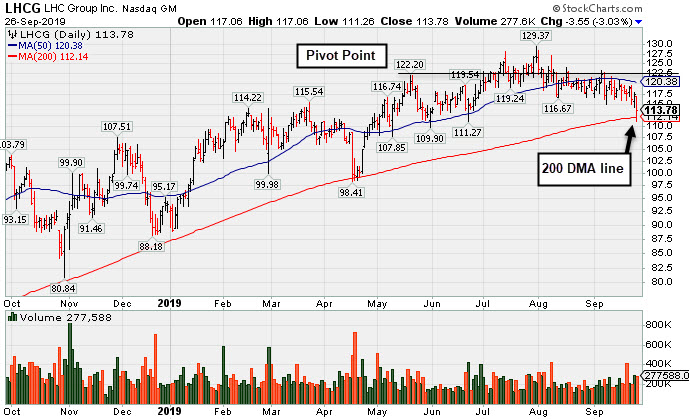
Testing 200-Day Average as Relatve Strength Fades - Thursday, September 26, 2019
L H C Group Inc (LHCG -$3.55 or -3.03% to $113.78) undercut the recent low ($115.06 9/10/19) with today's volume-driven loss testing its 200-day moving average (DMA) line ($112.14). Its Relative Strength rating has slumped to 79, below the 80+ minimum guideline for buy candidates. Subsequent losses below the 200 DMA line would raise more serious concerns. A rebound above its 50 DMA line ($120.38) is needed to help its outlook. LHCG last shown in this FSU section on 9/12/19 with an annotated graph under the headline, "50-Day Moving Average Recently Acted as Resistance".
Fundamentals remain strong after it reported earnings +27% on +3% sales revenues for the Jun '19 quarter, continuing its strong earnings track record above the +25% minimum guideline (C criteria). Its annual earnings growth (A criteria) has been strong, and it has a current Earnings Per Share Rating of 98.
The number of top-rated funds owning its shares roe from 441 in Sep '18 to 533 in Jun '19 and the current Up/Down Volume Ratio of 1.3 is an unbiased indication its shares have been under accumulation over the past 50 days, a reassuring sign concerning the I criteria. It has earned an A Timeliness Rating and a C Sponsorship Rating. It has a small supply of only 31.5 million shares (S criteria) outstanding, which can contribute to greater volatility in the event of institutional buying or selling.
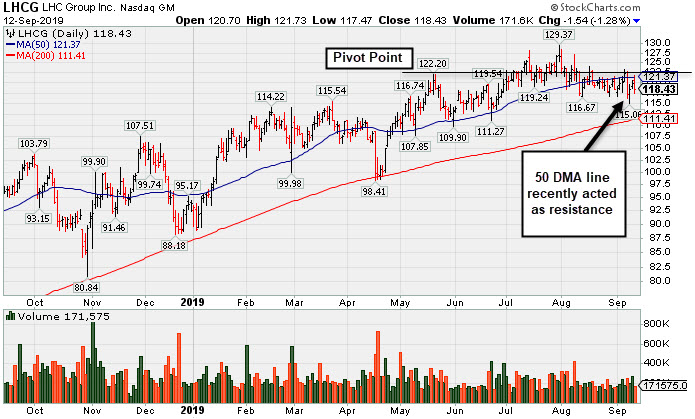
50-Day Moving Average Recently Acted as Resistance - Thursday, September 12, 2019
L H C Group Inc (LHCG -$1.54 or -1.28% to $118.43) halted its slide after undercutting the prior low ($116.67 on 8/13/19) raising more serious concerns. Its 50-day moving average (DMA) line ($121.37) has acted as resistance, and a rebound above that important short-term average is needed for its outlook to improve.
Fundamentals remain strong after it reported earnings +27% on +3% sales revenues for the Jun '19 quarter, continuing its strong earnings track record above the +25% minimum guideline (C criteria). LHCG last shown in this FSU section on 8/20/19 with an annotated graph under the headline, "Sputtering Below 50-Day Average and Below Pivot Point". Its annual earnings growth (A criteria) has been strong, and it has a current Earnings Per Share Rating of 99. The number of top-rated funds owning its shares roe from 441 in Sep '18 to 534 in Jun '19 and the current Up/Down Volume Ratio of 1.2 is an unbiased indication its shares have been under accumulation over the past 50 days, a reassuring sign concerning the I criteria. It has earned an A Timeliness Rating and a C Sponsorship Rating. It has a small supply of only 31.5 million shares (S criteria) outstanding, which can contribute to greater volatility in the event of institutional buying or selling.
Charts courtesy of www.stockcharts.com
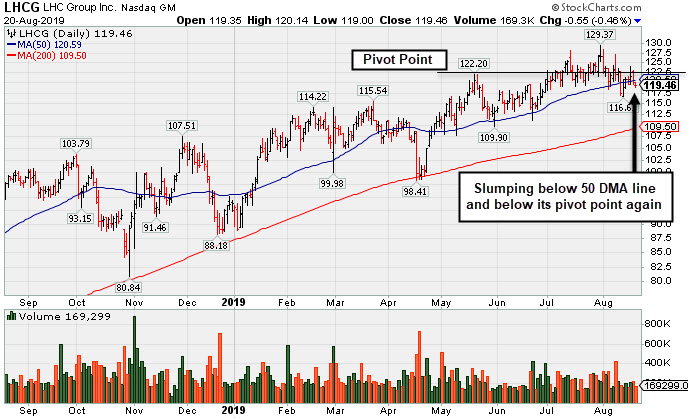
Sputtering Below 50-Day Average and Below Pivot Point - Tuesday, August 20, 2019
L H C Group Inc (LHCG -$0.55 or -0.46% to $119.46) fell below its 50-day moving average (DMA) line ($120) while sputtering below its pivot point again. Any breach of recent low ($116.67 on 8/13/19) would raise more serious concerns and trigger a worrisome sell signal.
Fundamentals remain strong after it reported earnings +27% on +3% sales revenues for the Jun '19 quarter, continuing its strong earnings track record above the +25% minimum guideline (C criteria). LHCG last shown in this FSU section on 7/22/19 with an annotated graph under the headline, "Consolidating Following a Negative Reversal at High". Its annual earnings growth (A criteria) has been strong, and it has a current Earnings Per Share Rating of 99. The number of top-rated funds owning its shares roe from 441 in Sep '18 to 537 in Jun '19 and the current Up/Down Volume Ratio of 1.4 is an unbiased indication its shares have been under accumulation over the past 50 days, a reassuring sign concerning the I criteria. It has earned an A Timeliness Rating and a C Sponsorship Rating. It has a small supply of only 31.5 million shares (S criteria) outstanding, which can contribute to greater volatility in the event of institutional buying or selling.
Charts courtesy of www.stockcharts.com
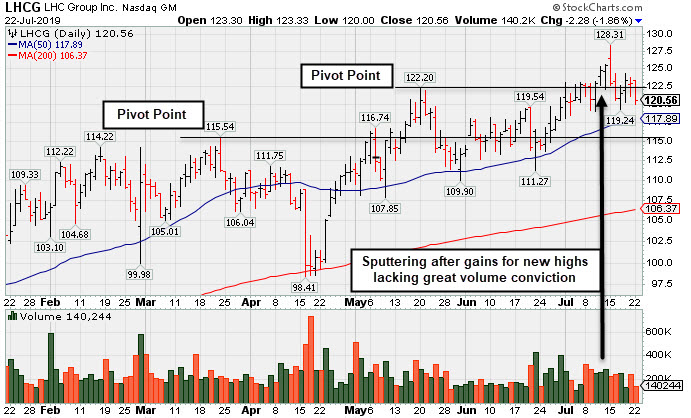
Consolidating Following a Negative Reversal at High - Monday, July 22, 2019
L H C Group Inc (LHCG -$2.28 or -1.86%to $120.56) is consolidating following a "negative reversal" on 7/15/19 after hitting an all-time high with gains lacking great volume conviction. Subsequent gains above its new pivot point backed by at least +40% above average volume may help to clinch a convincing new (or add-on) technical buy signal. Meanwhile, Its 50-day moving average (DMA) line ($117.90) defines near-term support above recent lows.
Fundamentals remain strong after it reported earnings +56% on +73% sales revenues for the Mar '19 quarter, continuing its strong earnings track record above the +25% minimum guideline (C criteria). LHCG last shown in this FSU section on 6/17/19 with an annotated graph under the headline, "Prior Gains Lacked Volume; 50-Day Moving Average Defines Support". Its annual earnings growth (A criteria) has been strong, and it has a current Earnings Per Share Rating of 99. The number of top-rated funds owning its shares fell from 492 in Dec '18 to 488 in Jun '19. However, the current Up/Down Volume Ratio of 1.4 is an unbiased indication its shares have been under accumulation over the past 50 days, a reassuring sign concerning the I criteria. It has earned an A Timeliness Rating and a C Sponsorship Rating. It has a small supply of only 31.5 million shares (S criteria) outstanding, which can contribute to greater volatility in the event of institutional buying or selling.
Charts courtesy of www.stockcharts.com
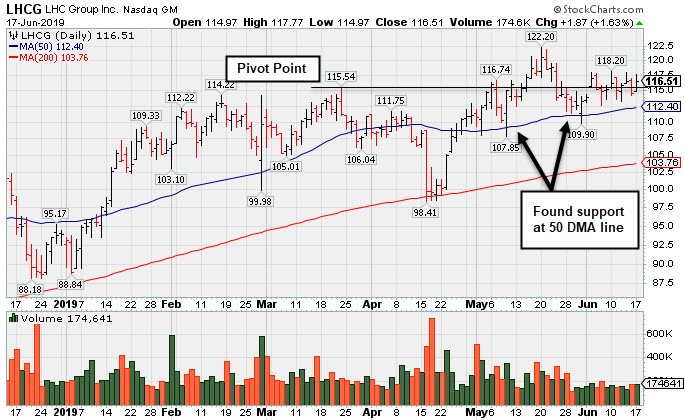
Prior Gains Lacked Volume; 50-Day Moving Average Defines Support - Monday, June 17, 2019
L H C Group Inc (LHCG +$1.87 or +1.63% to $116.51) quietly traded back above its pivot point with today's gain backed by lighter than average volume. Prior gains above the pivot point lacked great volume conviction indicative of institutional buying demand, so subsequent gains backed by at least +40% above average volume may help clinch a more convincing new (or add-on) technical buy signal. Its 50-day moving average DMA line ($112.40) defines near-term support.
Fundamentals remain strong after it reported earnings +56% on +73% sales revenues for the Mar '19 quarter, continuing its strong earnings track record above the +25% minimum guideline (C criteria). LHCG last shown in this FSU section on 5/14/19 with an annotated graph under the headline, "Long-Term Care Firm Hovering Near All-Time High".
Its annual earnings growth (A criteria) has been strong, and it has a current Earnings Per Share Rating of 99. The number of top-rated funds owning its shares rose from 350 in Mar '18 to 521 in Mar '19, a reassuring sign concerning the I criteria. It has earned an A Timeliness Rating and a C Sponsorship Rating. It has a small supply of only 31.5 million shares (S criteria) outstanding, which can contribute to greater volatility in the event of institutional buying or selling.
Charts courtesy of www.stockcharts.com
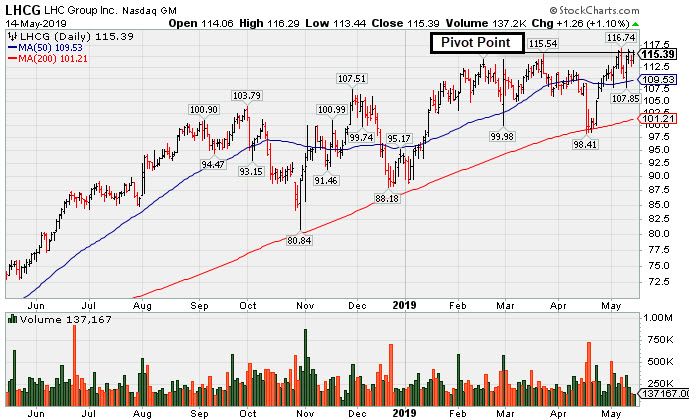
Long-Term Care Firm Hovering Near All-Time High - Tuesday, May 14, 2019
L H C Group Inc (LHCG +$1.26 or +1.10% to $115.39) reported earnings +56% on +73% sales revenues for the Mar '19 quarter, continuing its strong earnings track record above the +25% minimum guideline (C criteria). It finished near the pivot point cited based on its 3/22/19 high plus 10 cents. Subsequent gains above the pivot point backed by at least +40% above average volume may trigger a new (or add-on) technical buy signal.
It found support near its 50-day moving average (DMA) line and has been challenging its all-time high. In recent months it tested support at its 200 DMA line. LHCG was highlighted in yellow with pivot point cited based on its 11/29/18 high plus 10 cents in the 1/23/19 mid-day report (read here). It was last shown in this FSU section on 4/01/19 with an annotated graph under the headline, "Sputtering Near 50-Day Moving Average Line".
Its annual earnings growth (A criteria) has been strong, and it has a current Earnings Per Share Rating of 99. The number of top-rated funds owning its shares rose from 350 in Mar '18 to 511 in Mar '19, a reassuring sign concerning the I criteria. It has earned an A Timeliness Rating and a C Sponsorship Rating. It has a small supply of only 31.4 million shares (S criteria) outstanding, which can contribute to greater volatility in the event of institutional buying or selling.
Charts courtesy of www.stockcharts.com
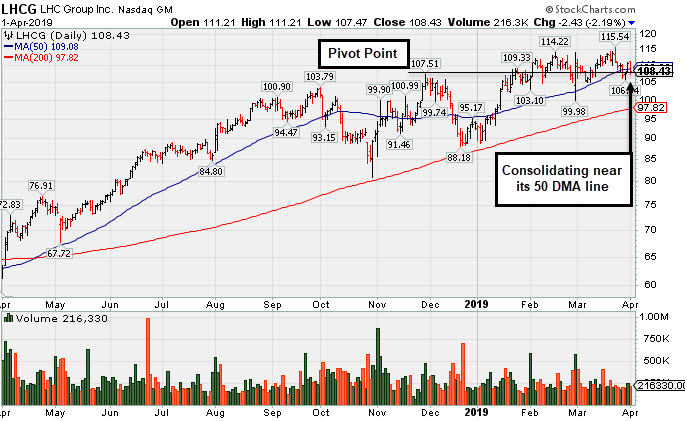
Sputtering Near 50-Day Moving Average Line - Monday, April 1, 2019
L H C Group Inc (LHCG -$2.43 or -2.19% to $108.43) recently found support at its 50-day moving average DMA line ($109.08) but slumped on Monday to end the session below that important short-term average. More damaging losses bellow prior lows would raise greater concerns. Confirming volume-driven gains would be a reassuring sign, since the recent gains above the pivot point were not backed by the at least +40% above average volume necessary to trigger a proper technical buy signal.
The Dec '18 report marked its 4th strong quarterly earnings increase above the +25% minimum guideline (C criteria), continuing its strong track record helping it match with the fact-based investment system's fundamental guidelines. LHCG was highlighted in yellow with pivot point cited based on its 11/29/18 high plus 10 cents in the 1/23/19 mid-day report (read here). It was last shown in this FSU section on 2/21/19 with an annotated graph under the headline, "Recent Gains for New Highs Lacked Great Volume Conviction".
Its annual earnings growth (A criteria) has been strong, and it has a current Earnings Per Share Rating of 97. The number of top-rated funds owning its shares rose from 350 in Mar '18 to 490 in Dec '18, a reassuring sign concerning the I criteria. It has earned a B Timeliness Rating and a B Sponsorship Rating. It has a small supply of only 31.4 million shares (S criteria) outstanding, which can contribute to greater volatility i the event of institutional buying or selling.
Charts courtesy of www.stockcharts.com
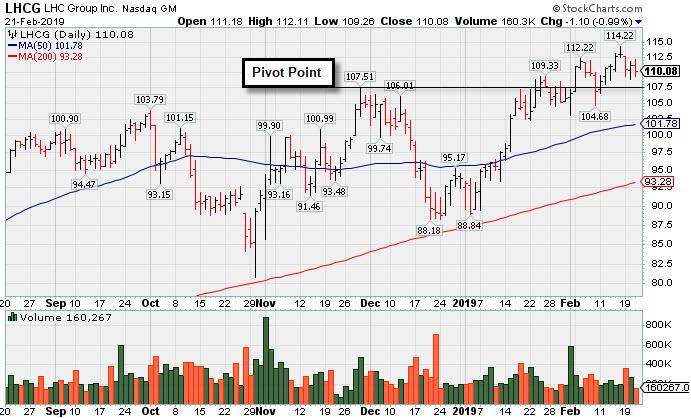
Recent Gains for New Highs Lacked Great Volume Conviction - Thursday, February 21, 2019
L H C Group Inc (LHCG -$1.10 or -0.99% to $110.08) pulled back with light volume today. A recent streak of 5 consecutive gains was marked by below average volume. Confirming volume-driven gains would be a reassuring sign, since the recent gains above the pivot point were not backed by the at least +40% above average volume necessary to trigger a proper technical buy signal. Keep in mind that its next earnings release is due after the market closes on Wednesday, February 27, 2019. Volume and volatility often increase near earnings news.
LHCG was highlighted in yellow with pivot point cited based on its 11/29/18 high plus 10 cents in the mid-day report (read here). It was last shown in this FSU section on 1/23/19 with an annotated graph under the headline, "Healthcare Services Firm Reached a New High".
It found support above its 200 DMA line since noted in the 12/17/18 mid-day report - "The Sep '18 report marked its 3rd strong quarterly earnings increase above the +25% minimum guideline (C criteria), helping it better match with the fact-based investment system's fundamental guidelines."
Its annual earnings growth (A criteria) has been strong, and it has a current Earnings Per Share Rating of 94. The number of top-rated funds owning its shares rose from 350 in Mar '18 to 487 in Dec '18, a reassuring sign concerning the I criteria. It has earned an A Timeliness Rating and a B Sponsorship Rating. It has a small supply of only 31.4 million shares (S criteria) outstanding, which can contribute to greater volatility i the event of institutional buying or selling.
Charts courtesy of www.stockcharts.com
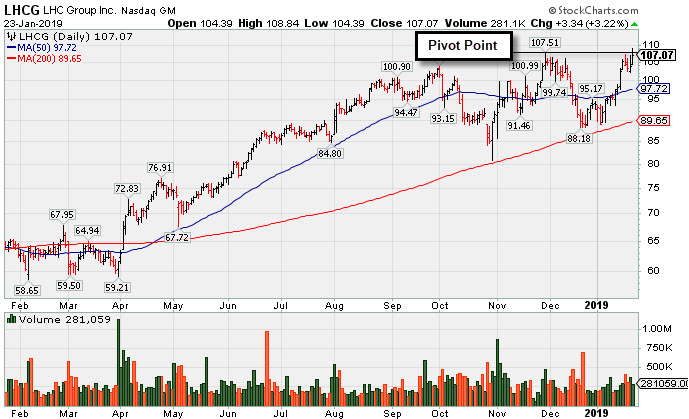
Healthcare Services Firm Reached a New High - Wednesday, January 23, 2019
L H C Group Inc (LHCG +$3.34 or +3.22% to $107.07) was highlighted in yellow with pivot point cited based on its 11/29/18 high plus 10 cents. It hit a new high today after an 8-week cup shaped base. Subsequent gains above the pivot point backed by at least +40% above average volume may trigger a technical buy signal.
It found support above its 200 DMA line since noted in the 12/17/18 mid-day report - "The Sep '18 report marked its 3rd strong quarterly earnings increase above the +25% minimum guideline (C criteria), helping it better match with the fact-based investment system's fundamental guidelines." Its annual earnings growth (A criteria) has been strong, and it has a current Earnings Per Share Rating of 94.
The number of top-rated funds owning its shares rose from 350 in Mar '18 to 484 in Dec '18, a reassuring sign concerning the I criteria. It has earned an A Timeliness Rating and a C Sponsorship Rating. It has a small supply of only 31.4 million shares (S criteria) outstanding, which can contribute to greater volatility i the event of institutional buying or selling.
Charts courtesy of www.stockcharts.com
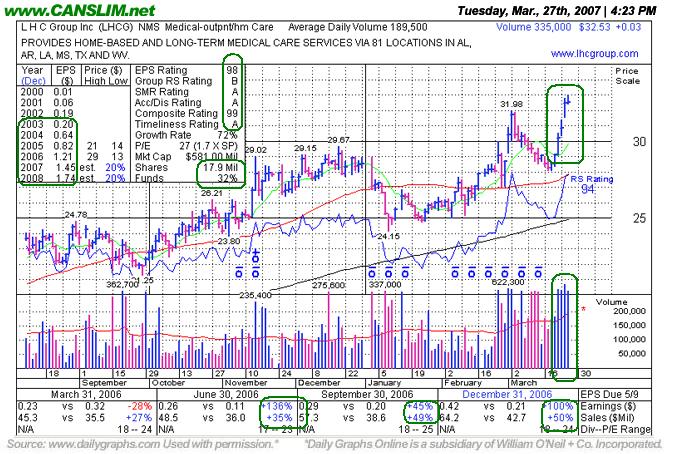
Avoid "Chasing" Stocks Past Pivot By +5% - Tuesday, March 27, 2007
A classic example of the success enjoyed by many CANSLIM.net readers usually starts when an investor reads a CANSLIM.net report and buys a featured stock before it has risen above the pivot point by greater than 5%. After a stock breaks out above its pivot point, there is only a +5% window that investors have to purchase the stock under the proper guidelines. Once a stock rises above the "maximum buy price" the risk of a shake out balloons, meaning that even a normal retracement in the stock might force you to employ the 7-8% loss cutting rule. Much can be told by the stock's daily action in the weeks and months that follow a breakout. Typically, a light volume and orderly pullback suggests that the bulls remain in control. However, high volume pullbacks that violate support paint a totally different picture.
LHC Group, Inc. (LHCG +$0.27 or +0.82% to $32.63) reached a fresh new 52-week high and ended with a small gain on above average volume today. This stock was first featured in the March 2007 edition of CANSLIM.net news (read here) with a $29.77 pivot point and a $31.26 maximum buy price. After its initial breakout, LHCG pulled back without triggering the -8% sell rule and found support above its 50 day moving average. The stock's pullback corresponded with a steep "correction" in the major averages ("M" in CANSLIM). After finding support above its 50 DMA line, this stock has literally rallied on above average volume everyday since the March 21, 2007 follow-through day, a very healthy sign! The bulls returned in force and sent this stock soaring through its maximum buy price as it hit yet another new 52-week high. Now that LHCG is trading above its pivot point by more than 5% it is considered to be too extended from a sound base pattern to be bought under the guidelines. Instead of chasing a stock above its maximum buy price, disciplined investors follow the proper guidelines.
C A N S L I M | StockTalk | News | Chart |  DGO | SEC | Zacks Reports
View all notes | Alert me of new notes | CANSLIM.net Company Profile