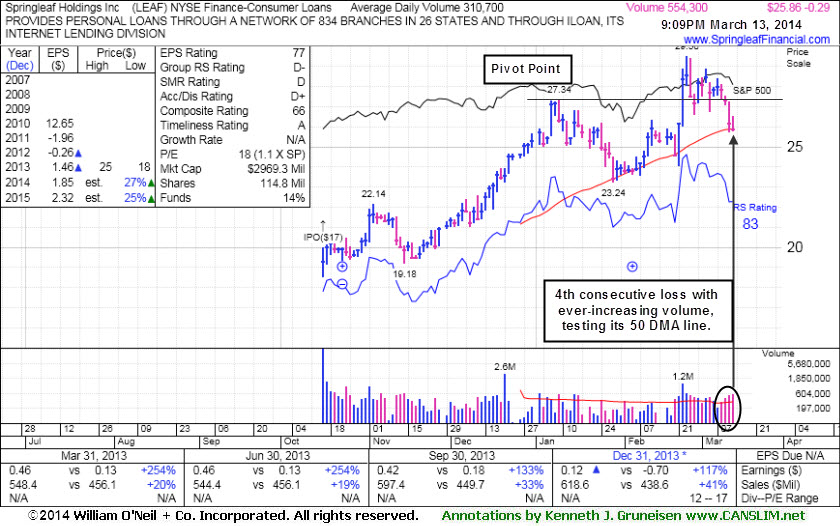
Springleaf Holdings Inc (LEAF -$0.29 on -1.11% to $25.86) has undercut prior highs in the $27 area raising concerns and it tested support at its 50-day moving average (DMA) line with today's damaging 4th consecutive loss on ever-increasing volume. Disciplined investors avoid chasing extended stocks more than +5% above prior highs and always limit losses by selling any stock that falls more than -7% from their purchase price.
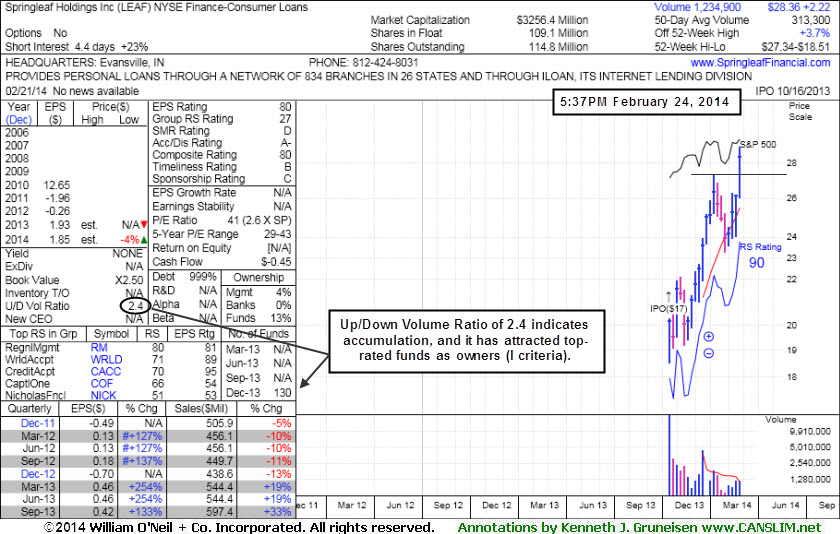
LEAF stalled and made limited headway after last shown in this FSU section on 2/24/14 with annotated graphs under the headline, "Breakout Backed by Four Times Average Volume". It was highlighted in yellow with pivot point cited based on its 1/09/14 high plus 10 cents in the 2/24/14 mid-day report (read here).
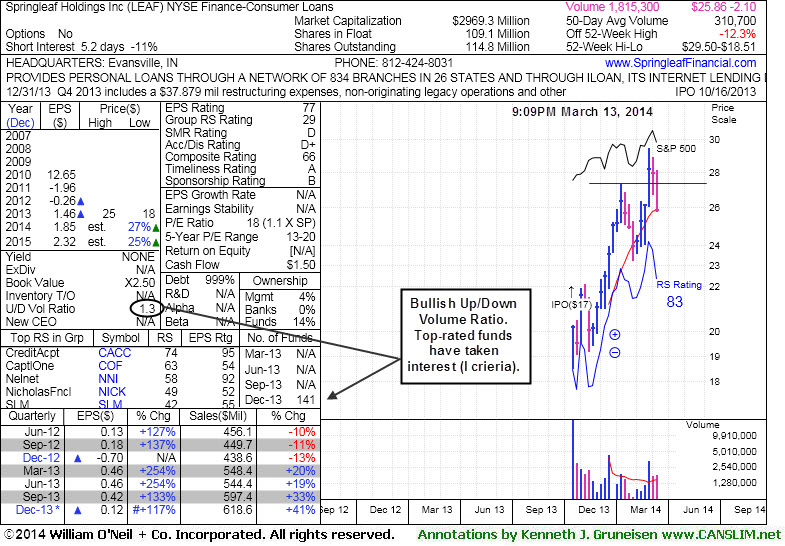
Earnings increases have been above the +25% minimum guideline (C criteria) in the 4 latest quarterly comparisons through Dec '13. Its Up/Down Volume Ratio of 1.3 is an unbiased indication that its shares have been under accumulation over the past 50 days. It has attracted top-rated funds as owners (I criteria).
Earnings increases have been above the +25% minimum guideline (C criteria) in the 3 latest quarterly comparisons through Sep '13. Its Up/Down Volume Ratio of 2.4 is an unbiased indication that its shares have been under accumulation over the past 50 days. Itt has attracted top-rated funds as owners (I criteria).