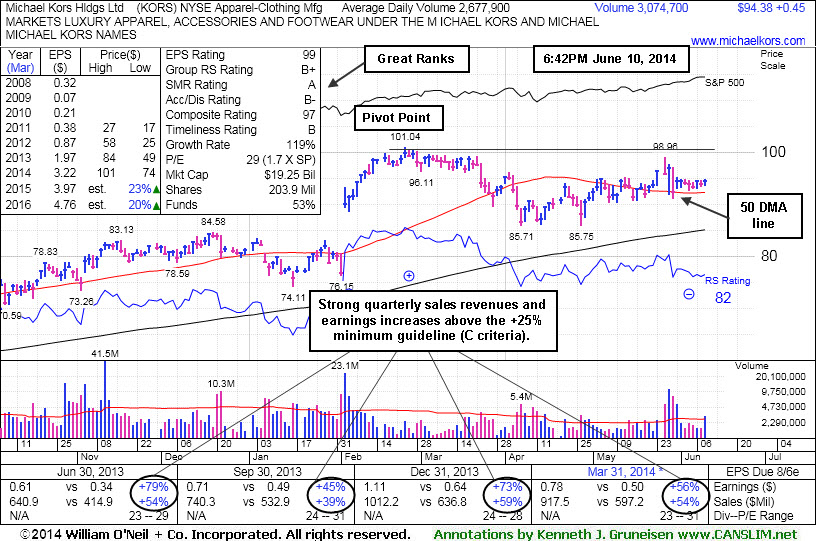
Relative Strength Line's Downward Slope a Discouraging Sign - Tuesday, June 10, 2014
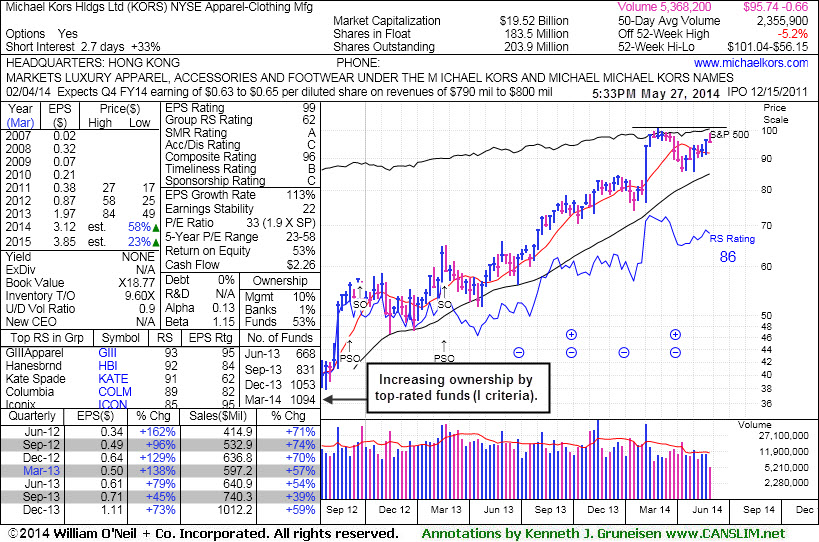
Michael Kors Hldgs Ltd (KORS +$0.45 or +0.48% to $94.38) has still been finding support at its 50-day moving average (DMA) line. Subsequent losses leading to deterioration below that important short-term average would raise more concerns and trigger a technical sell signal. A breakout above the pivot point with at least +40% above average volume is needed to trigger a new technical buy signal.KORS faces some resistance due to overhead supply up through the $101 level. Its Relative Strength ratting of 82 is above the 80+ minimum for buy candidates under the fact-based investment system, however the jagged blue Relative Strength line was higher month ago. Historic studies have shown that most big stock market winners saw their Relative Strength lines hitting new high territory prior to the stock price technically breaking out to new high. Downward slope of its Relative Strength line in recent months is therefore considered a discouraging sign.
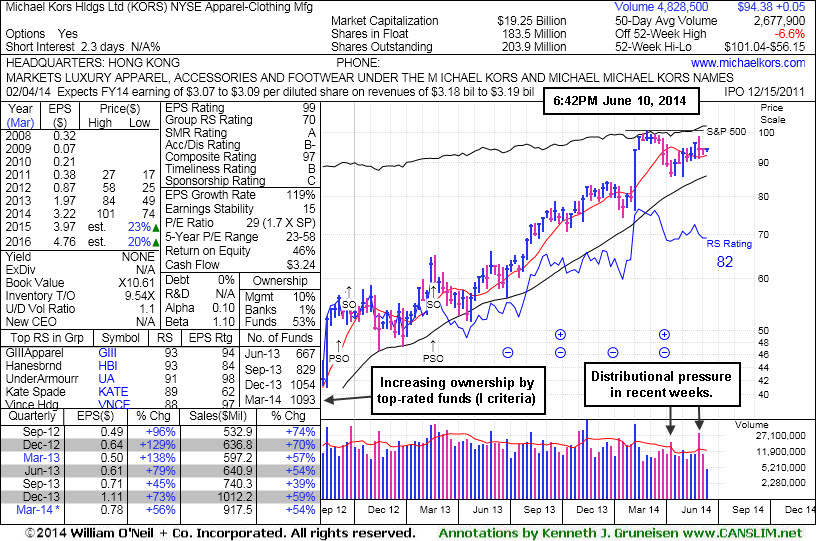
KORS was last shown in this FSU section on 5/27/14 with annotated graphs under the headline, "Earnings News May Prompt Volume and Volatility". On that session it encountered distributional pressure as it erased early gains and finished lower after a "negative reversal". The fact it has found support above its 50-day moving average (DMA) line since is an encouraging sign that institutional owners are still looking at the company with favor. However, damaging deterioration below that important short-term average would raise more serious concerns and trigger a technical sell signal and would hint that institutional owners were turning skeptical.
Fundamentals remain favorable with respect to the fact-based investment system (C and A criteria). This high-ranked Apparel - Clothing Manufacturing firm has headquarters in Hong Kong. It completed Secondary Offerings on 9/25/12 and 2/20/13, each time while perched near its all-time highs. Prior reports noted - "Such offerings often are a short-term hindrance to upward price progress yet typically result in broader institutional ownership interest." The number of top-rated funds owning its shares rose from 668 in Jun '13 to 1,093 in Mar '14, a reassuring sign concerning the I criteria.
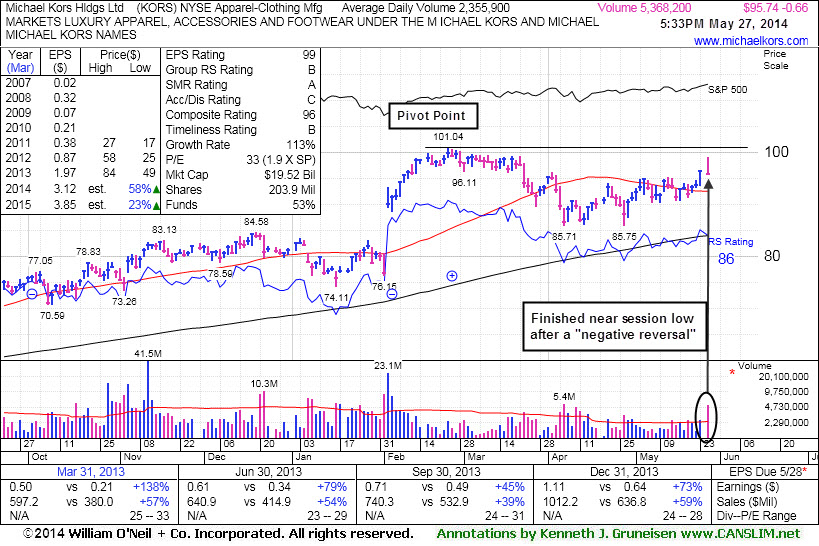
Earnings News May Prompt Volume and Volatility - Tuesday, May 27, 2014
Michael Kors Hldgs Ltd (KORS -$0.66 or -0.68% to $95.74) encountered distributional pressure as it erased early gains and finished lower after a "negative reversal" on Tuesday's session. It was highlighted in yellow with new pivot point cited based on its 2/25/14 high plus 10 cents in the earlier mid-day report (read here). It is due to report earnings for the Mar '14 quarter before the market open on Wednesday. Volume and volatility often increase near earnings news. Members are reminded - "Subsequent volume-driven gains to new highs may trigger a new (or add-on) technical buy signal. Disciplined investors may watch for proof of fresh institutional buying demand and yet avoid chasing stocks more than +5% above prior highs."KORS faces some resistance due to overhead supply up through the $101 level. A breakout above the pivot point with heavy volume is needed to trigger a new technical buy signal. Fundamentals remain favorable with respect to the fact-based investment system (C and A criteria). It found support above its 200-day moving average (DMA) line since dropped from the Featured Stocks list on 4/07/14.
KORS was last shown in this FSU section on 3/27/14 with annotated graphs under the headline, "Fell Below 50-Day Average Line With 6th Consecutive Loss",
as weak action was raising concerns and its color code was changed to green. This high-ranked Apparel - Clothing Manufacturing firm has headquarters in Hong Kong. It completed Secondary Offerings on 9/25/12 and 2/20/13, each time while perched near its all-time highs. Prior reports noted - "Such offerings often are a short-term hindrance to upward price progress yet typically result in broader institutional ownership interest." The number of top-rated funds owning its shares rose from 668 in Jun '13 to 1,094 in Mar '14, a reassuring sign concerning the I criteria.
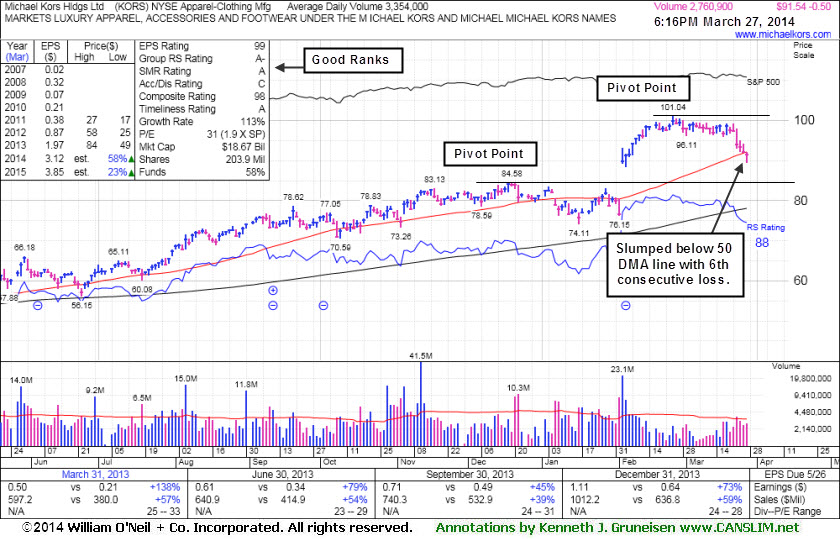
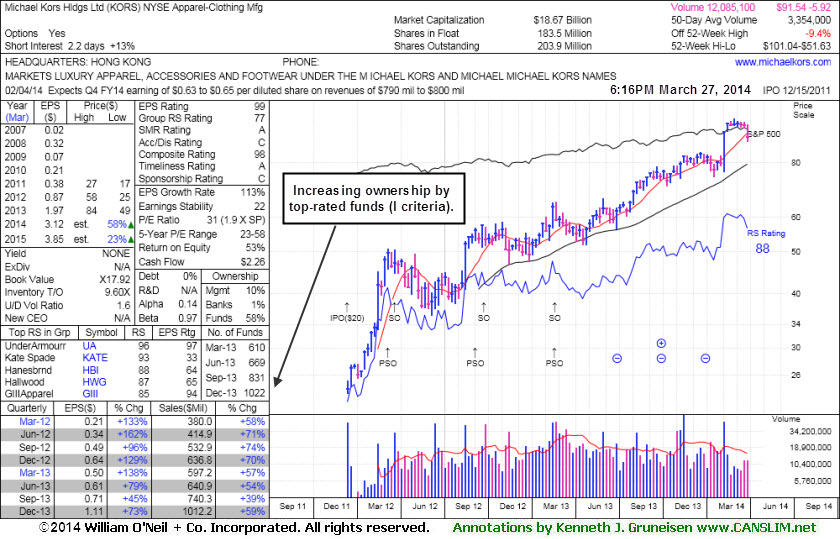
Fell Below 50-Day Average Line With 6th Consecutive Loss - Thursday, March 27, 2014
Michael Kors Hldgs Ltd (KORS -$0.01 or -0.01% to $98.03) lost ground today for a 6th consecutive session and slumped below its 50-day moving average (DMA) line ($92.16) raising concerns and its color code was changed to green. It may likely find support near that short-term average, meanwhile it faces resistance due to overhead supply up through the $101 level. The next level of support that comes into play is at prior highs in the $84 area.KORS did not break out from the advanced "3-weeks tight" base pattern since last appearing in this FSU section on 3/12/14 with annotated graphs under the headline, "Formed Advanced Base Pattern With Volume Totals Cooling". Members were reminded - "Subsequent volume-driven gains to new highs may trigger a new (or add-on) technical buy signal. Disciplined investors may watch for proof of fresh institutional buying demand and yet avoid chasing stocks more than +5% above prior highs."
The company reported +73% earnings on +59% sales revenues for the Dec '13 quarter, continuing its strong earnings history (meeting C and A criteria). This high-ranked Apparel - Clothing Manufacturing firm has headquarters in Hong Kong. It completed Secondary Offerings on 9/25/12 and 2/20/13, each time while perched near its all-time highs. Prior reports noted - "Such offerings often are a short-term hindrance to upward price progress yet typically result in broader institutional ownership interest." The number of top-rated funds owning its shares rose from 326 in Mar '12 to 1,022 in Dec '13, a reassuring sign concerning the I criteria. Its current Up/Down Volume Ratio of 1.6 is an unbiased indication its shares have been under accumulation over the past 50 days.
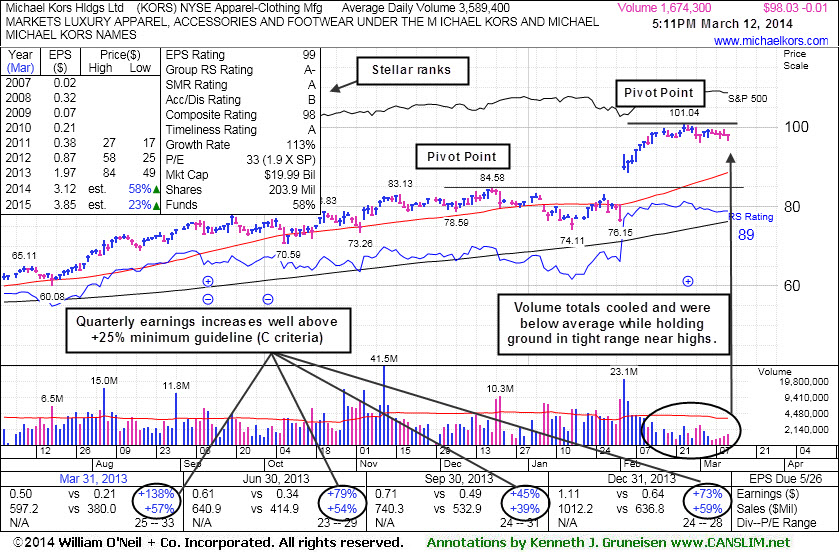
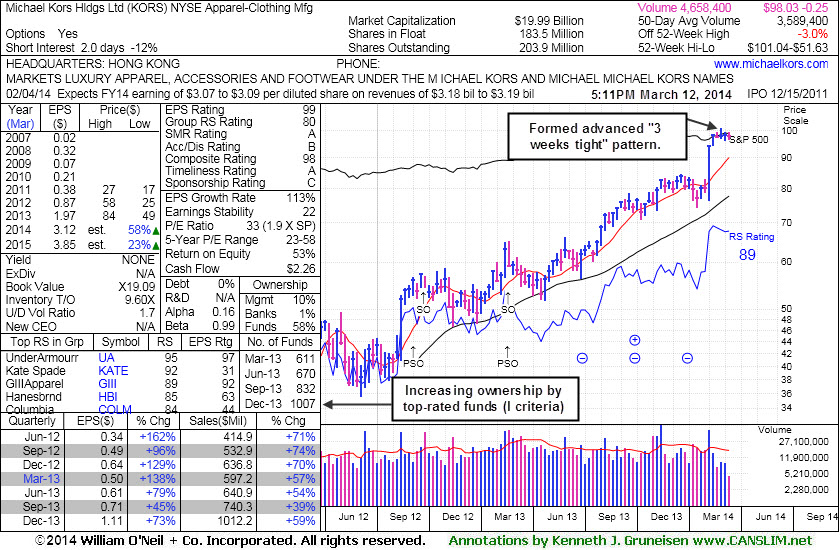
Formed Advanced Base Pattern With Volume Totals Cooling - Wednesday, March 12, 2014
Michael Kors Hldgs Ltd (KORS -$0.01 or -0.01% to $98.03) is still stubbornly holding its ground in a tight range near its 52-week high with volume totals cooling in recent weeks indicating that few investors have headed for the exit. It has formed an advanced "3-weeks tight" base pattern and a new pivot point is cited based on its 2/25/14 high plus 10 cents. Subsequent volume-driven gains to new highs may trigger a new (or add-on) technical buy signal. Disciplined investors may watch for proof of fresh institutional buying demand and yet avoid chasing stocks more than +5% above prior highs.
Its 50-day moving average (DMA) line ($88.60) defines the nearest support above prior highs in the $84 area. It was last shown in this FSU section on 2/19/14 with annotated graphs under the headline, "Extended From Sound Base and Wedging Higher". The company reported +73% earnings on +59% sales revenues for the Dec '13 quarter, continuing its strong earnings history (meeting C and A criteria).
This high-ranked Apparel - Clothing Manufacturing firm has headquarters in Hong Kong. It completed Secondary Offerings on 9/25/12 and 2/20/13, each time while perched near its all-time highs. Prior reports noted - "Such offerings often are a short-term hindrance to upward price progress yet typically result in broader institutional ownership interest." The number of top-rated funds owning its shares rose from 326 in Mar '12 to 1,007 in Dec '13, a reassuring sign concerning the I criteria. Its current Up/Down Volume Ratio of 1.7 is an unbiased indication its shares have been under accumulation over the past 50 days.
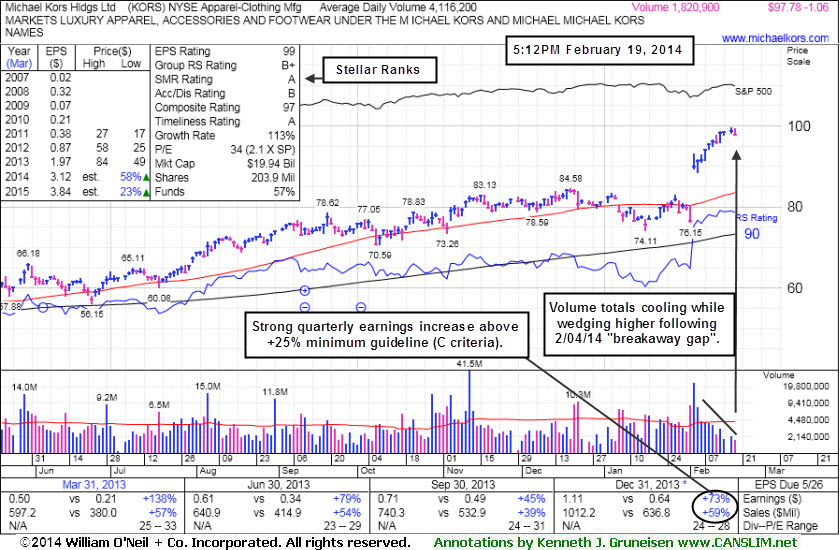
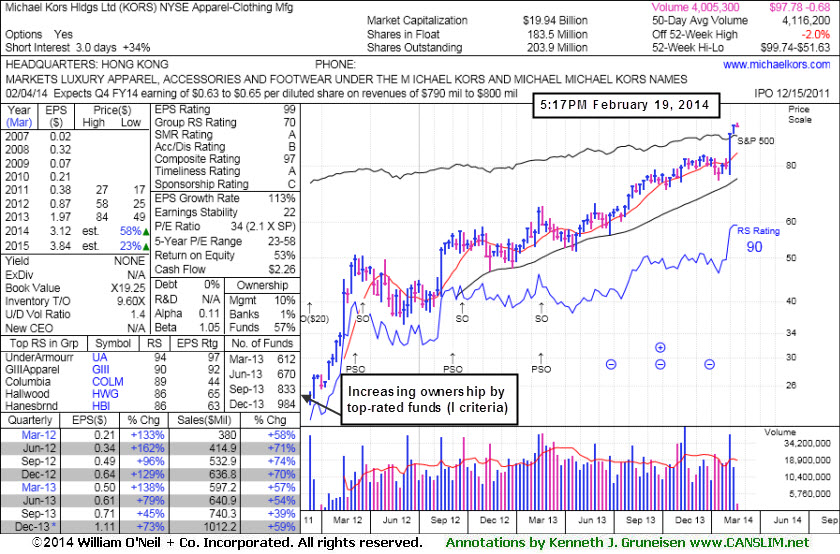
Extended From Sound Base and Wedging Higher - Wednesday, February 19, 2014
Michael Kors Hldgs Ltd (KORS -$1.06 or -1.07% to $97.78) is perched at its 52-week high today, very extended from its prior base. Volume totals have been cooling in recent weeks while wedging higher following its considerable 2/04/14 "breakaway gap". Prior highs in the $84 area define the nearest chart support level. Disciplined investors avoid chasing extended stocks.
KORS gapped up immediately following its last appearance in this FSU section on 2/03/14 with annotated graphs under the headline, "Down on Higher Volume Ahead of Quarterly Earnings Report". The company reported +73% earnings on +59% sales revenues for the Dec '13 quarter, continuing its strong earnings history (meeting C and A criteria). The action demonstrates how fundamental news can sometimes have an immediate and substantial impact on share price.
This high-ranked Apparel - Clothing Manufacturing firm has headquarters in Hong Kong. It completed Secondary Offerings on 9/25/12 and 2/20/13, each time while perched near its all-time highs. Prior reports noted - "Such offerings often are a short-term hindrance to upward price progress yet typically result in broader institutional ownership interest." The number of top-rated funds owning its shares rose from 326 in Mar '12 to 984 in Dec '13, a reassuring sign concerning the I criteria.
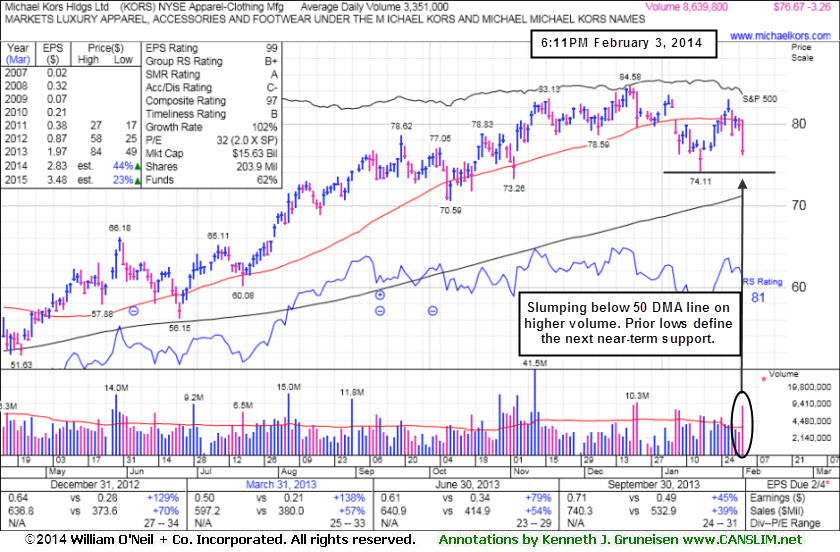
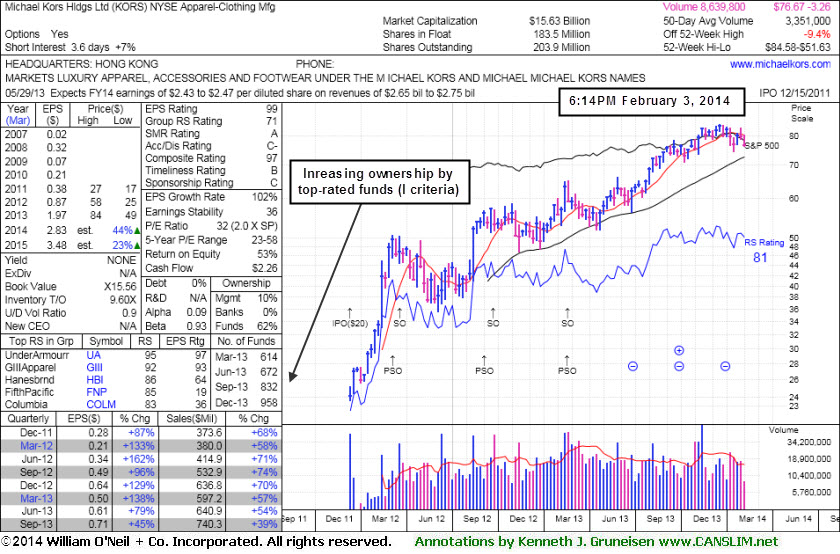
Down on Higher Volume Ahead of Quarterly Earnings Report - Monday, February 03, 2014
Michael Kors Hldgs Ltd (KORS -$3.26 or -4.08% to $76.67) slumped back further below its 50-day moving average (DMA) line today while falling on higher volume, trading toward its prior low ($74.11 on 1/16/14) defining the next important support level. Recent losses on higher volume indicated distributional pressure. The company reports quarterly financial results on Tuesday, February 4, 2014, before the market opens. Volume and volatility often increase near earnings news.
Its last appearance in this FSU section was on 1/09/14 with annotated graphs under the headline, "Technical Deterioration and RS Rating Slump Raises Concerns". It had gapped down on 1/07/14 violating its 50-day moving average (DMA) line and triggering a technical sell signal then suffered an additional damaging loss on above average volume indicating distributional pressure. A later rebound above its 50 DMA line with gains lacking great volume conviction was short-lived before slumping again.
Its Relative Strength rating at 81 is just above the 80+ minimum guideline for buy candidates. Fundamentally, it has maintained high ranks due to its strong earnings history (meeting C and A criteria) including earnings +45% on +39% sales for the Sep '13 quarter. This high-ranked Apparel - Clothing Manufacturing firm has headquarters in Hong Kong.
It completed Secondary Offerings on 9/25/12 and 2/20/13, each time while perched near its all-time highs. Prior reports noted - "Such offerings often are a short-term hindrance to upward price progress yet typically result in broader institutional ownership interest." The number of top-rated funds owning its shares rose from 326 in Mar '12 to 958 in Dec '13, a reassuring sign concerning the I criteria.
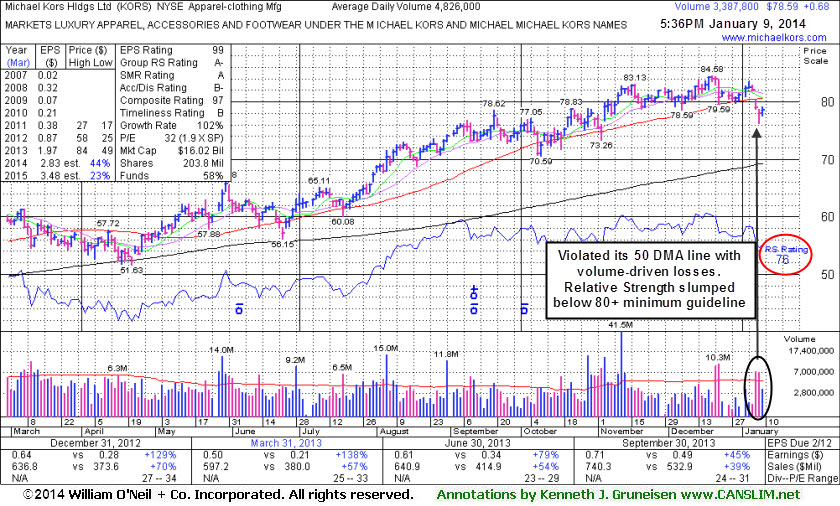
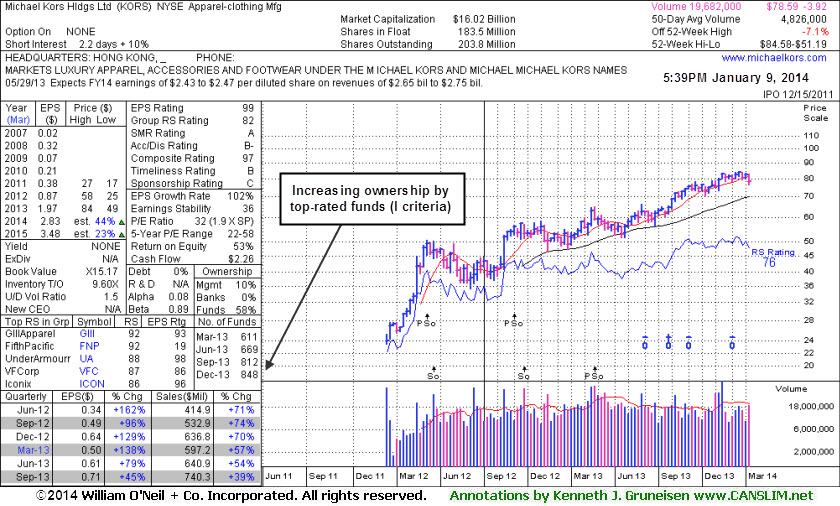
Technical Deterioration and RS Rating Slump Raises Concerns - Thursday, January 09, 2014
Michael Kors Hldgs Ltd (KORS +$0.68 or +0.87% to $78.59) halted its slide today with a small gain on light volume. It gapped down on 1/07/14 violating its 50-day moving average (DMA) line and triggering a technical sell signal then suffered an additional damaging loss on above average volume indicating distributional pressure. It has not formed a new base of sufficient length.Its last appearance in this FSU section was on 12/06/13 with annotated graphs under the headline, "Consolidation Too Brief To Note New Pivot". Prior highs in the $78 area may act as near-term support. Meanwhile, its Relative Strength rating has slumped to 76, below the 80+ minimum guideline for buy candidates. Fundamentally, it has maintained high ranks due to its strong earnings history (meeting C and A criteria) including earnings +45% on +39% sales for the Sep '13 quarter. This high-ranked Apparel - Clothing Manufacturing firm has headquarters in Hong Kong.
It completed Secondary Offerings on 9/25/12 and 2/20/13, each time while perched near its all-time highs. Prior reports noted - "Such offerings often are a short-term hindrance to upward price progress yet typically result in broader institutional ownership interest." The number of top-rated funds owning its shares rose from 326 in Mar '12 to 848 in Dec '13, a reassuring sign concerning the I criteria. Its current Up/Down Volume Ratio of 1.5 is an unbiased indication that its shares have been under slight accumulation over the past 50 days.
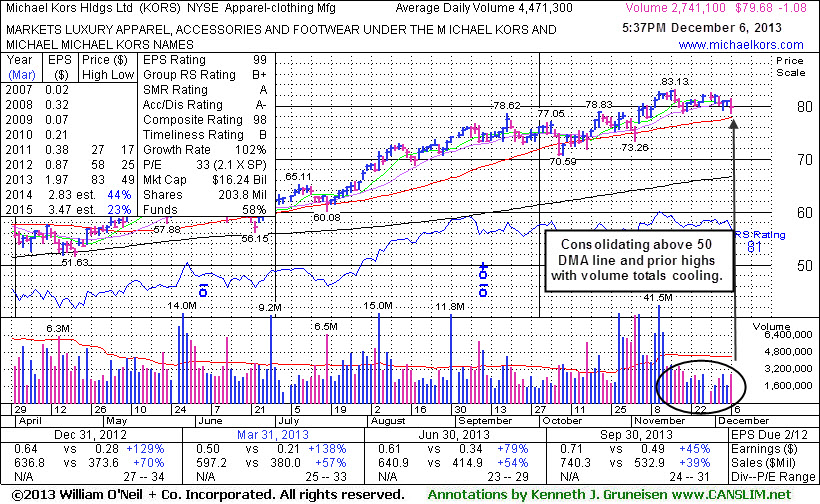
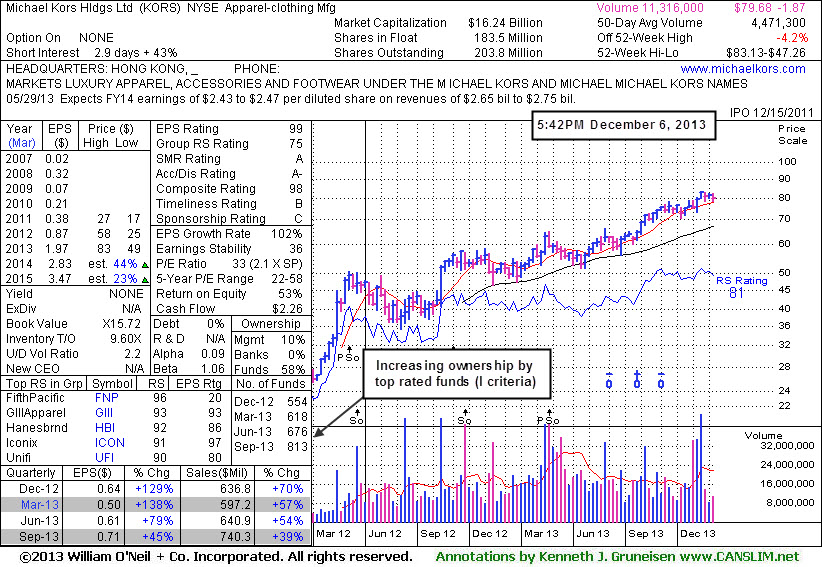
Consolidation Too Brief To Note New Pivot - Friday, December 06, 2013
Michael Kors Hldgs Ltd (KORS -$1.08 or -1.34% to $79.68) has seen volume totals cooling while consolidating above its 50-day moving average (DMA) line. Prior highs in the $78 area coincide, defining very important near-term support along with its 50 DMA line. It has not formed a sound base pattern of sufficient length.Its last appearance in this FSU section was on 11/06/13 with an annotated graph under the headline, "Hitting New Highs After Choppy Consolidation". Its Relative Strength rating is currently 81, just above the 80+ minimum guideline for buy candidates. Fundamentally, it has maintained high ranks due to its strong earnings history (meeting C and A criteria) including earnings +45% on +39% sales for the Sep '13 quarter just reported. This high-ranked Apparel - Clothing Manufacturing firm has headquarters in Hong Kong. It completed Secondary Offerings on 9/25/12 and 2/20/13, each time while perched near its all-time highs. Prior reports noted - "Such offerings often are a short-term hindrance to upward price progress yet typically result in broader institutional ownership interest."
The number of top-rated funds owning its shares rose from 326 in Mar '12 to 813 in Sep '13, a reassuring sign concerning the I criteria. Its current Up/Down Volume Ratio of 2.2 is an unbiased indication that its shares have been under slight accumulation over the past 50 days.
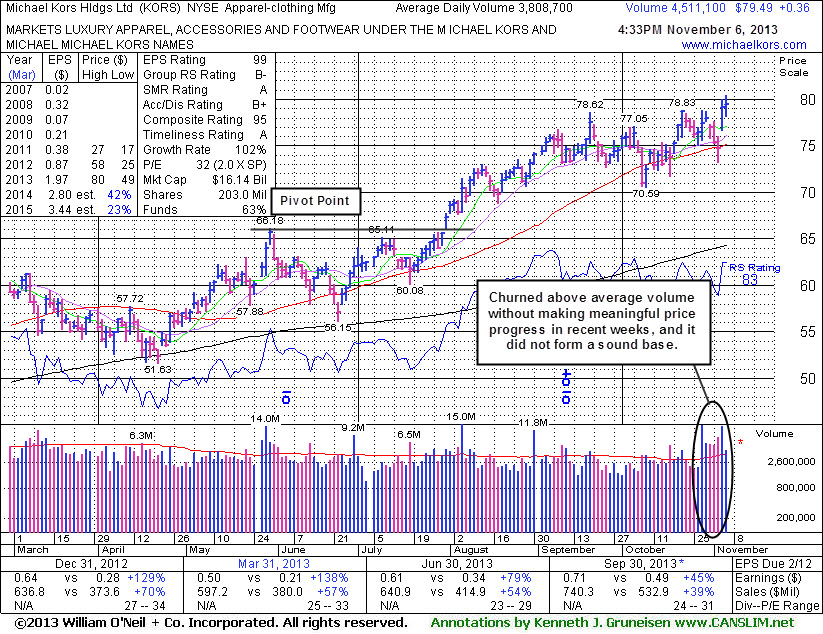
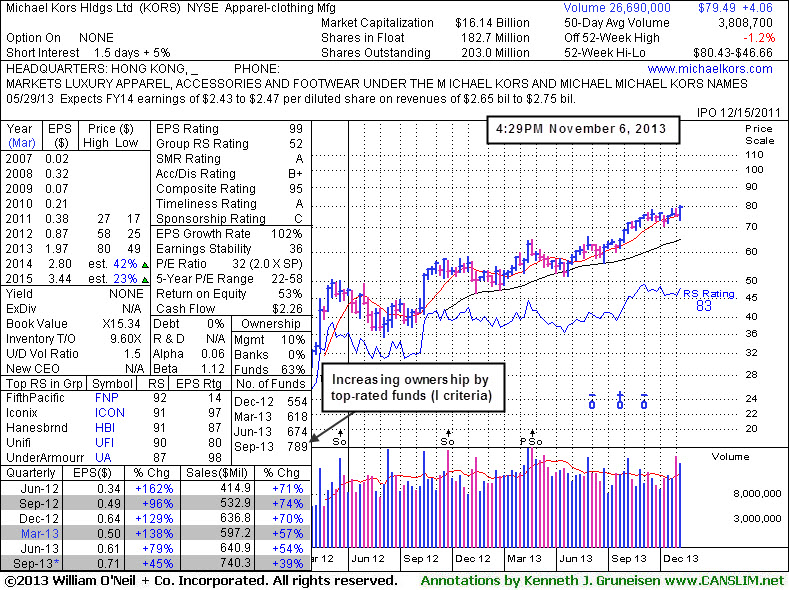
Hitting New Highs After Choppy Consolidation - Wednesday, November 06, 2013
Michael Kors Hldgs Ltd (KORS +$0.46 or +0.62% to $75.55) inched higher today. It gapped up and rallied above prior highs in the $78 area with more than 3 times average volume behind Tuesday's considerable gain for a new 52-week high. However, it has not formed a sound base pattern and it churned above average volume in recent weeks while not making meaningful price progress above prior highs. It slumped below prior highs in the $78 area and briefly violated its 50-day moving average (DMA) line intra-day on 11/04/13 when enduring recent distributional pressure. Its last appearance in this FSU section was on 9/27/13 with an annotated graph under the headline, "Extended From Base After Additional Volume-Driven Gains".Its Relative Strength rating is currently 83, above the 80+ minimum guideline for buy candidates. Fundamentally, it has maintained high ranks due to its strong earnings history (meeting C and A criteria) including earnings +45% on +39% sales for the Sep '13 quarter just reported. This high-ranked Apparel - Clothing Manufacturing firm has headquarters in Hong Kong. It completed Secondary Offerings on 9/25/12 and 2/20/13, each time while perched near its all-time highs. Prior reports noted - "Such offerings often are a short-term hindrance to upward price progress yet typically result in broader institutional ownership interest."
The number of top-rated funds owning its shares rose from 326 in Mar '12 to 789 in Sep '13, a reassuring sign concerning the I criteria. Its current Up/Down Volume Ratio of 1.5 is an unbiased indication that its shares have been under slight accumulation over the past 50 days.
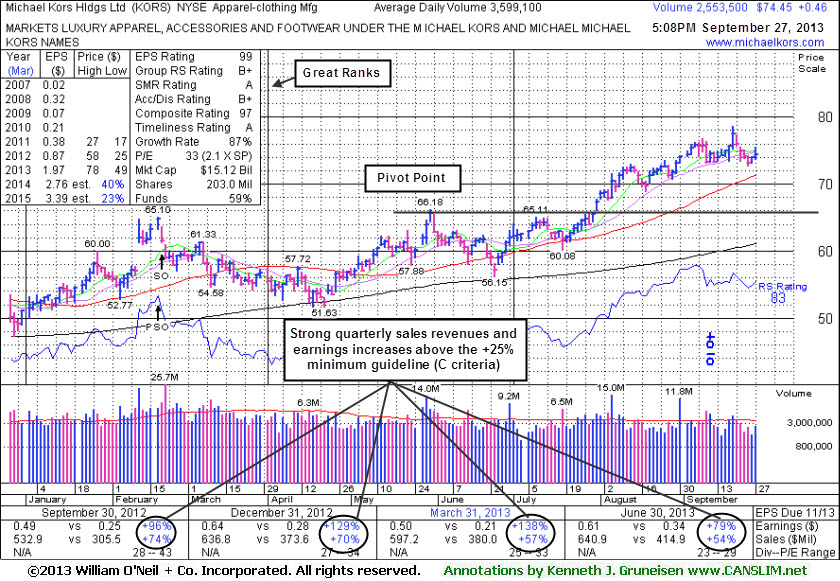
Extended From Base After Additional Volume-Driven Gains - Friday, September 27, 2013
Michael Kors Hldgs Ltd (KORS +$0.46 or +0.62% to $75.55) is extended from its prior base and consolidating near its 52-week high. Its 50-day moving average (DMA) line (now $71.33) defines initial support above prior highs in the $66 area. It was last shown in this FSU section on 8/29/13 with an annotated graph under the headline, "Finished at Best-Ever Close With Gain on Light Volume". The heavy volume behind subsequent gains into new high territory was a clear sign of institutional buying demand.
Its Relative Strength rating is currently 83, above the 80+ minimum guideline for buy candidates. Fundamentally, it has maintained high ranks due to its strong earnings history (meeting C and A criteria) including earnings +79% on +54% sales for the Jun '13 quarter just reported. This high-ranked Apparel - Clothing Manufacturing firm has headquarters in Hong Kong. It completed Secondary Offerings on 9/25/12 and 2/20/13, each time while perched near its all-time highs. Prior reports noted - "Such offerings often are a short-term hindrance to upward price progress yet typically result in broader institutional ownership interest."
The number of top-rated funds owning its shares rose from 326 in Mar '12 to 681 in Jun '13, a reassuring sign concerning the I criteria. Its current Up/Down Volume Ratio of 2.0 is an unbiased indication that its shares have been under slight accumulation over the past 50 days.
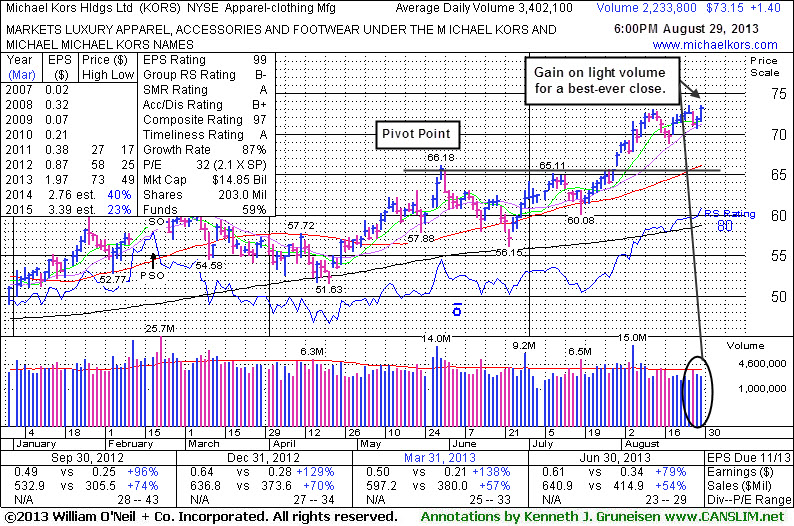
Finished at Best-Ever Close With Gain on Light Volume - Thursday, August 29, 2013
Michael Kors Hldgs Ltd (KORS +$1.40 or +1.95% to $73.15) posted a small gain for a best-ever close. It is extended from any sound base, and the broader market (M criteria) weakness also is an overriding concern that currently argues against new buying efforts in stocks until a new confirmed rally is noted.
Prior highs in the $66 area define support to watch on pullbacks. It held its ground stubbornly since last shown in this FSU section on 8/06/13 with an annotated graph under the headline, " Four Times Average Volume Behind Rally to New Highs", as it hit 52-week and all-time highs with a considerable gain backed by 4 times average. The heavy volume was noted as a clear sign of institutional buying demand.
Its Relative Strength rating is currently 80, right at the 80+ minimum guideline for buy candidates. Fundamentally, it has maintained high ranks due to its strong earnings history (meeting C and A criteria) including earnings +79% on +54% sales for the Jun '13 quarter just reported.
This high-ranked Apparel - Clothing Manufacturing firm has headquarters in Hong Kong. It completed Secondary Offerings on 9/25/12 and 2/20/13, each time while perched near its all-time highs. Prior reports noted - "Such offerings often are a short-term hindrance to upward price progress yet typically result in broader institutional ownership interest."
The number of top-rated funds owning its shares rose from 326 in Mar '12 to 657 in Jun '13, a reassuring sign concerning the I criteria. Its current Up/Down Volume Ratio of 2.0 is an unbiased indication that its shares have been under slight accumulation over the past 50 days.
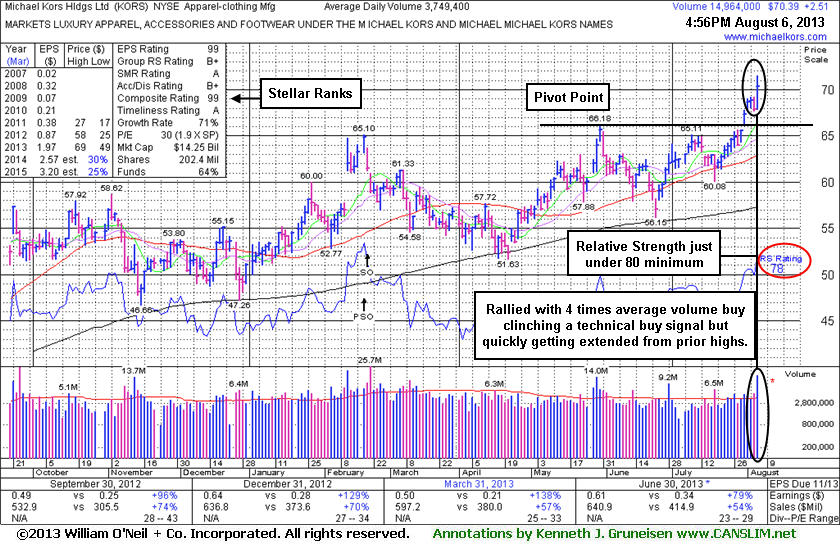
Four Times Average Volume Behind Rally to New Highs - Tuesday, August 06, 2013
Michael Kors Hldgs Ltd (KORS +$2.51 or +3.70% to $70.39) hit new 52-week and all-time highs with today's considerable gain backed by 4 times average volume clinching a technical buy signal while quickly rallying to a finish above its "max buy" level. It was highlighted in yellow with pivot point based on its 5/30/13 high plus 10 cents in the earlier mid-day report (read here). Recent gains lacked great volume conviction, however the heavy volume today was a clear sign of institutional buying demand.Any stock that is sold can always be bought back later if strength returns, however disciplined investors avoid chasing stocks more than +5% above prior highs since this increases the risk an ordinary pullback may trigger the strict sell rule if it subsequently drops more than -7% below their purchase price. KORS found support near its 200-day moving average (DMA) line during its consolidation since dropped from the Featured Stocks list on 4/02/13. It showed bullish action in recent months but encountered stubborn resistance in the $65-66 area. Its Relative Strength rating is currently 78, slightly below the 80+ minimum guideline for buy candidates. Fundamentally, it has maintained high ranks due to its strong earnings history (meeting C and A criteria) including earnings +79% on +54% sales for the Jun '13 quarter just reported.
This high-ranked Apparel - Clothing Manufacturing firm has headquarters in Hong Kong. It has traded up considerably from its 12/15/11 IPO priced at $20. It was last shown in this FSU section on 3/08/13 with an annotated graph under the headline, "Following Another Secondary Offering Relative Strength Rank Has Slumped". It completed Secondary Offerings on 9/25/12 and 2/20/13, each time while perched near its all-time highs. Prior reports noted - "Such offerings often are a short-term hindrance to upward price progress yet typically result in broader institutional ownership interest." The number of top-rated funds owning its shares rose from 326 in Mar '12 to 653 in Jun '13, a reassuring sign concerning the I criteria. Its current Up/Down Volume Ratio of 1.7 is an unbiased indication that its shares have been under slight accumulation over the past 50 days.
Following Another Secondary Offering Relative Strength Rank Has Slumped - Friday, March 08, 2013
Michael Kors Hldgs Ltd (KORS -$0.02 or -0.03% to $58.19) is consolidating below its "max buy" level and near prior highs in the $58 area which define important support above its 50-day moving average (DMA) line (now $56.41). It completed another Secondary Offering 2/20/13 while perched near its all-time high. Such offerings often are a short-term hindrance to upward price progress yet typically result in broader institutional ownership interest. It was last in this FSU section on 2/07/13 with an annotated graph under the headline, " Base Building Continues After Positive Reversal Near 50 Day Average. This high-ranked Apparel - Clothing Manufacturing firm has headquarters in Hong Kong. It cleared the stubborn resistance with a "breakaway gap" on 2/12/13 but encountered distributional pressure soon thereafter and it has almost completely negated the technical breakout. Healthy stocks do not typically fall more than -7% below their pivot point in a bullish market environment, so members are cautioned to watch out if damage starts to mount.
Its strong quarterly and annual earnings history (C and A criteria) meet the fundamental guidelines of the fact-based investment system. It has traded up considerably from its 12/15/11 IPO priced at $20. The number of top-rated funds owning its shares rose from 326 n Mar '12 to 542 in Dec '12, a reassuring sign concerning the I criteria. Its current Up/Down Volume Ratio of 1.2 is an unbiased indication that its shares have been under slight accumulation over the past 50 days. However, its Relative Strength Rating has slumped to 75 (see red circle) below the 80+ minimum guideline for buy candidates.

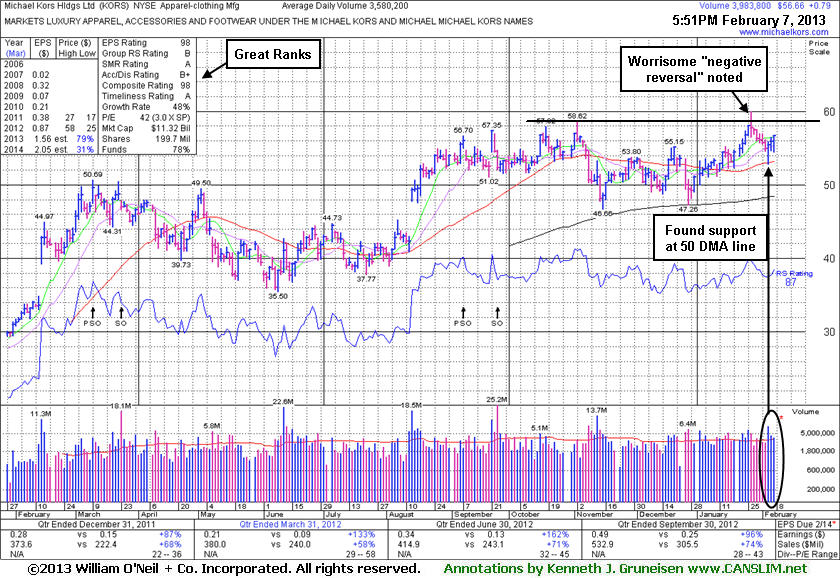
Base Building Continues After Positive Reversal Near 50 Day Average - Thursday, February 07, 2013
Michael Kors Hldgs Ltd (KORS +$0.79 or +1.41% to $56.66) managed an impressive "positive reversal" with a gain on heavy volume after a weak start on 2/05/13 as it tested and found prompt support at its 50-day moving average (DMA) line following 6 consecutive losses. It had slumped since a noted "negative reversal" after touching a new 52-week high on 1/28/13. It was previously noted repeatedly with caution - "Disciplined investors may watch for volume-driven gains above the pivot point to trigger a proper technical buy signal before taking action."KORS was last shown in this FSU section on 1/23/13 with an annotated weekly graph under the headline, "High-Ranked Luxury Apparel Firm Worthy For Watchlist". This high-ranked Apparel - Clothing Manufacturing firm headquartered in Hong Kong met stubborn resistance and failed to close above the pivot point cited based on its 11/02/12 high plus 10 cents and, instead, it encountered distributional pressure.
Its strong quarterly and annual earnings history (C and A criteria) meet the fundamental guidelines of the fact-based investment system. It has traded up considerably from its 12/15/11 IPO priced at $20. The number of top-rated funds owning its shares rose from 328 n Mar '12 to 521 in Dec '12, a reassuring sign concerning the I criteria. Its current Up/Down Volume Ratio of 1.4 is an unbiased indication that its shares have been under accumulation over the past 50 days.
The graph below shows its current base still being built. As previously noted - "It could spend more time base building. There is no advantage gained by jumping in 'early' before definitive proof of meaningful new buying demand from the institutional crowd, yet it is an ideal candidate for investors to have on their watchlist until a decisive breakout might warrant action."
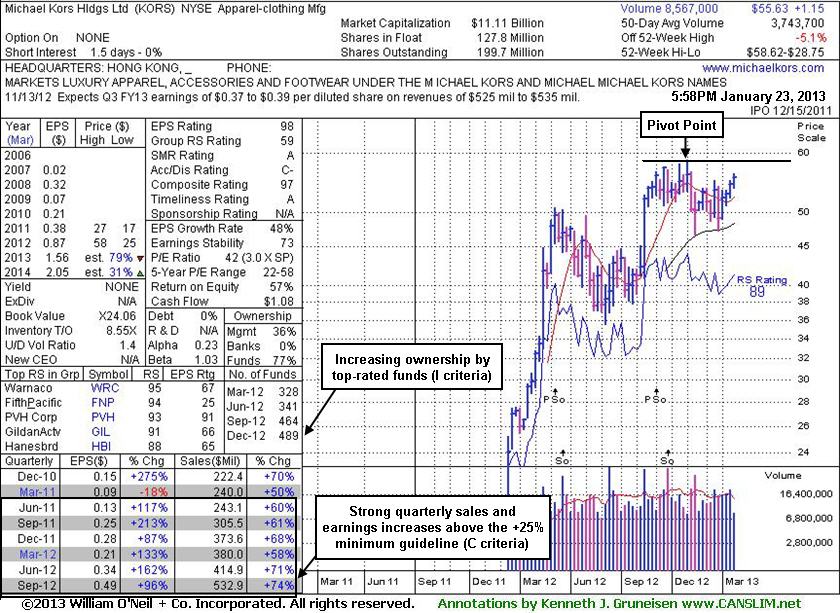
High-Ranked Luxury Apparel Firm Worthy For Watchlist - Wednesday, January 23, 2013
Often, when a leading stock is setting up to breakout of a solid base it is highlighted in CANSLIM.net's Mid-Day Breakouts Report. Sometimes stocks are highlighted shortly after a technical breakout, yet while the potential buy candidate may still be considered action-worthy. The most relevant factors are noted in the report which alerts prudent CANSLIM oriented investors to place the issue in their watch list. After doing any necessary backup research, the investor is prepared to act after the stock triggers a technical buy signal (breaks above its pivot point on more than +50% average turnover) but before it gets too extended from a sound base. In the event the stock fails to trigger a technical buy signal and its price declines then it will simply be removed from the watch list. Disciplined investors know to buy as near as possible to the pivot point and avoid chasing stocks after they have rallied more than +5% above their pivot point. It is crucial to always limit losses whenever any stock heads the wrong direction, and disciplined investors sell if a struggling stock ever falls more than -7% from their purchase price.
Michael Kors Hldgs Ltd (KORS +$0.68 or +1.24% to $55.63) was highlighted in yellow with pivot point cited based on its 11/02/12 high plus 10 cents in the earlier mid-day report (read
here). It is on track for its 4th consecutive weekly gain and perched within -5.1% striking distance of its 52-week high. Disciplined investors may watch for volume-driven gains above the pivot point to trigger a proper technical buy signal before taking action. Currently it is consolidating above its downward sloping 50-day moving average (DMA) line and it recently encountered distributional pressure. This high-ranked Apparel - Clothing Manufacturing firm headquartered in Hong Kong met stubborn resistance in the $57 area and then tested support at its 200 DMA line in the months after pricing another Secondary Offering on 9/25/12. An earlier Secondary Offering was completed on 3/23/12.Its strong quarterly and annual earnings history (C and A criteria) meet the fundamental guidelines of the fact-based investment system. It has traded up considerably from its 12/15/11 IPO priced at $20. The number of top-rated funds owning its shares rose from 328 n Mar '12 to 429 in Dec '12, a reassuring sign concerning the I criteria. Its current Up/Down Volume Ratio of 1.4 is an unbiased indication that its shares have been under accumulation over the past 50 days. The weekly graph below shows its current base still being built, and it could spend more time base building. There is no advantage gained by jumping in "early" before definitive proof of meaningful new buying demand from the institutional crowd, yet it is an ideal candidate for investors to have on their watchlist until a decisive breakout might warrant action.