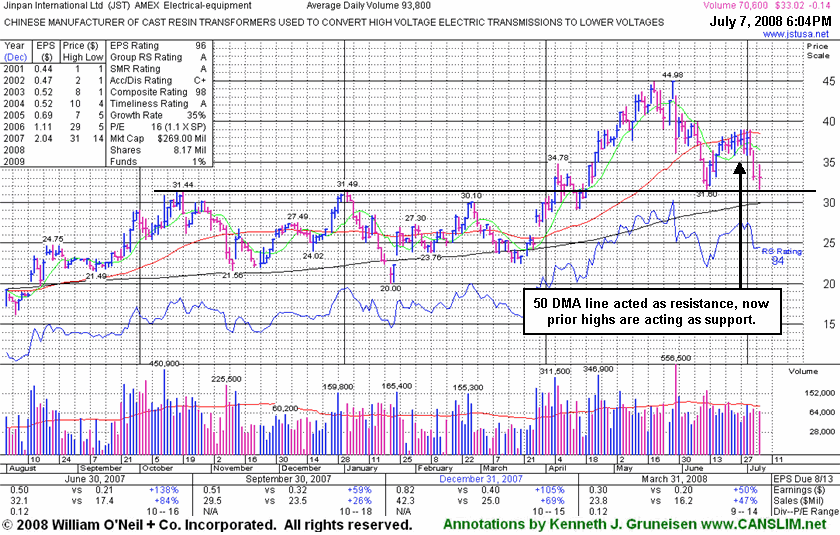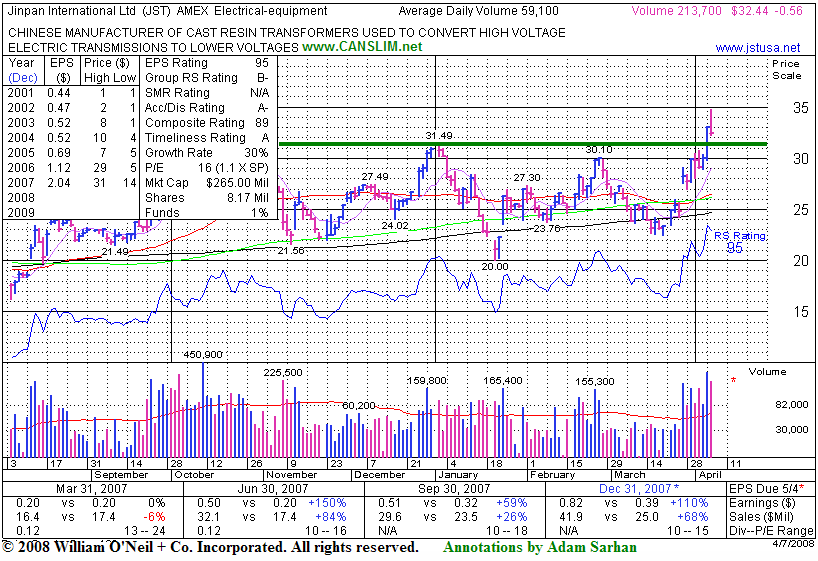
A very important technical tool that savvy investors have learned to incorporate in their technical analysis is the 50-day moving average (DMA) line. The 50 DMA line plays a pivotal role relative to a stock's price. If the price of a stock is above its 50 DMA then odds are that its 50 DMA will act as formidable support. Conversely, if the price is below its 50 DMA then the moving average acts as resistance. Healthy stocks sometimes trade under their 50 DMA lines briefly, but usually a strong candidate will promptly bounce and repair a 50 DMA violation. When a stock has violated its 50 DMA line and then lingers beneath it, the stock's outlook gets worse and worse as it spends a greater period of time trading under that important short-term average line. Once the 50 DMA line starts sloping downward it should also be acknowledged that the stock has been struggling for a while, and it might be time to reduce exposure and look for places to put that money to work in stronger buy candidates.
Jinpan International Ltd. (JST -$0.14 or -0.42% to $33.02) ended in the lower half of its intra-day range after recently encountering resistance at its 50 DMA line. It found support in the $31 area a couple of weeks earlier, near prior chart highs that were once a stubborn resistance level. Weakness leading to closes back under its old chart highs would raise more serious concerns and trigger another technical sell signal. JST still sports strong ranks; its Earnings Per Share (EPS) rating is 96 and Relative Strength (RS) rating is 94. This stock was first featured on Thursday, October 11, 2007 in the CANSLIM.net Mid Day Breakouts Report (read here) with a $29.10 pivot point and a $30.56 maximum buy price and the following note: "Y - Hitting new highs with volume approaching 4 times its average daily total as it rises from a 9-month cup-with-handle type base pattern. It has decent ranks and a solid annual and quarterly sales and earnings growth history with but one flaw - its March '07 earnings comparison was flat with lower sales." Since then, the stock rallied +52.11% before recently pulling back and violating its 50 DMA line. Since that violation, that important short-term average has acted as a formidable area of resistance. JST would need to close above its 50 DMA line for its outlook to improve, and it should remain on an active watch list until the technical damage is repaired.
C A N S L I M | StockTalk | News | Chart | SEC | Zacks Reports | ![]()
![]()
![]()

View all notes | Alert me of new notes | CANSLIM.net Company Profile
Jinpan International Ltd. (JST -$0.56 or -1.76% to $32.44) negatively reversed today and closed in the lower half of its range for a loss on above average volume, yet a lower volume total than the prior session. The negative reversal raises some concerns, but it was still its second best close of all-time. A failure into the prior base would be far more worrisome action. Last week it triggered a fresh technical buy signal, and CANSLIM.net members who signed up to be alerted of new notes (which is included for free with a CANSLIM.net membership) on Jinpan were made aware of the noteworthy action on Friday when a note was published in the middle of the trading session. Otherwise, active CANSLIM.net members saw the latest note also included in the latest "Featured Stock Update" section's table (immediately below this portion). Monday's note read, "G - Gapped up today and rallied to a new all-time high with volume running at an above average pace behind the gains. Color code is changed to green as it has risen beyond its max buy level. Considerable gains on 4/04/08 with more than 3 times average volume helped it rise above its pivot point and clear all prior chart resistance in the $30-31 area. The strong action confirmed a new technical buy signal. Previous bullish action was noted during its base as it gapped up on 3/27/08 above its 50 DMA line with nearly 4 times average volume when reporting strong quarterly sales revenues and earnings increases for the fourth quarter ended December 31, 2007. Its small supply of shares and light trading volumes could lead dramatic price volatility, especially if the institutional crowd rushes in or out. Just featured in the March 2008 CANSLIM.net News with detailed technical information and an annotated chart (read here)." The bulls remain in control as long as JST does not trade below its recent highs which would technically negate its latest breakout and raise concerns.
C A N S L I M | StockTalk | News | Chart | SEC | Zacks Reports | ![]()
![]()
![]()

View all notes | Alert me of new notes | CANSLIM.net Company Profile
|
Jinpan International Ltd |
||
|
Ticker Symbol: JST |
Industry Group: Diversified Electronics |
Shares Outstanding: 8,170,000 |
|
Price: $27.42 (2/29/2008 close) |
Day's Volume: 29,700 (02/29/08 close) |
Shares in Float: 4,740,000 |
|
52 Week High: $31.49 1/02/08 |
50-Day Average Volume: 60,000 |
Up/Down Volume Ratio: 1.2 |
|
Pivot Point: $31.59 1/02/08 high plus .10 |
Pivot Point +5% = Max Buy Price: $33.17 |
Web Address: http://www.jstusa.net |
C A N S L I M | StockTalk | News | Chart | SEC | Zacks Reports | ![]()
![]()
![]()
View all notes | Alert me of new notes | CANSLIM.net Company Profile
CANSLIM.net Company Profile: Jinpan International Ltd., an investment holding company, engages in the design, manufacture, and sale of cast resin transformers for voltage distribution equipments in the People's Republic of China. The company's products enable high voltage transmissions of electricity to be distributed to various locations in lower voltages by their insulation systems. The company's products are used in residential, commercial, and industrial facilities. Jinpan International sells its products primarily in the People's Republic of China and the United States. The company was founded in 1993 and is headquartered in Haikou, the People's Republic of China. It hails from the Electrical - Equipment which is presently ranked 59th on the 197 Industry Groups list, and while that places it outside of the much-preferred top quartile of groups, strength in other high-ranked leaders including Harbin Electric Inc (HRBN), AZZ Incorporated (AZZ), and Enersys (ENS) helps provide confirming leadership to satisfy the L criteria. The number of top-rated funds with an ownership interest has grown from 47 funds in March ‘07 to 52 funds as of December '07, a sign of increasing institutional interest (the I criteria). It has a good annual earnings history (good A criteria) without any downturns. Strong quarterly earnings and sales revenues increases in 7 of its 8 most recent quarters have been well above the +25% guideline to satisfy the C criteria. Management owns a 42% interest in its shares, keeping directors focused on building and maintaining shareholder value.
What to Look For and What to Look Out For: Its small supply of shares and light trading volumes could lead dramatic price volatility, especially if the institutional crowd rushes in or out. Look for the stock to confirm a new technical buy signal by breaking out above its $31.59 pivot point with gains on heavy volume in the coming days and weeks. Remember that buyable breakouts require three important components: the stock must clear its pivot point with considerable gains, those gains must be backed by at least +50% above average volume, and the overall market environment must also be healthy. Much of JST's success will depend on the broader market's ability to sustain a meaningful rally, otherwise 3 out of 4 stocks are likely to struggle. As always, it is of the utmost importance to sell a stock if it drops 7-8% below your purchase price. Deterioration under its 50-day moving average (DMA) line, or worse, its 200 DMA line, would raise concerns and trigger technical sell signals.
Technical Analysis:
This stock has spent the past 6 months basing in the $20-31 range. JST was first featured on Thursday, October 11, 2007 in the CANSLIM.net Mid Day Breakouts Report (read here), and featured again in the January 2, 2008 CANSLIM.net Mid Day Breakouts Report (read here). However, each time it encountered serious resistance in the $31 area and fell back under its 50 DMA line before recovering again. If it is to eventually run up for great gains it must first clear all remaining resistance due to overhead supply. Disciplined investors avoid the temptation to get in "early" before a proper technical buy signal is triggered.Volume is a vital component of technical analysis. Prudent investors that incorporate volume into their stock analysis have often benefited several fold. Ideally, healthy stocks will more often tend to rise on higher volume and pullback on lighter volume. Volume is a great proxy for institutional sponsorship. Conversely, high volume declines can be an ominous, as this usually signals distribution and further price deterioration are more likely to follow.
Jinpan International Ltd. (JST +$0.67 or +2.49% to $27.60) surged to a fresh all-time high with a gain backed by more than six times its average daily volume, but it reversed to close under its pivot point after its earlier appearance in yellow in the CANSLIM.net Mid-Day Breakouts Report (read here) where it was noted, "Hitting new highs with volume approaching 4 times its average daily total as it rises from a 9-month cup-with-handle type base pattern. It has decent ranks and a solid annual and quarterly sales and earnings growth history with but one flaw - its March '07 earnings comparison was flat with lower sales.''
Shortly after the mid-day report was published there was a wave of distributional action in the broader market, and JST gave back most of its earlier gains like many other stocks did. The report identified $29.10 as JST's current pivot point and $30.56 as the maximum buy price. This could be considered a failed breakout attempt, as it encountered prompt resistance as it tried to rally for new all-time highs. A proper technical buy signal could be confirmed if this stock manages hold its ground and produce subsequent gains on at least +50% above average volume for a close above its pivot point. Until then this high-ranked stock can be kept on an active watch list.
Jinpan International sports a healthy Earnings Per Share (EPS) rating of 83 and an impressive Relative Strength (RS) rating of 95. JST resides in the Electrical- Equipment group which is currently ranked 50th of out the 197 Industry Groups list, placing near the top quartile to satisfy the "L" criteria. Disciplined investors know to avoid buying stocks before a technical buy signal is triggered, because doing so greatly hinders performance.C A N S L I M | StockTalk | News | Chart | ![]()
![]()
![]() SEC | Zacks Reports
SEC | Zacks Reports
View all notes | Alert me of new notes | CANSLIM.net Company Profile