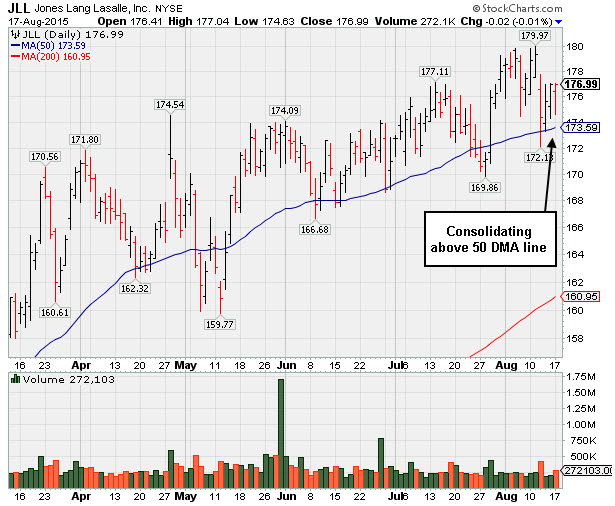
Fundamental Concerns Raised - Earnings Below +25% Guideline - Monday, August 17, 2015
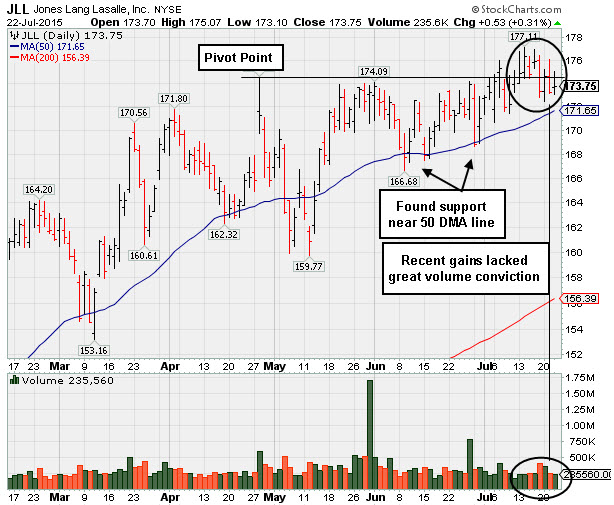
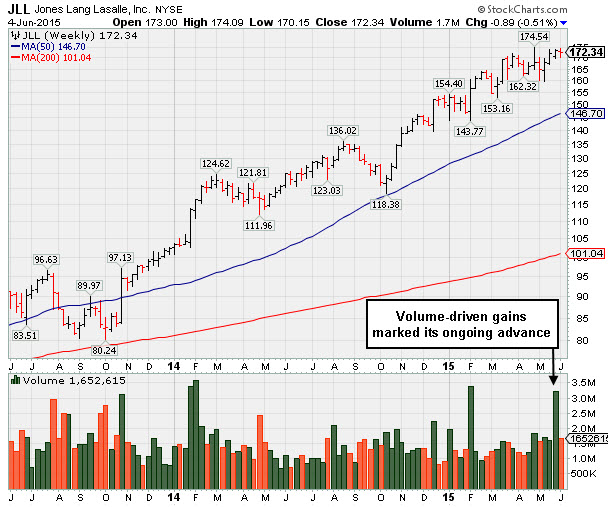
Recent Gains Lacked Volume Conviction; Earnings Report Soon Expected - Wednesday, July 22, 2015
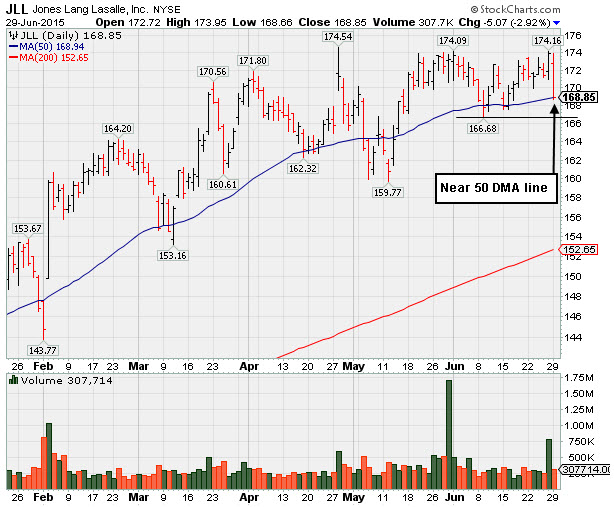
Did Not Trigger a New Technical Buy Signal - Monday, June 29, 2015
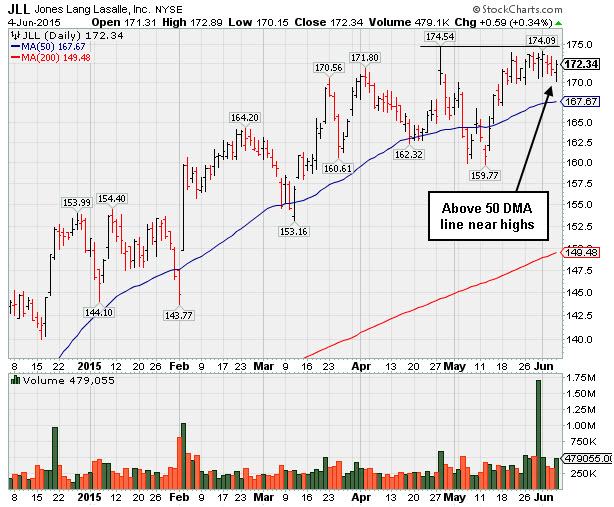
Forming New Base and No Resistance Remains - Thursday, June 4, 2015
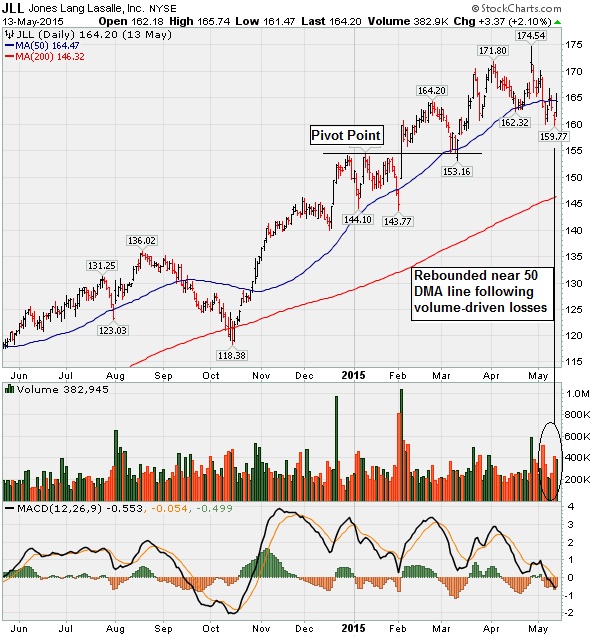
Rebounded Near 50 Day Moving Average Line - Wednesday, May 13, 2015
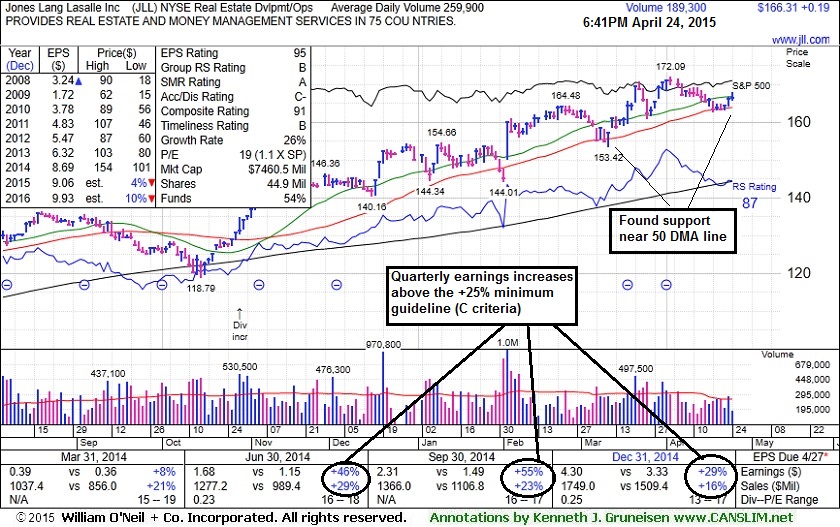
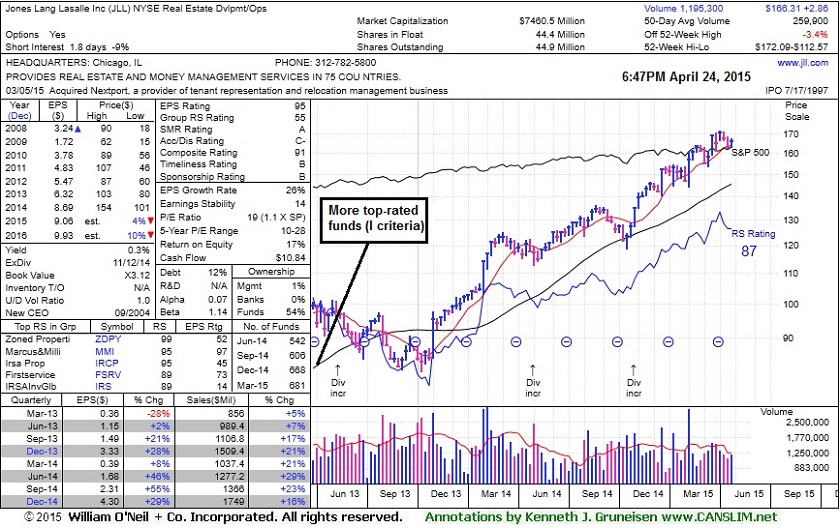
Found Support Again at 50-Day Moving Average Line - Friday, April 24, 2015
Jones Lang Lasalle Inc (JLL +$0.19 or +0.11% to $166.31) recently found support near its 50-day moving average DMA line ($163.88). Subsequent losses leading to a violation of the recent lows would raise concerns and trigger technical sell signals.
It was last shown in this FSU section on 4/06/15 with annotated graphs under the headline, "Holding Ground After Rally For New Highs", while extended from its prior base. It found support near prior highs on the recent pullback. It was highlighted in yellow in the 2/03/15 mid-day report (read here) and noted - "Has the look of a valid Secondary Buy point up to +5% above prior highs."
JLL reported Dec '14 earnings +29% on +16% sales revenues, above the +25% minimum earnings guideline (C criteria) for the 3rd consecutive quarterly comparison versus the year ago periods. The number of top-rated funds owning its shares rose from 513 in Mar '14 to 681 in Mar '15, which is a reassuring sign concerning the I criteria. Its small supply (S criteria) of only 44.4 million shares in the public float contribute to greater price volatility in the event of institutional buying or selling.
Holding Ground After Rally For New Highs - Monday, April 06, 2015
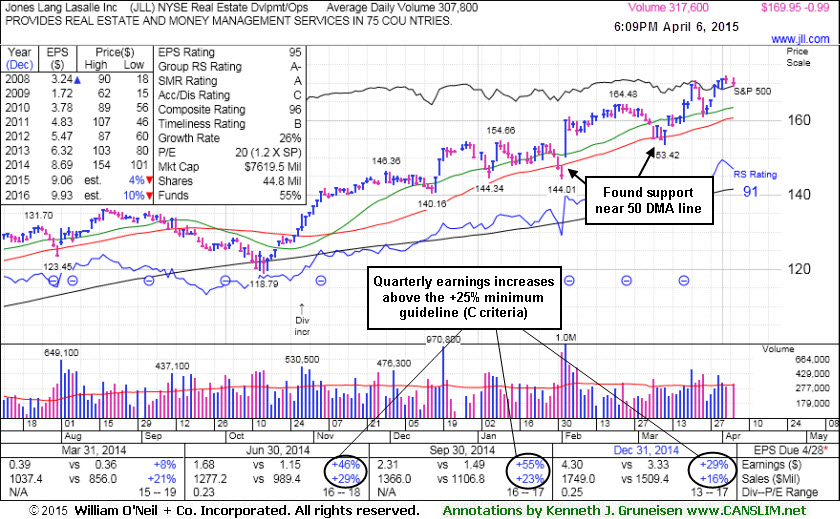
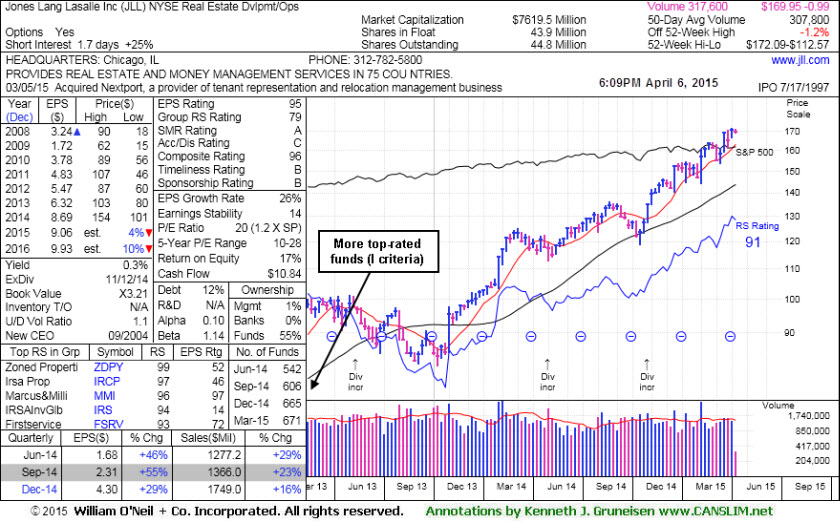
Jones Lang Lasalle Inc (JLL -$0.99 or -0.58% to $169.95) is extended from its prior base. It found support near prior highs on the recent pullback. The 50-day moving average (DMA) line ($160.66) also defines an important support level to watch. Subsequent losses would raise concerns and trigger technical sell signals.It was last shown in this FSU section on 3/17/15 with annotated graphs under the headline, "Found Support Near Prior Highs and 50-Day Moving Average Line". It was highlighted in yellow in the 2/03/15 mid-day report (read here) and noted - "Has the look of a valid Secondary Buy point up to +5% above prior highs."
JLL reported Dec '14 earnings +29% on +16% sales revenues, above the +25% minimum earnings guideline (C criteria) for the 3rd consecutive quarterly comparison versus the year ago periods. That helped provide a reassurance, fundamentally, and it appeared to form a base-on-base type pattern after a breakout in mid-December which came after noted with caution in the 12/02/14 mid-day report, "Patient investors may watch for a new base or secondary buy point to possibly develop and be noted in the weeks ahead."
The number of top-rated funds owning its shares rose from 513 in Mar '14 to 671 in Dec '14, which is a reassuring sign concerning the I criteria. Its small supply (S criteria) of only 43.9 million shares in the public float contribute to greater price volatility in the event of institutional buying or selling.
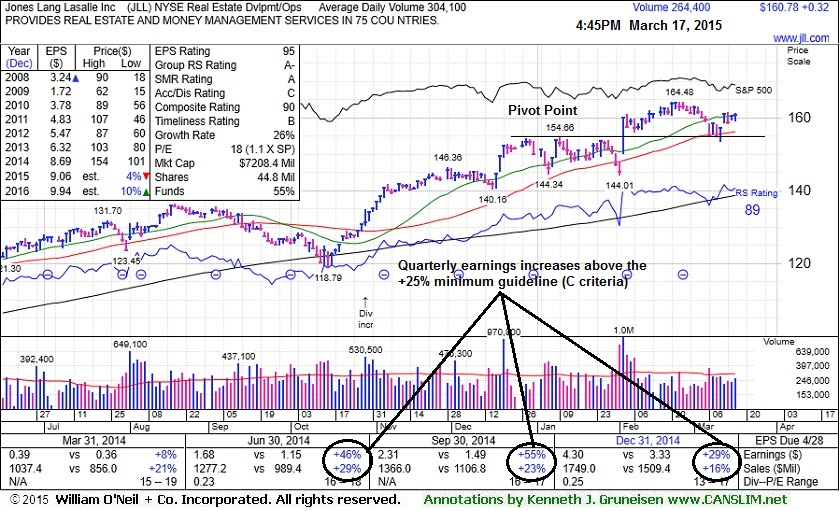
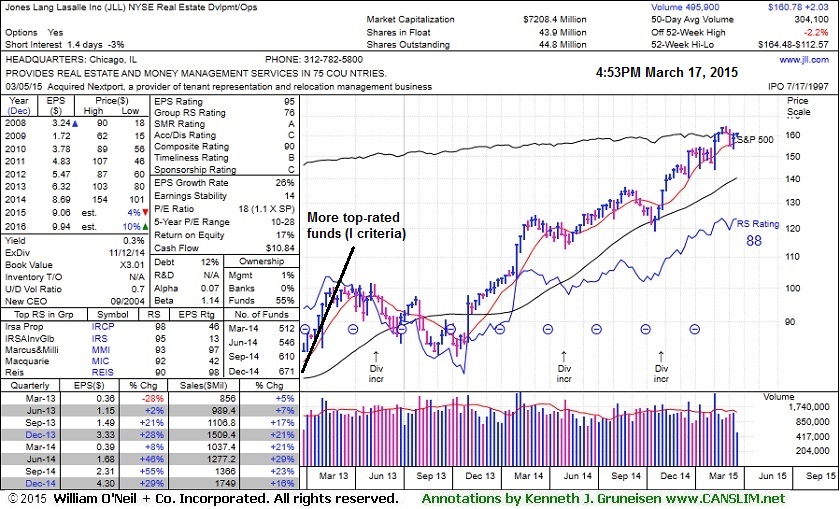
Found Support Near Prior Highs and 50-Day Moving Average Line - Tuesday, March 17, 2015
Jones Lang Lasalle Inc (JLL +$0.32 or +0.20% to $160.78) has been consolidating above prior highs in the $154 area and its 50-day moving average (DMA) line which recently acted as support. Subsequent losses below the recent low ($153.42 on 3/11/15) would raise greater concerns and trigger a technical sell signal. It was last shown in this FSU section on 2/25/15 with annotated graphs under the headline, "Wedged Above Prior Highs Getting Extended", while rising above its "max buy" level.
On 2/05/15 it finished strong with +251% above average volume behind its gain for a new 52-week high (N criteria) after gapping up. It was highlighted in yellow in the 2/03/15 mid-day report (read here) and noted - "Has the look of a valid Secondary Buy point up to +5% above prior highs."
JLL reported Dec '14 earnings +29% on +16% sales revenues, above the +25% minimum earnings guideline (C criteria) for the 3rd consecutive quarterly comparison versus the year ago periods. That helped provide a reassurance, fundamentally, and it appeared to form a base-on-base type pattern after a breakout in mid-December which came after noted with caution in the 12/02/14 mid-day report, "Patient investors may watch for a new base or secondary buy point to possibly develop and be noted in the weeks ahead."
The number of top-rated funds owning its shares rose from 513 in Mar '14 to 671 in Dec '14, which is a reassuring sign concerning the I criteria. Its small supply (S criteria) of only 43.9 million shares in the public float contribute to greater price volatility in the event of institutional buying or selling.
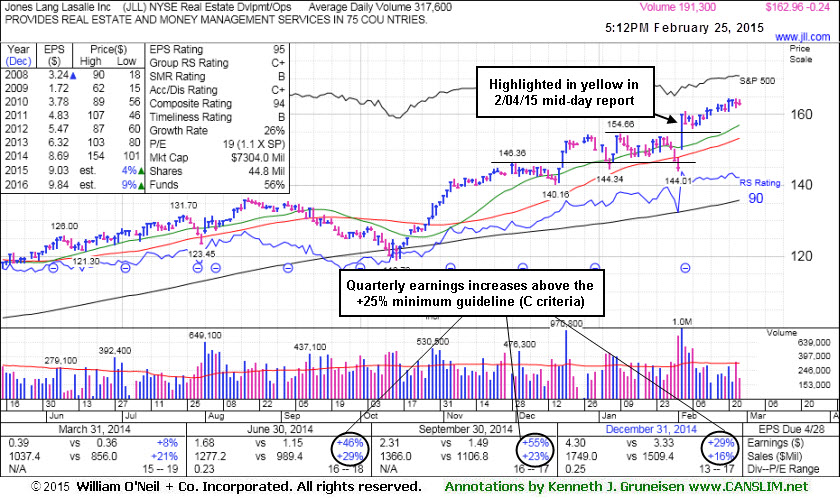
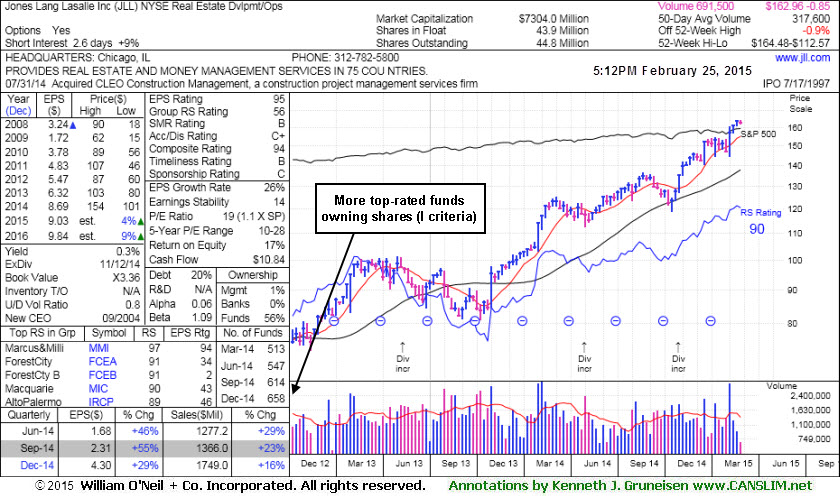
Wedged Above Prior Highs Getting Extended - Wednesday, February 25, 2015
Jones Lang Lasalle Inc (JLL -$0.24 or -0.15% to $162.96) recently wedged higher with volume totals lacking great conviction and its color code was changed to green after rising above its "max buy" level. Prior highs in the $154 area and its 50-day moving average (DMA) line define support to watch on pullbacks. It was last shown in this FSU section on 2/04/15 with annotated graphs under the headline, "Pullback Following Big Volume-Driven Gain For New Highs". On the prior session it had finished strong with +251% above average volume behind its gain for a new 52-week high (N criteria) after gapping up. It was highlighted in yellow in the 2/03/15 mid-day report (read here) and noted - "Has the look of a valid Secondary Buy point up to +5% above prior highs."
JLL reported Dec '14 earnings +29% on +16% sales revenues, above the +25% minimum earnings guideline (C criteria) for the 3rd consecutive quarterly comparison versus the year ago periods. That helped provide a reassurance, fundamentally, and it appeared to form a base-on-base type pattern after a breakout in mid-December which came after noted with caution in the 12/02/14 mid-day report, "Patient investors may watch for a new base or secondary buy point to possibly develop and be noted in the weeks ahead."
The number of top-rated funds owning its shares rose from 513 in Mar '14 to 658 in Dec '14, which is a reassuring sign concerning the I criteria. Its small supply (S criteria) of only 43.9 million shares in the public float contribute to greater price volatility in the event of institutional buying or selling.
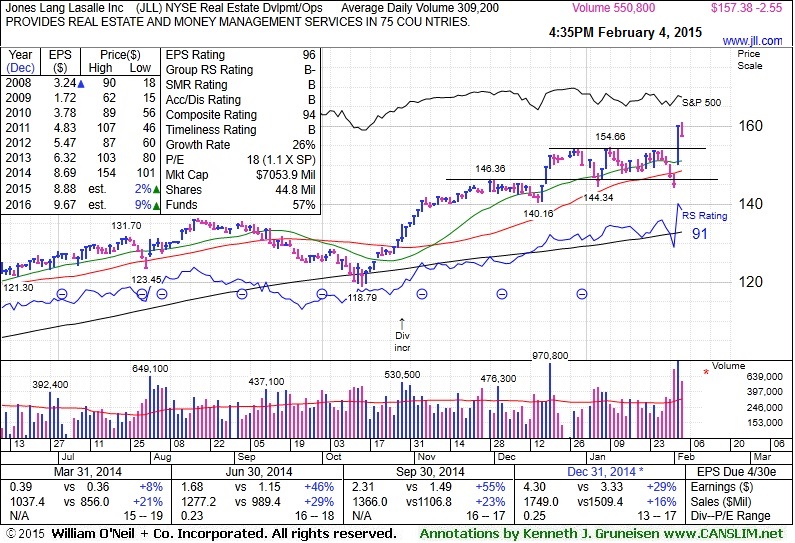
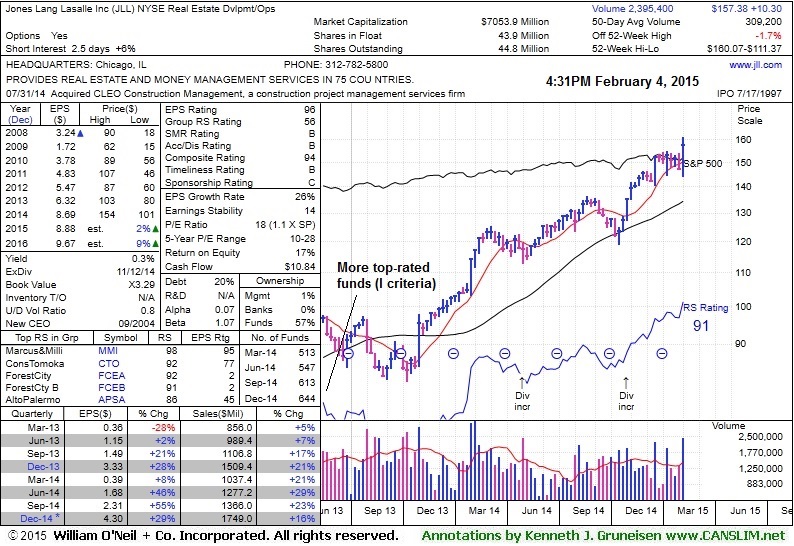
Pullback Following Big Volume-Driven Gain For New Highs - Wednesday, February 04, 2015
Jones Lang Lasalle Inc (JLL -$2.55 or -1.59% to $157.38) pulled back on Wednesday with above average but lighter volume. On the prior session it finished strong with +251% above average volume behind its gain for a new 52-week high (N criteria) after gapping up. It was highlighted in yellow in the 2/03/15 mid-day report (read here) and noted - "Has the look of a valid Secondary Buy point up to +5% above prior highs."
JLL reported Dec '14 earnings +29% on +16% sales revenues, above the +25% minimum earnings guideline (C criteria) for the 3rd consecutive quarterly comparison versus the year ago periods. That helped provide a reassurance, fundamentally, and it appeared to form a base-on-base type pattern after a breakout in mid-December which came after noted with caution in the 12/02/14 mid-day report, "Patient investors may watch for a new base or secondary buy point to possibly develop and be noted in the weeks ahead."
The number of top-rated funds owning its shares rose from 513 in Mar '14 to 644 in Dec '14, which is a reassuring sign concerning the I criteria. Its small supply (S criteria) of only 43.9 million shares in the public float contribute to greater price volatility in the event of institutional buying or selling.