Damaging Distributional Likely Triggered Loss Limiting Sell Rules - Friday, September 23, 2011
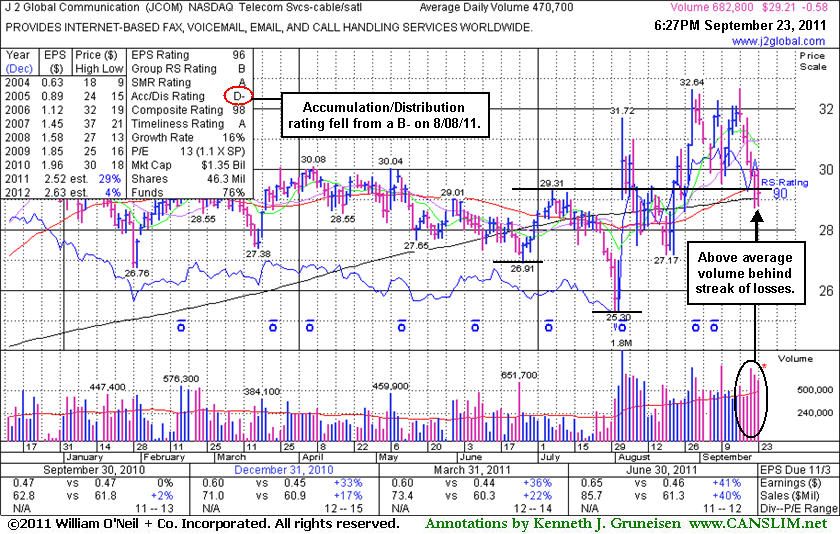
J 2 Global Communication (JCOM -$0.58 or -1.95% to $29.21) endured damaging distributional pressure this week. It slumped below previous highs in the $30-31 area while testing support near its closely coinciding 50-day and 200-day moving average (DMA) lines after above average volume was behind 6 consecutive losses since touching a new 52-week high. Disciplined investors always limit losses by following the investment system's rule of selling if a stock ever falls more than -7% from their buy point, so any recent buyers may already have been prompted to sell.After its last appearance in this FSU section on 8/29/11 with an annotated graph under the headline, "Confirming Gain on +43% Above Average Volume", it powered higher to a new 52-week high with heavier volume backing its 8/30/11 gain. After triggering that confirming technical buy signal, it stalled. It has sputtered since its 8/03/11 gap up. The 3 latest quarterly comparisons through June '11 show sales revenues and earnings acceleration and the high-ranked Telecom Services - Cable/Satellite firm has a strong annual earnings history, satisfying the C and A criteria. One concern we have highlighted is the waning ownership by top-rated funds, falling from 421 in Mar '11 to 398 in June '11. Normally, increasing interest from top-rated funds is preferred with respect to the I criteria. Its Accumulation/Distribution rating of D- (see red circle) is down from a B- when it was shown in this FSU section on 8/08/11.
Higher trading in recent weeks created a batch of investors who own the stock at higher prices, termed "overhead supply", which is a source of resistance that might hinder its progress for the near term as those anxious sellers watch for an opportunity to unload shares. Meanwhile, the broader market (M criteria) also has flashed warning signs while slumping into the latest recognized market correction.
Confirming Gain on +43% Above Average Volume - Monday, August 29, 2011
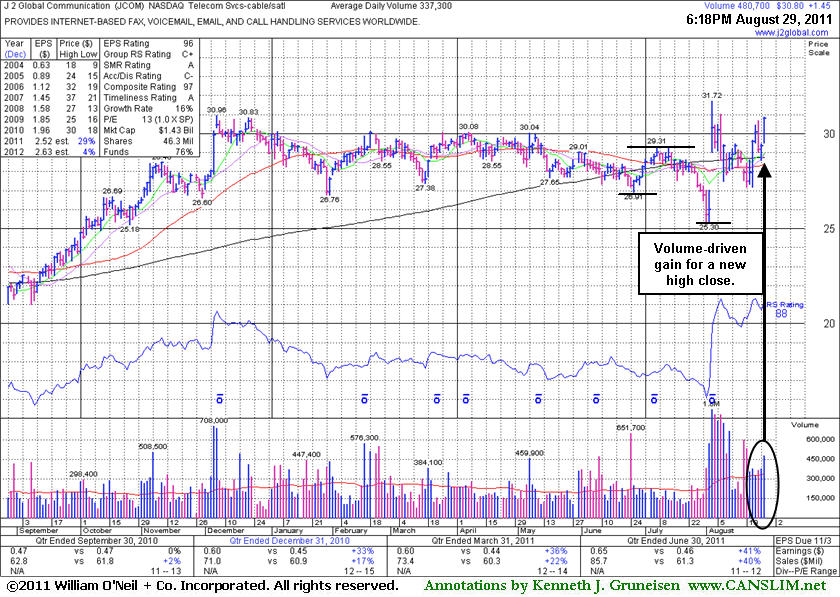
J 2 Global Communication (JCOM +$1.45 or +4.94% to $30.80) finished near the session high today for its best close of the year with a considerable gain with +43% above average volume. Little resistance remains due to overhead supply. Gains with slightly above average volume helped it rebound above its 50-day and 200-day moving average (DMA) lines, improving its outlook since its last appearance in this FSU section on 8/19/11 with an annotated graph under the headline, "Overhead Supply Acting as Source of Resistance". It has sputtered since its 8/03/11 gap up. The prompt rebound above those important moving averages helped its outlook.
Its color code was changed to yellow today after the solid gain which may be considered a confirming "buy signal" as it powered above the previously cited pivot point based on its 7/07/11 high ($29.31) following a "double bottom" type base. Although it had rallied to a new high and showed explosive potential, the subsequent slump was an indication that overhead supply was hindering its progress while the broader market (M criteria) also lacked upward momentum. The 3 latest quarterly comparisons through June '11 show sales revenues and earnings acceleration and the high-ranked Telecom Services - Cable/Satellite firm has a strong annual earnings history, satisfying the C and A criteria. One concern we have highlighted is the waning ownership by top-rated funds, falling from 421 in Mar '11 to 398 in June '11. Normally, increasing interest from top-rated funds is preferred with respect to the I criteria.
Overhead Supply Acting as Source of Resistance - Friday, August 19, 2011
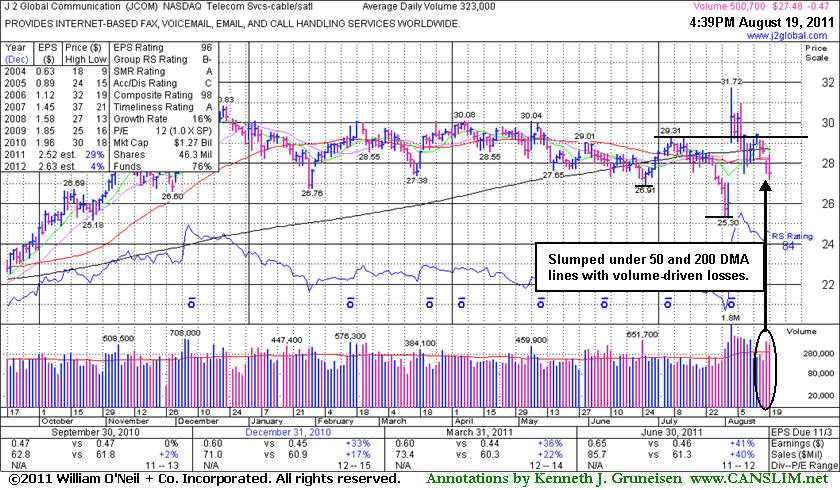
J 2 Global Communication (JCOM -$0.47 or -1.68% to $27.48) slumped under its 50-day and 200-day moving average (DMA) lines with volume-driven losses. Only a prompt rebound above those important moving averages would help its outlook. It has made no progress since its 8/03/11 gap up. Its last appearance in this FSU section was on 8/08/11 and included an annotated weekly graph under the headline, "Negative Reversal to a Close Below its Pivot Point". On that session it finished with a loss after a worrisome "negative reversal" leading to a close back below its pivot point. Members were also cautioned at that time - "The negative backdrop of the broader market (M criteria) bodes poorly for most stocks."Its color code was changed to yellow in the 8/08/11 mid-day report with an annotated daily graph (read here) showing a pivot point based on its 7/07/11 high after a "double bottom" type base. Although it had rallied to a new high and showed explosive potential, the subsequent slump is an indication that many anxious sellers immediately wanted to head for the exit, rather than adding to the buying momentum and driving it even higher as it was breaking out. Technically, it has endured damaging distributional pressure after rising to challenge previously stubborn resistance in the $30 area. The many months it spent trading at higher levels is a source of resistance called "overhead supply" which may hinder its ability to rally for meaningful gains.
The 3 latest quarterly comparisons through June '11 show sales revenues and earnings acceleration and the high-ranked Telecom Services - Cable/Satellite firm has a strong annual earnings history, satisfying the C and A criteria. The weekly graph below is packed with a lot of additional data. One concern we have highlighted is the waning ownership by top-rated funds, falling from 421 in Mar '11 to 398 in June '11. Normally, increasing interest from top-rated funds is preferred with respect to the I criteria.
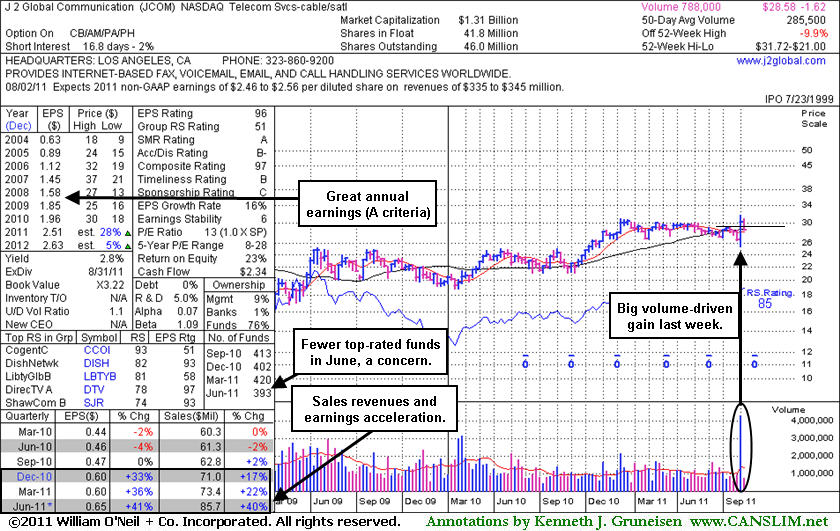
Negative Reversal to a Close Below its Pivot Point - Monday, August 08, 2011
J 2 Global Communication (JCOM -$1.62 or -5.36% to $28.58) finished the session with a loss after a worrisome negative reversal leading to a close back below its pivot point. It has no overhead supply remaining to act as resistance, but the negative backdrop of the broader market (M criteria) bodes poorly for most stocks. Its color code was changed to yellow in today's mid-day report with an annotated daily graph (read here) showing a pivot point based on its 7/07/11 high after a "double bottom" type base.Technically JCOM has been enduring distributional pressure near previously stubborn resistance in the $30 area since gapping up on 8/03/11 from below its 50-day moving average (DMA) and 200 DMA lines. The 3 latest quarterly comparisons through June '11 show sales revenues and earnings acceleration and the high-ranked Telecom Services - Cable/Satellite firm has a strong annual earnings history, satisfying the C and A criteria. The weekly graph below is packed with a lot of additional data. One concern we have highlighted is the waning ownership by top-rated funds, falling from 420 in Mar '11 to 393 in June '11. Normally, increasing interest from top-rated funds is preferred with respect to the I criteria.