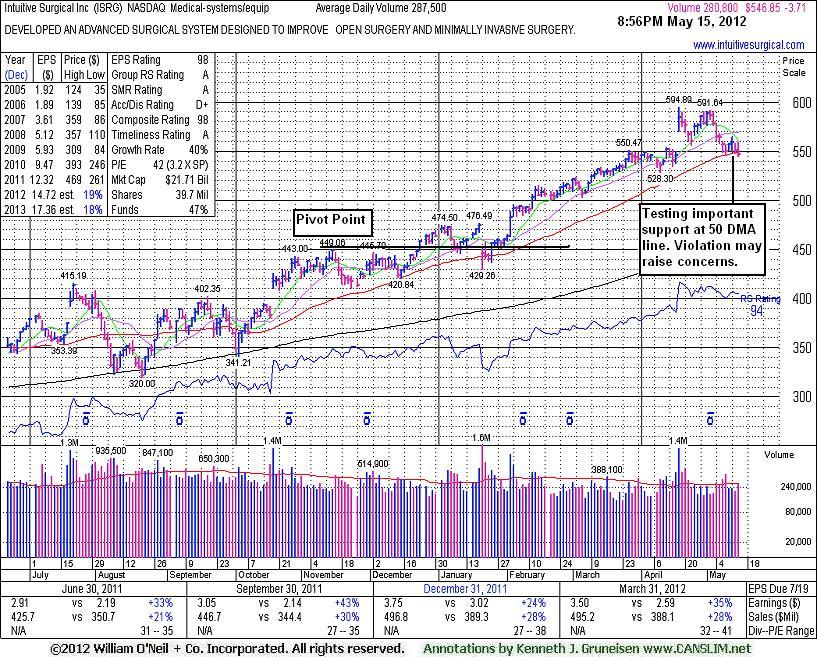
Intuitive Surgical Inc (ISRG -$3.71 or -0.67% to $546.85) is consolidating near its 50-day moving average (DMA) line that defines important support. A streak of 6 consecutive losses broke a recent streak of 11 consecutive weekly gains. Its last appearance in this FSU section was on 3/01/12 with an annotated graph included under the headline, 'Extended From Base After Wedging Higher", when it hit another new all-time high.
The 50 DMA line acted as support in the past during its ongoing ascent. Any subsequent deterioration below the 50 DMA may raise greater concerns and trigger a technical sell signal.
The December '11 quarterly earnings increased by just below the borderline +25% minimum guideline for ideal buy candidates. However, it followed that with a stronger +35% earnings increase on +28% sales revenues for the quarter ended March 31, 2012 versus the year ago period (satisfying the C criteria). The high-ranked Medical - Systems/Equipment firm has a great annual earnings (A criteria) history. This company's small supply (S criteria) of only 39.7 million shares outstanding can lead to greater volatility in the event of any abrupt institutional buying or selling. The number of top-rated funds owning its shares increased from 918 in Dec '10 to 1,213 in Mar '12.
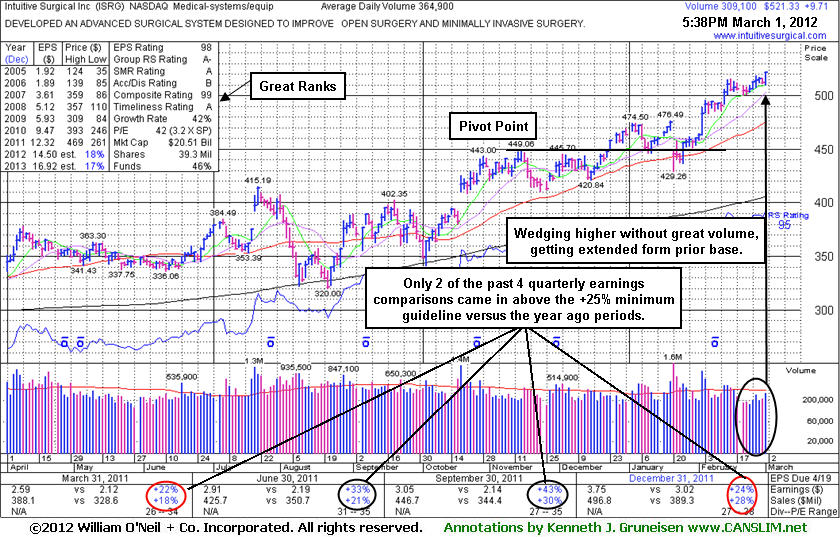
Intuitive Surgical Inc (ISRG +$9.71 or +1.90% to $521.33) hit another new all-time high today. It has recently wedged higher without great volume conviction, getting more extended from prior highs in the $475 area that define support to watch on pullbacks. Disciplined investors might sooner look for buy candidate which are a more solid match with all key criteria. In this case, the December '11 quarterly earnings increased by just below the borderline +25% minimum guideline for ideal buy candidates. Only 2 of the past 4 comparisons met that minimum guideline, giving cause for concern. Its last appearance in this FSU section was on 1/18/12 with an annotated graph included under the headline, "Earnings News Often Leads to Greater Volume and Volatility."
The high-ranked Medical - Systems/Equipment firm has a great annual earnings (A criteria) history. This company's small supply (S criteria) of only 39.3 million shares outstanding can lead to greater volatility in the event of any abrupt institutional buying or selling. The number of top-rated funds owning its shares increased from 918 in Dec '10 to 1,146 in Dec '11.
The high-ranked Medical - Systems/Equipment firm is due to report earnings after Thursday's close. Wall Street expects slower growth for Q4, a +10% EPS gain to $3.32 as revenue rises +24% to $483.7 million. However, the company has beaten views for 10 straight quarters by anywhere from 2% to 34%. Its shares often are volatile after earnings reports. Additionally, the fact-based system calls for buy candidates to show increases above the +25% guideline in the 3 or 4 most current quarterly (C criteria) comparisons versus the year-ago period.
The quarter ended September 30, 2011 was noted as a comparisons showing an acceleration in sales revenues and earnings increases, sequentially, a reassuring sign. It has a great annual earnings (A criteria) history. This company's small supply (S criteria) of only 39 million shares outstanding can lead to greater volatility in the event of any abrupt institutional buying or selling. The number of top-rated funds owning its shares increased from 918 in Dec '10 to 1,077 in Dec '11.
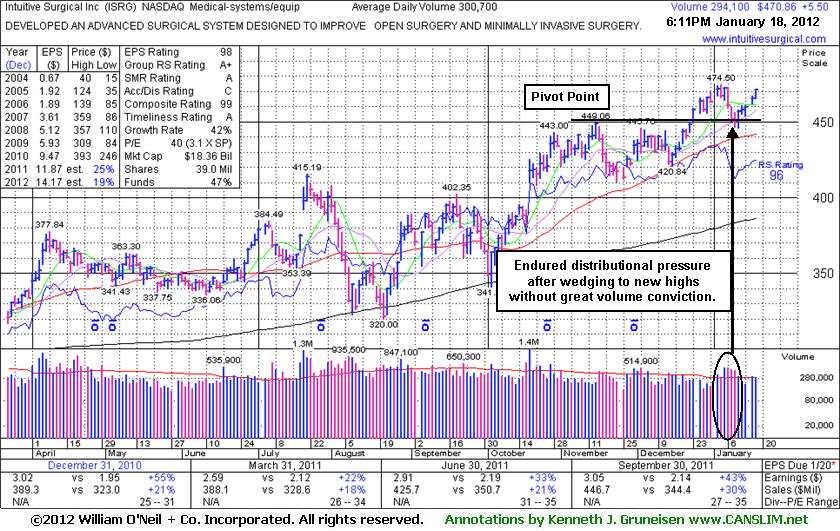
Intuitive Surgical Inc (ISRG +$0.68 or +0.16% to $434.39) is consolidating within close striking distance of its all-time high. It may be forming a base-on-base type pattern, but the latest consolidation has been on the brief side so a new pivot point is not being cited. Market conditions (M criteria) also are a concern until a more robust rally is confirmed. It found support recently well above its 50-day moving average (DMA) line near prior chart highs. Those levels define important chart support to watch now.
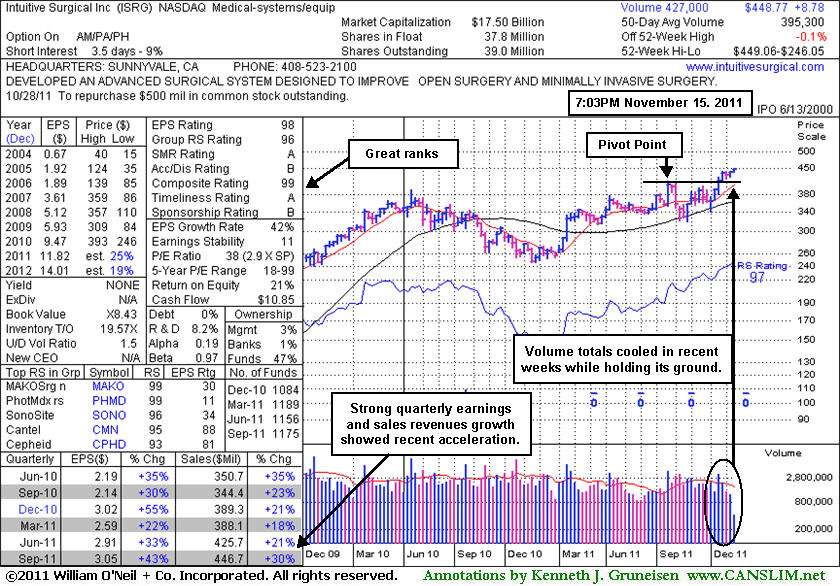
It marked its all-time high with its last appearance in this FSU section on 11/15/11 with an annotated graph included under the headline, "Volume Totals Cooling Following Recent Breakout." It reported earnings +43% on +30% sales revenues for the quarter ended September 30, 2011 versus the year ago period. Accelerating sales revenues and earnings increases in recent quarterly comparisons are a reassuring sign, and it has a great annual earnings (A criteria) history. This company's small supply (S criteria) of only 39 million shares outstanding can lead to greater volatility in the event of any abrupt institutional buying or selling. The number of top-rated funds owning its shares increased from 918 in Dec '10 to 1,075 in Sep '11. Its annual earnings history (the A criteria) has been very impressive.
An earlier appearance in this FSU section was on 5/03/10 with an annotated graph included under the headline, "Sales Revenues And Earnings Showed Acceleration In Latest Quarter". That report stated - "Subsequent violations of its recent chart low or 50-day moving average (DMA) line could raise more serious concerns and trigger sell signals." Soon afterward those violations occurred, and based on the weak action it was dropped from the Featured Stocks list on 5/07/10. It went through a long deep consolidation before rebounding impressively. It has continued to show impressive sales revenues and earnings growth. Long time members may recall that ISRG was first featured in yellow in CANSLIM.net reports in the summer of 2004 and it traded up more than 13-fold within a three and a half year time span after that initial appearance as a noteworthy buy candidate.
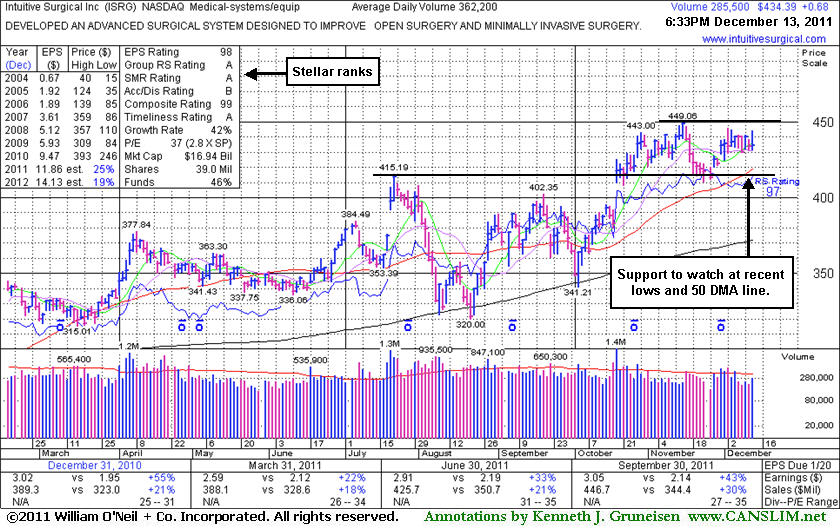
Intuitive Surgical Inc (ISRG +$8.29 or +1.88% to $448.77) inched to a new all-time high today with its 4th consecutive gain backed by light volume. No resistance from overhead supply remains. Prior highs define important support to watch on pullbacks. Its last appearance in this FSU section was on 10/18/11 with an annotated graph included under the headline, "Breakaway Gap Triggered Fresh Technical Buy Signal." The breakaway gap for a new 52-week and all-time high was backed my more than 3 times average volume, triggering a technical buy signal. Its powerful rally to new high territory was recognized as a fresh and reassuring sign of institutional accumulation (the investment system's I criteria). That report also stated - "Some investors may dismiss such a 'high-priced' stock as if it lacks the potential to produce big gains, but experienced investors and institutional investors know that the price of the shares has no bearing on their upside potential. More often, higher priced stocks are actually superior buy candidates, and the market has priced the companies' shares at highs for legitimate reasons, not by accident."
It reported earnings +43% on +30% sales revenues for the quarter ended September 30, 2011 versus the year ago period. Accelerating sales revenues and earnings increases in recent quarterly comparisons are a reassuring sign, and it has a great annual earnings (A criteria) history. This company's small supply (S criteria) of only 39 million shares outstanding can lead to greater volatility in the event of any abrupt institutional buying or selling. The number of top-rated funds owning its shares increased from 1,156 in Jun '11 to 1,175 in Sep '11. Its annual earnings history (the A criteria) has been very impressive.
An earlier appearance in this FSU section was on 5/03/10 with an annotated graph included under the headline, "Sales Revenues And Earnings Showed Acceleration In Latest Quarter". That report stated - "Subsequent violations of its recent chart low or 50-day moving average (DMA) line could raise more serious concerns and trigger sell signals." Soon afterward those violations occurred, and based on the weak action it was dropped from the Featured Stocks list on 5/07/10. It went through a long deep consolidation before rebounding impressively. It has continued to show impressive sales revenues and earnings growth. Long time members may recall that ISRG was first featured in yellow in CANSLIM.net reports in the summer of 2004 and it traded up more than 13-fold within a three and a half year time span after that initial appearance as a noteworthy buy candidate.
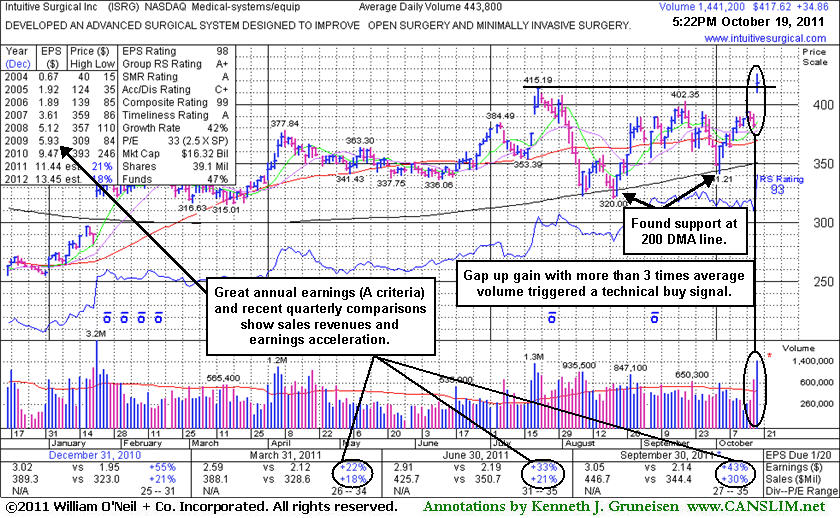
Intuitive Surgical Inc's (ISRG +34.86 or +9.11% to $417.62) color code was changed to yellow with pivot point cited based on its 52-week high plus 10 cents in the mid-day report earlier today. Its breakaway gap today for a new 52-week and all-time high was backed my more than 3 times average volume, triggering a technical buy signal. The strong action came after reporting earnings +43% on +30% sales revenues for the quarter ended September 30, 2011 versus the year ago period. Accelerating sales revenues and earnings increases in recent quarterly comparisons are a reassuring sign, and it has a great annual earnings (A criteria) history.
Some investors may dismiss such a "high-priced" stock as if it lacks the potential to produce big gains, but experienced investors and institutional investors know that the price of the shares has no bearing on their upside potential. More often, higher priced stocks are actually superior buy candidates, and the market has priced the companies' shares at highs for legitimate reasons, not by accident. This company's small supply (S criteria) of only 39.1 million shares outstanding can lead to greater volatility in the event of any abrupt institutional buying or selling. The number of top-rated funds owning its shares actually dipped from 1190 in Mar '11 to 1160 in Sep '11. Its powerful rally to new high territory is recognized as a fresh and reassuring sign of institutional accumulation (the investment system's I criteria). Its annual earnings history (the A criteria) has been very impressive.
Technically, it found support near its 200-day moving average (DMA) line during its choppy consolidation since noted in the 7/28/11 mid-day report following the previously noted "breakaway gap" and volume-driven gains to new high territory. Difficult market conditions hurt its chances and negated that breakout during the summer, demonstrating what the M criteria tells us - that 3 out of 4 stocks typically go in the direction of the major averages! Broader market action will largely determine whether this latest breakout is followed by a sustained advance.
ISRG's last appearance in this FSU section was on 5/03/10 with an annotated graph included under the headline, "Sales Revenues And Earnings Showed Acceleration In Latest Quarter". That report stated - "Subsequent violations of its recent chart low or 50-day moving average (DMA) line could raise more serious concerns and trigger sell signals." Soon afterward those violations occurred, and based on the weak action it was dropped from the Featured Stocks list on 5/07/10. It went through a long deep consolidation before rebounding impressively. It has continued to show impressive sales revenues and earnings growth. Long time members may recall that ISRG was first featured in yellow in CANSLIM.net reports in the summer of 2004 and it traded up more than 13-fold within a three and a half year time span after that initial appearance as a noteworthy buy candidate.
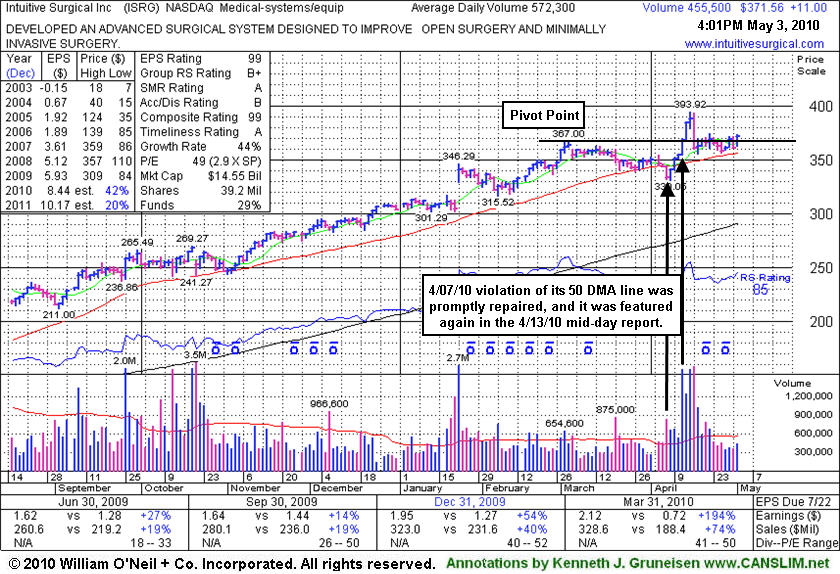
Intuitive Surgical Inc. (ISRG +$11.16 or +3.23% to $372.22) has been consolidating quietly in a tight range near its pivot point while staying above its 50-day moving average (DMA). Subsequent violations of its recent chart low or 50-day moving average (DMA) line could raise more serious concerns and trigger sell signals. It had suffered a technically damaging loss and an annotated graph was included under the 4/07/10 headline "Volume Surges Behind Damaging Losses" as it sank under its recent chart low ($338.52 on 3/26/10) and violated its 50-day moving average (DMA) line triggering worrisome sell signals while volume increased to nearly twice its average daily trading total. The prompt repair of its 50 DMA line breach was a reassuring sign of support, and additional gains helped ISRG show enough resilience to be featured again in yellow in the 4/13/10 mid-day report (read here) with new pivot point cited based on its 3/03/10 high.
The latest comparison for the period ended March 31, 2010 showed a continuation of the very impressive acceleration in sales revenues and earnings growth. Its powerful rally to new high territory was an even more reassuring sign of institutional accumulation that provided the latest technical buy signal, however the heavy distribution on 4/16/10 and weakness below its prior chart highs raised more recent concerns. The number of top-rated funds owning its shares has risen from 282 in Jun '09 to 306 in Mar '10, which is reassuring concerning the investment system's I criteria. Its annual earnings history (the A criteria) has been very impressive. Earlier notes had outlined technical deterioration before and when it was dropped from the Featured Stocks list on 6/10/08. ISRG traded up more than 13-fold since first featured in yellow in CANSLIM.net reports in the summer of 2004.
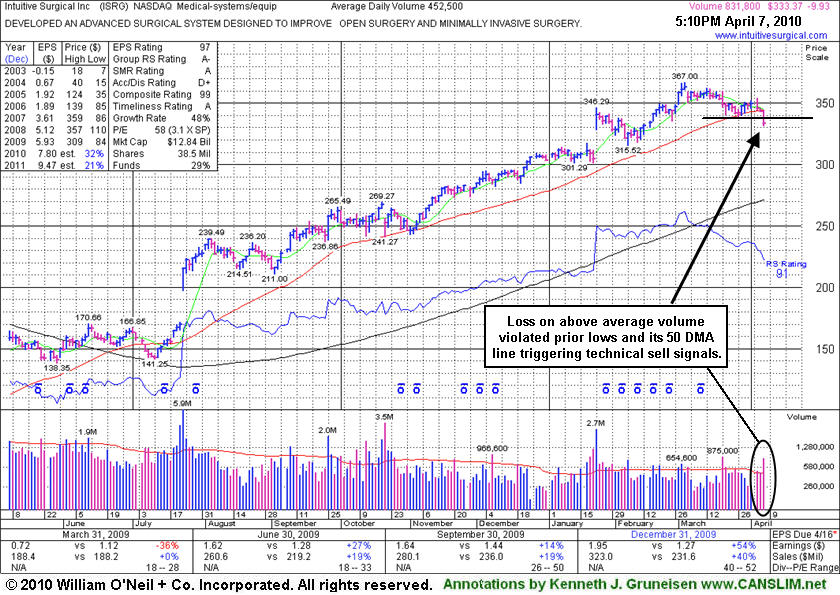
Intuitive Surgical Inc. (ISRG -$9.93 or -2.89% to $333.37) suffered a technically damaging loss today as it sank under its recent chart low ($338.52 on 3/26/10) and further below its 50-day moving average (DMA) line, raising more serious concerns and triggering more worrisome sell signals while volume increased to nearly twice its average daily trading total. A prompt repair of its 50 DMA line would be a reassuring sign of support, but until it rises back above that important short-term average the odds are in favor of a deeper consolidation and greater caution is in order. Based on the weakness it will be dropped from the Featured Stocks list tonight. It was repeatedly noted that its gains in February and March lacked the substantial above average volume that would be truly indicative of institutional (I criteria) buying demand which can lead to a meaningful rally. Since then, volume conviction clearly rose on the down sessions that negated its half-hearted rally from its prior base, and bringing on the latest technical damage to its chart.
Quarterly comparisons have not shown perfectly steady increases above the +25% guideline, yet the latest period ended December 31, 2009 showed a very impressive acceleration in sales revenues and earnings growth. It is due to report its next quarterly results on April 15th after the close, and while it may face an easy comparison versus the year ago sales revenues and earnings numbers, expectations are already lofty. The number of top-rated funds owning its shares has risen from 283 in Mar '09 to 313 in Dec '09, which is reassuring concerning the investment system's I criteria. ISRG was featured again most recently in the 1/22/10 mid-day report (read here), returning after some time off the Featured Stocks list. Its annual earnings history (the A criteria) has been very impressive. Earlier notes had outlined technical deterioration before and when it was last dropped from the Featured Stocks list on 6/10/08. ISRG traded up more than 13-fold since first featured in yellow in CANSLIM.net reports in the summer of 2004.
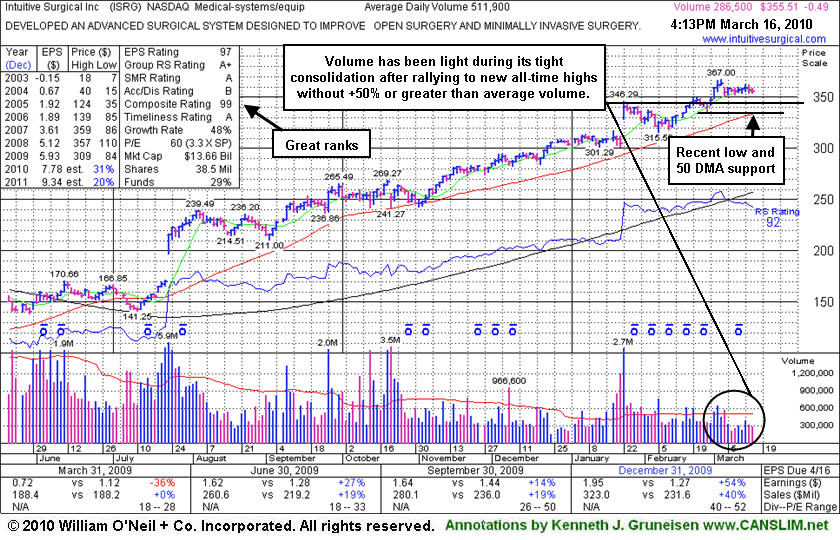
Intuitive Surgical Inc. (ISRG -$0.49 or -0.14% to $355.51) ended with a small loss today on light volume, quietly hovering near its all-time high. The stock has barely encountered any distributional pressure, and its current Up/Down Volume Ratio of 1.5 provides an unbiased bullish statistic concerning its recent price/volume pattern. However, as the daily graph below shows, volume has been light during its tight consolidation after recently rallying to new all-time highs without greater than +50% above average volume. When a weekly chart was shown in its last FSU section appearance on 2/24/10 under the headline "Down Weeks On Volume Have Been Rare In This Strong Example" it was then observed, "ISRG may be on course for its all-time high ($359 in 2007)." It made it there without triggering any technical buy signal, however. In the event of a pullback, its prior chart highs in the $346 area are an initial support level to watch, while its 50-day moving average ($333.77) line and its 2/25/10 low ($335.27) help define the next very important support level. Subsequent gains into new high territory would have more serious bullish implications if volume swells substantially.
The number of top-rated funds owning its shares has risen from 283 in Mar '09 to 311 in Dec '09, which is reassuring concerning the investment system's I criteria. ISRG was featured again most recently in the 1/22/10 mid-day report (read here), returning after some time off the Featured Stocks list. Its annual earnings history (the A criteria) has been very impressive. Quarterly comparisons have not shown perfectly steady increases above the +25% guideline, yet the latest period ended December 31, 2009 showed a very impressive acceleration in sales revenues and earnings growth. It is due to report its next quarterly results on April 15th after the close.
Earlier notes had outlined technical deterioration before and when it was last dropped from the Featured Stocks list on 6/10/08. ISRG traded up more than 13-fold since first featured in yellow in CANSLIM.net reports in the summer of 2004.
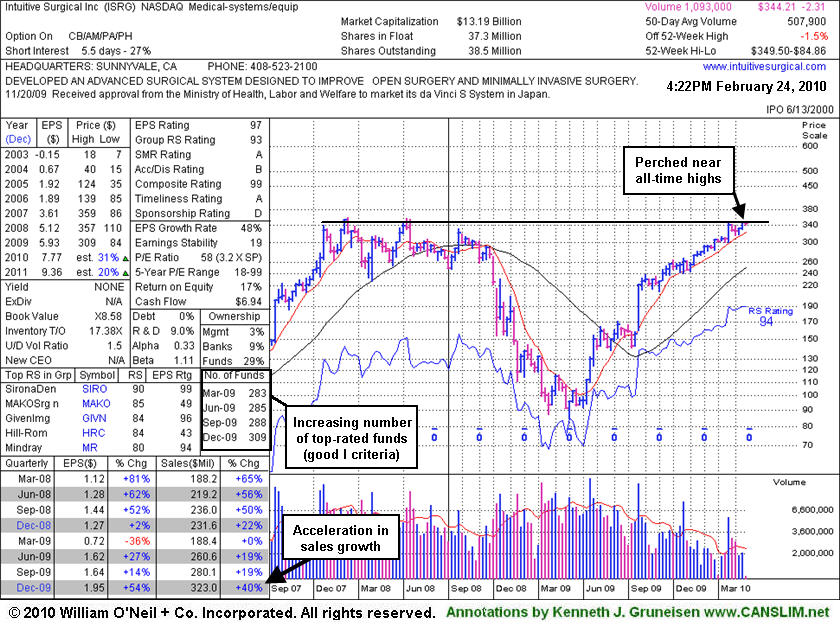
Intuitive Surgical Inc. (ISRG +$1.53 or +0.45% to $344.21) is quietly hovering near its 52-week high. The stock has barely encountered any distributional pressure, and its current Up/Down Volume Ratio of 1.5 provides an unbiased bullish statistic concerning its recent price/volume pattern. As the weekly graph below shows, down weeks with worrisome above average volume have been very rare since early-2009! The number of top-rated funds owning its shares has risen from 283 in Mar '09 to 320 in Dec '09, which is reassuring concerning the investment system's I criteria. ISRG was featured again most recently in the 1/22/10 mid-day report (read here), returning after some time off the Featured Stocks list. Subsequent gains into new high territory would have more serious bullish implications. The broader market (M criteria) outlook would be helped immensely by a powerful follow-through-day on higher volume from at least one of the major averages and better leadership to confirm a new rally of significance. Meanwhile, odds are less favorable for investors making profits with new buys, and caution is advised.
Its annual earnings history (the A criteria) has been very impressive. Although quarterly comparisons have not shown perfectly steady increases above the +25% guideline, the latest period ended December 31, 2009 showed an impressive acceleration in sales revenues and earnings growth. ISRG rebounded impressively from its March low ($84.86) and may be on course for its all-time high ($359 in 2007). Notes outlined technical deterioration before and when it was last dropped from the Featured Stocks list on 6/10/08. ISRG traded up more than 13-fold since first featured in yellow in CANSLIM.net reports in the summer of 2004.
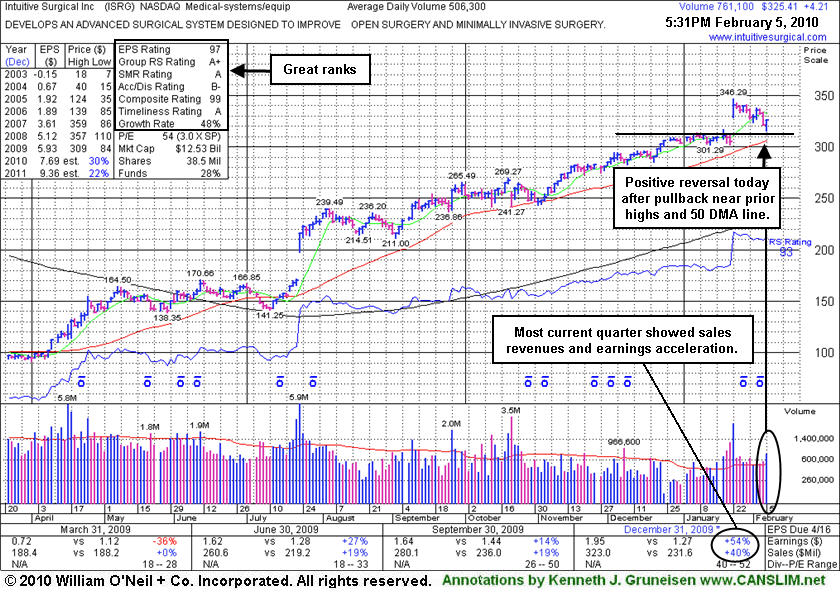
Intuitive Surgical Inc. (ISRG +$4.21 or +1.31% to $325.41) positively reversed for a gain today on above average volume after pulling back near its prior chart highs and 50-day moving average (DMA) line intra-day. That area defines an important chart support level now, where any deeper losses would raise more serious concerns. ISRG was featured again most recently in the 1/22/10 mid-day report (read here), returning after some time off the Featured Stocks list. More detailed analysis the evening of 1/22/10 appeared under the headline "Breakaway Gap Prompts Return To Featured Stocks Page" as an annotated graph illustrated its "breakaway gap" to a new 52-week high following 4-weeks of tight consolidation. It had just reported accelerating sales revenues and earnings increases for the period ended Dec 31, 2009, making its turnaround story all the more impressive.
Breakaway gaps were noted previously as, "a rare exception in which chasing a stock as much as +10% above prior highs is permitted under the investment system's guidelines" while we went on to say that "patience may allow investors to accumulate shares on ordinary pullbacks toward recent chart highs." Its recent consolidation has taken it down to within less than +5% of its prior highs. The heavier volume behind the latest gain indicates institutional (the I criteria) support and accumulation. Keep in mind that distribution days have recently been hurting the market outlook (M criteria), and 3 out of 4 stocks are likely to follow the direction of the major averages. Always limit losses by selling any stock that falls more than -7% from your purchase price, following Rule #1 of the investment system - keep your losses small!
Its annual earnings history (the A criteria) has been very impressive. Although quarterly comparisons have not shown perfectly steady increases above the +25% guideline, the latest period ended December 31, 2009 showed an impressive acceleration in sales revenues and earnings growth. ISRG rebounded impressively from its March low ($84.86) and may be on course for its all-time high ($359 in 2007). Notes outlined technical deterioration before and when it was last dropped from the Featured Stocks list on 6/10/08. ISRG traded up more than 13-fold since first featured in yellow in CANSLIM.net reports in the summer of 2004.
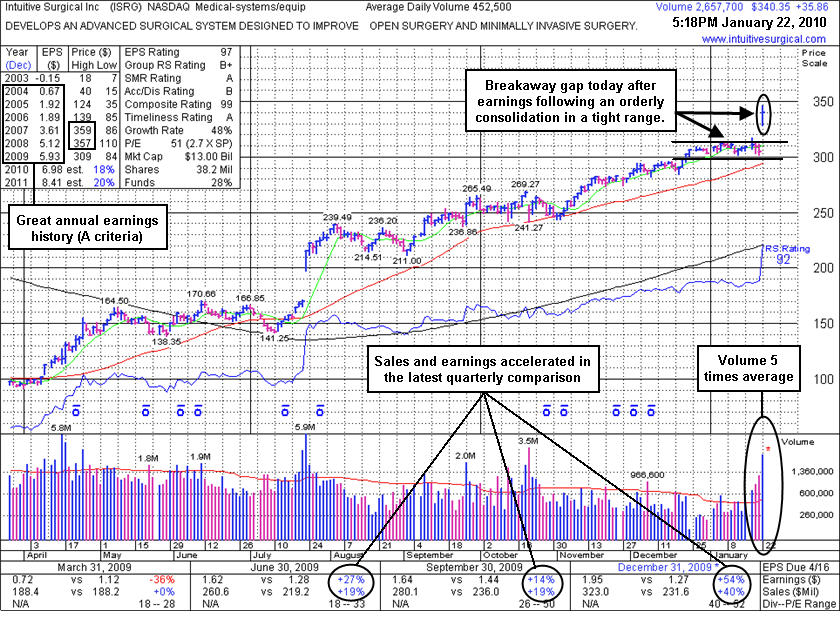
Intuitive Surgical Inc. (ISRG +$35.86 or +11.78% to $340.35) gapped up today and hit a new 52-week high which could be considered a "breakaway gap" following 4-weeks of tight consolidation. It just reported accelerating sales revenues and earnings increases for the period ended Dec 31, 2009, making its turnaround story all the more impressive. The explosive action exemplifies that stocks often have swift reactions to substantial fundamental news, so investors can expect to encounter greater volume and volatility during earnings season. ISRG has rebounded impressively from its March low ($84.86) and is quickly approaching all-time high ($359 in 2007). Its annual earnings history (the A criteria) has been very impressive, and although quarterly comparisons have not shown perfectly steady increases above the +25% guideline, the latest period ended December 31, 2009 showed an impressive acceleration in sales revenues and earnings growth.
Breakaway gaps are a rare exception in which chasing a stock as much as +10% above prior highs is permitted under the investment system's guidelines, however patience may allow investors to accumulate shares on ordinary pullbacks toward recent chart highs. This is why its color code is yellow as of the mid-day report (read here) appearance earlier today, even while it rallied above the prior chart highs by more than +5%. The heavy volume behind the considerable gain indicates institutional (the I criteria) accumulation.
Prior notes outlined its technical deterioration when ISRG was last dropped from the Featured Stocks list on 6/10/08. A proper buy signal was not triggered on or after its appearance in yellow in the 4/10/08 CANSLIM.net Mid-Day BreakOuts Report (read here), however ISRG had returned to the Featured Stock list at that time after having been a previously featured leader that traded up more than 13-fold after first featured in yellow in CANSLIM.net reports in mid-2004.
Keep in mind that distribution days have recently been hurting the market outlook (M criteria), and 3 out of 4 stocks are likely to follow the direction of the major averages. Always limit losses by selling any stock that falls moire than -7% from your purchase price, following Rule #1 of the investment system - keep your losses small!
Often, when a leading stock is setting up to breakout of a solid base it is highlighted in CANSLIM.net's Mid-Day Breakouts Report. The most relevant factors are noted in the report which allows prudent CANSLIM oriented investors to place the issue in their watch list. After doing any necessary backup research, the investor is prepared to act if and when the stock triggers a technical buy signal (breaks above its pivot point on more than +50% average turnover). In the event the stock fails to trigger a technical buy signal and its price declines then it will simply be removed from the watch list.
Intuitive Surgical Inc. (ISRG +$17.81 or +5.30% to $353.88) rallied on above average volume as it enjoyed its best close ever! This high ranked leader was featured again in yellow today in the CANSLIM.net Mid Day Breakouts Report (read here) with a new $359.69 pivot point and a $377.57 maximum buy price with the following note, "Y - Near its all-time highs in the $359 area after a 4-month consolidation, with no resistance remaining due to overhead supply now. It has high-ranks based on strong quarterly sales revenues and earnings increases (good C criteria). Annual earnings have grown impressively over the past 3-5 years, however 2006's earnings were actually lower than 2005's, and the lack of steady growth raises a question concerning the A criteria. It had gapped down for a considerable loss on heavier volume on 1/08/08, and based on the weak technical action it was dropped from the Featured Stocks list. This stock traded up more than 11 fold since it was first featured in yellow in CANSLIM.net report on August 18, 2004."
This stock has appeared several times over the past few years in CANSLIM.net's reports. Most recently it was featured on October 19, 2007 in the CANSLIM.net Mid Day Breakouts report (read here) as it was breaking out of an ascending base pattern with a $264.51 pivot point and a $277.74 maximum buy price. The shares rallied a very healthy +36% since that mid-October appearance before triggering a slew of technical sell signals in January, which actually prompted its last appearance with an annotated graph in the Featured Stock Update section of the January 8, 2008 After Market Update under the headline "Gap Down, Violation of 50 DMA & Upward Trendline Trigger Sell Signals" (read here). This long-time favorite is up more than 13 fold since it was first featured in yellow in CANSLIM.net reports in July-August 2004.
C A N S L I M | StockTalk | News | Chart | SEC | Zacks Reports | ![]()
![]()
![]()

View all notes | Alert me of new notes | CANSLIM.net Company Profile
One of the critical characteristics of successful investing is knowing when to sell. Investors are best served when they buy based on the combination of strong fundamentals and technicals, then sell based on the technicals. The reason is because fundamentals often tend to lag a stock's technical condition and come to light later to help explain the technical chart action after the fact.
Intuitive Surgical, Inc. (ISRG -$28.25) or -11.60% to $271.73) gapped down as it continued plunging below support, triggering a flurry of technical sell signals in recent days. On Friday January 4, 2007, this high-ranked leader gapped down and sliced below support, violating its 50-day moving average (DMA) line. Then on Monday it tried to rally but encountered resistance at its 50 DMA line and could not promptly repair the violation. Remember a stock's 50 DMA line acts as support when the stock is trading above that important moving average and acts as resistance when the stock trades below it. ISRG was no exception. This set the stage for Tuesday's awful performance - a huge loss on much heavier than average volume as it plunged throuugh its well-defined upward trendline. Based on the poor technical action the stock is being dropped from the CANSLIM.net Featured Stocks list. Over the course of the past few months, this stock also traced out an ominous head-and-shoulders type of chart pattern. A head and shoulders chart pattern tends to occur after a big move and normally signals a change in trend. Knowing when to sell and lock in gains is, in some cases, just as important as knowing when to buy!
This stock was recently featured on October 19, 2007 in the CANSLIM.net Mid Day Breakouts report (read here) as it was breaking out of an ascending base pattern with a $264.51 pivot point and a $277.74 maximum buy price. The shares rallied a very healthy +36% since that mid-October appearance before triggering a slew of technical sell signals in recent days. Furthermore, this stock is up more than 11 fold since it was first featured in yellow in CANSLIM.net reports in July-August 2004.
C A N S L I M | StockTalk | News | Chart | SEC | Zacks Reports | ![]()
![]()
![]()

View all notes | Alert me of new notes | CANSLIM.net Company Profile
An upward trendline, by definition, develops as a stock steadily appreciates over an extended period of time. During that period the stock vacillates between the lower and upper boundaries of trendlines which can be drawn connecting a series of recent highs or lows. In order to ensure the overall health of the stock, the lower boundary should not be violated. Technically, if the lower boundary is violated this signals that the trend is deteriorating and bears are gaining control, making the odds start to favor the possibility of further downside testing.
Intuitive Surgical Inc. (ISRG +$1.68 or +0.60% to $282.92) edged higher on below average volume today. The advanced surgical system designer's shares have recently been finding support near the lower boundary of its upward trendline and its 50-day moving average (DMA) line. As of this writing, Intuitive Surgical is one of the few stocks that has managed to escape the market's recent bout of selling relatively unharmed technically. This stock was recently featured on October 19, 2007 in the CANSLIM.net Mid Day Breakouts report (read here) as it was breaking out of an ascending base pattern with a $264.51 pivot point and a $277.74 maximum buy price. The shares rallied a very healthy +28% since that mid-October appearance. Furthermore, this stock is up more than 11 fold since it was first featured in yellow in CANSLIM.net reports in July-August 2004.
ISRG shares closed -16.7% below their 52-week high today, yet the stock remains one of the highest ranked issues in the market. Its Earnings Per Share (EPS), Relative Strength (RS) rating and Composite Rating are all pegged at 99, the highest possible readings. The company resides in the Medical- systems/equip group which is currently ranked 5th out of the 197 industry groups listed in the paper, which places it in the much coveted top quartile needed to satisfy the L criteria. As long as the bulls continue defending its well-defined upward trendline and 50 DMA line, the stock remains in healthy technical shape. However, if these important areas of support are breached, then a definitive technical sell signal will be triggered and playing smart defense becomes paramount.
C A N S L I M | StockTalk | News | Chart | SEC | Zacks Reports | ![]()
![]()
![]()

View all notes | Alert me of new notes | CANSLIM.net Company Profile