Volume Heavy Behind Damaging Losses Negating Breakout - Monday, February 4, 2019
Innoviva Inc (INVA -$0.17 or -1.04% to $16.24) needs a rebound above the 50-day moving average (DMA) line ($17.90) for its outlook to improve. It recently undercut the prior high ($18.60 on 12/03/18) and violated its 50 DMA line triggering technical sell signals during a streak of 4 consecutive volume-driven losses. The prior low ($15.55 on 12/24/18) defines the next important near-term support to watch.
INVA was highlighted in yellow with pivot point cited based on its 4/12/18 high plus 10 cents in the 11/23/18 mid-day report (read here). It was last shown in this FSU section on 1/17/19 with an annotated graph under the headline, "Perched at High Following Volume-Driven Gains".
Keep in mind that it is due to report earnings news on 2/06/19. Volume and volatility often increase near earnings news. Earnings increases in quarterly comparisons through Sep '18 have been above the +25% minimum guideline (C criteria). Annual earnings (A criteria) growth has been good after turning a profitable FY '15. It has earned a 95 Earnings Per Share Rating, well above the 80+ minimum for buy candidates.
The number of top-rated funds owning its shares rose from 351 in Dec '17 to 412 in Dec '18, a reassuring sign concerning the I criteria. The current Up/Down Volume Ratio of 0.8 is an unbiased indication its shares have been under some distributional pressure over the past 50 days. There are only 66.7 million shares in the public float (S criteria). It has earned an B Timeliness Rating and C Sponsorship Rating.
Charts courtesy of www.stockcharts.com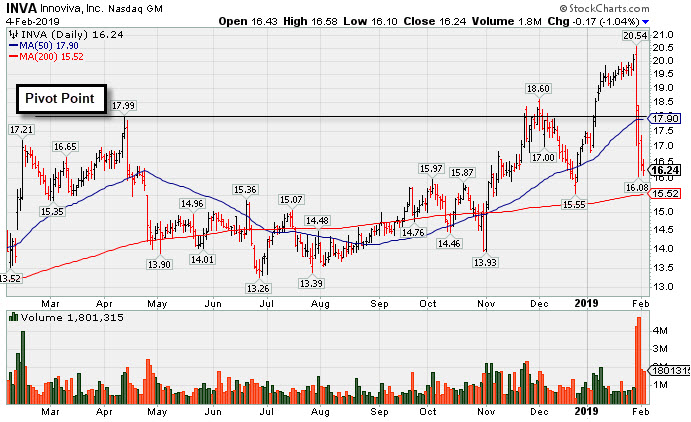
Perched at High Following Volume-Driven Gains - Thursday, January 17, 2019
Innoviva Inc (INVA +$0.04 or +0.21% to $19.47) is stubbornly holding its ground with volume totals cooling while remaining perched near its 52-week high after a streak of gains. The 50-day moving average (DMA) line ($17.35) and prior low ($15.55 on 12/24/18) define near-term support.
Last week's gains above the pivot point were backed above average volume helping trigger a convincing technical buy signal. It was highlighted in yellow with pivot point cited based on its 4/12/18 high plus 10 cents in the 11/23/18 mid-day report (read here) and last shown in this FSU section on 1/03/19 with an annotated graph under the headline, "Consolidating Above 50-Day Average Line Near High".
Earnings increases in quarterly comparisons through Sep '18 have been above the +25% minimum guideline (C criteria). Annual earnings (A criteria) growth has been good after turning a profitable FY '15. It has earned a 94 Earnings Per Share Rating, well above the 80+ minimum for buy candidates.
The number of top-rated funds owning its shares rose from 351 in Dec '17 to 390 in Sep '18, a reassuring sign concerning the I criteria. The current Up/Down Volume Ratio of 1.4 is an unbiased indication its shares have been under accumulation over the past 50 days. There are only 66.7 million shares in the public float (S criteria). It has earned an A Timeliness Rating and C Sponsorship Rating.
Charts courtesy of www.stockcharts.com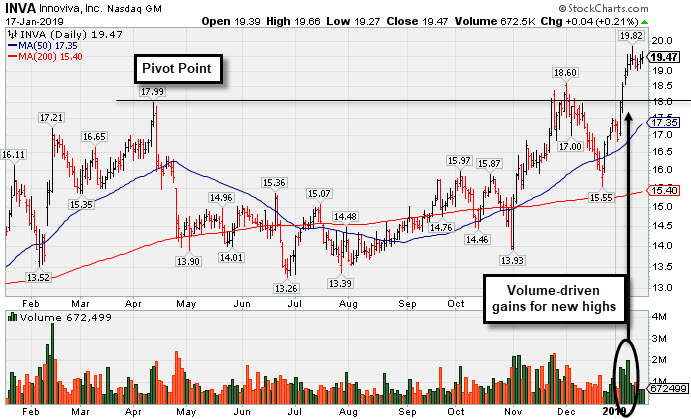
Consolidating Above 50-Day Average Line Near High - Thursday, January 3, 2019
Innoviva Inc (INVA -$0.47 or -2.74% to $16.83) is consolidating above its 50-day moving average (DMA) line ($16.56). It faces little resistance due to overhead supply. Subsequent gains and a strong close above the pivot point backed by at least +40% above average volume may trigger a technical buy signal. However, any new buying efforts are discouraged under the fact-based investment system until a new confirmed market rally (M criteria) with a follow-through day is noted.
It was highlighted in yellow with pivot point cited based on its 4/12/18 high plus 10 cents in the 11/23/18 mid-day report (read here) and last shown in this FSU section on 12/13/18 with an annotated graph under the headline, "Perched Near High With Volume Totals Cooling".
Earnings increases in quarterly comparisons through Sep '18 have been above the +25% minimum guideline (C criteria). Annual earnings (A criteria) growth has been good after turning a profitable FY '15. It has earned a 94 Earnings Per Share Rating, well above the 80+ minimum for buy candidates.
The number of top-rated funds owning its shares rose from 351 in Dec '17 to 390 in Sep '18, a reassuring sign concerning the I criteria. The current Up/Down Volume Ratio of 1.0 is an unbiased indication its shares have been neutral concerning accumulation/distribution over the past 50 days. There are only 66.7 million shares in the public float (S criteria). It has earned an A Timeliness Rating and C Sponsorship Rating.
Charts courtesy of www.stockcharts.com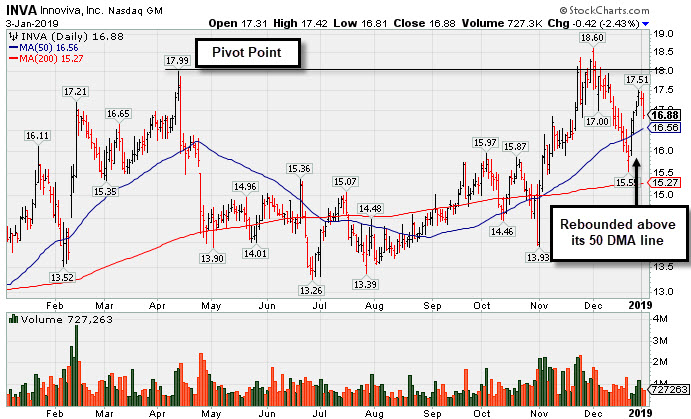
Perched Near High With Volume Totals Cooling -
Innoviva Inc (INVA -$0.36 or -2.05% to $17.22) has seen volume totals cooling while remaining perched near its all-time high. Subsequent gains and a strong close above the pivot point backed by at least +40% above average volume may trigger a technical buy signal. New buying efforts are discouraged under the fact-based investment system until a new confirmed market rally (M criteria) with a follow-through day is noted.
It was highlighted in yellow with pivot point cited based on its 4/12/18 high plus 10 cents in the 11/23/18 mid-day report (read here) and last shown in this FSU section on 11/23/18 with an annotated graph under the headline, "Bullish Action in Biotech Firm With Strong Earnings History".
Earnings increases in quarterly comparisons through Sep '18 have been above the +25% minimum guideline (C criteria). Annual earnings (A criteria) growth has been good after turning a profitable FY '15. It has earned a 94 Earnings Per Share Rating, well above the 80+ minimum for buy candidates.
The number of top-rated funds owning its shares rose from 351 in Dec '17 to 390 in Sep '18, a reassuring sign concerning the I criteria. The current Up/Down Volume Ratio of 1.0 is an unbiased indication its shares have been neutral concerning accumulation/distribution over the past 50 days. There are only 66.7 million shares in the public float (S criteria). It has earned an A Timeliness Rating and B Sponsorship Rating.
Charts courtesy of www.stockcharts.com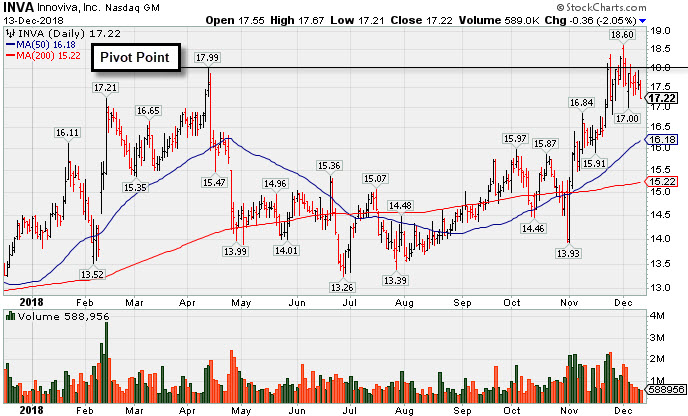
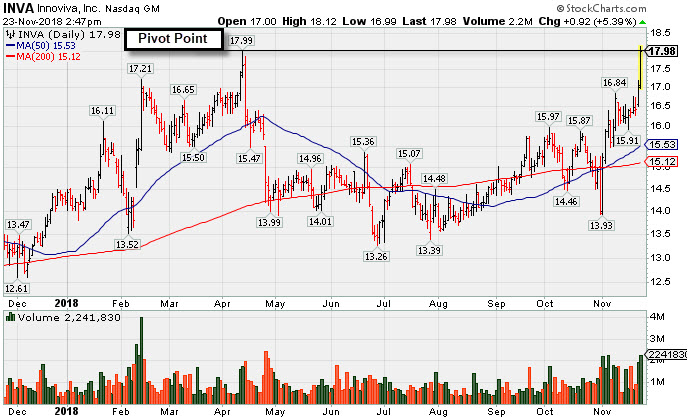
Bullish Action in Biotech Firm With Strong Earnings History - Friday, November 23, 2018
Innoviva Inc (INVA +$0.92 or +5.39% or $17.98) was highlighted in yellow with pivot point cited based on its 4/12/18 high plus 10 cents in the earlier mid-day report (read here). It touched a new 52-week high. A gain above the pivot point backed by at least +40% above average volume may trigger a technical buy signal. However, new buying efforts are discouraged under the fact-based investment system until a new confirmed market rally (M criteria) is noted.
Earnings increases in quarterly comparisons through Sep '18 have been above the +25% minimum guideline (C criteria). Annual earnings (A criteria) growth has been good after turning a profitable FY '15. It has earned a 94 Earnings Per Share Rating, well above the 80+ minimum for buy candidates.
The number of top-rated funds owning its shares rose from 351 in Dec '17 to 382 in Sep '18, a reassuring sign concerning the I criteria. The current Up/Down Volume Ratio of 1.3 is an unbiased indication its shares have been under accumulation over the past 50 days. There are only 66.7 million shares in the public float (S criteria). It has earned an A Timeliness Rating and C Sponsorship Rating.
Charts courtesy of www.stockcharts.com