Damaging Losses Violated 200 DMA Line Since Dropped 5 Weeks Ago - Wednesday, August 31, 2011
When the number of stocks included on the Featured Stocks page is low, and those currently listed have all received recent analysis in this FSU section, we occasionally go back to revisit a previously featured stock that was dropped. Today we will have another look at a stock that was dropped from the Featured Stocks list back on July 21, 2011.
Informatica Corp. (INFA $41.78) was last noted 7/21/2011 3:07:54 PM - "Due to report earnings following today's close. Losses with above average volume have raised more concerns after its 50 DMA line acted as resistance. Based on recent technical weakness it will be dropped from the Featured Stocks list tonight." Then it reported +32% earnings on +24% sales revenues for the quarter ended June 30, 2011 versus the year ago period. Its apparently strong fundamentals failed to prevent a subsequent slide from $51.40 to as low as $38.77 in recent weeks, a -24.6% decline from when it was dropped less than 5 weeks ago. This serves as a reminder to all members to recognize sell signals and be sure to lock in profits, and also cut losses whenever any stock falls 7-8% from your purchase price!
INFA's last appearance in this FSU section was on 7/12/11 under the headline, "Falling Under New Pivot Point Without Triggering Fresh Buy Signal", as it was pulling back, consolidating below a new pivot point. This high-ranked Computer Software - Database firm faced no resistance due to overhead supply then, and it had been doing well after an earlier breakout. On July 1st its color code was changed to yellow as a new pivot point was cited based on a new short flat base pattern. Although it quietly wedged above the pivot point, it was noted that the gains came without sufficient volume to trigger a new (or add-on) technical buy signal. Disciplined investors know to always watch for a volume-driven breakout gain above the pivot point with a minimum of at least +40-50% above average volume to trigger a convincing technical buy signal before taking action.
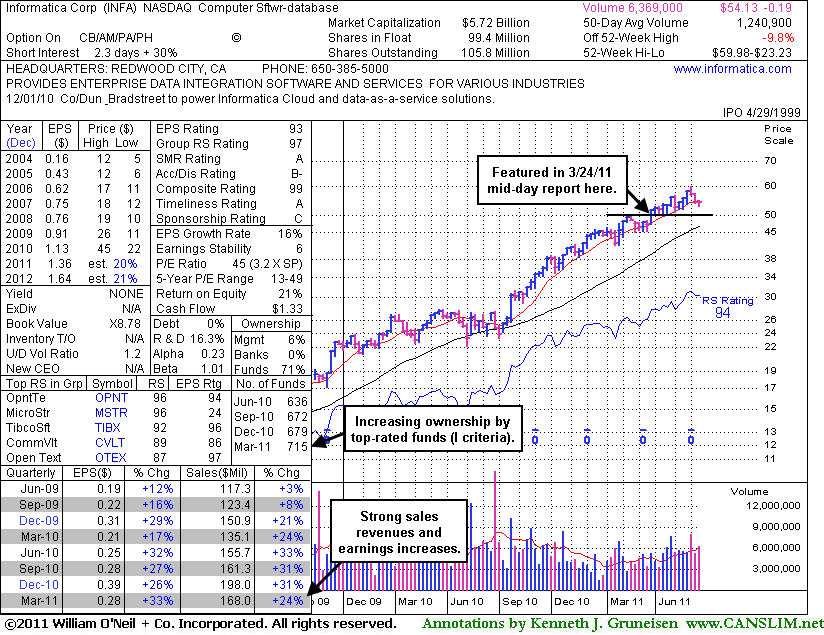
From the stock's Company Profile page members can review all prior notes and analysis. After the 3/24/11 mid-day report (read
here) first highlighted INFA in yellow at $50.04 it had traded as much as +24.7% higher. Quarterly earnings increases (C criteria) were all above the +25% minimum guidelines and it also maintained a steady annual earnings (A criteria) history. Disciplined investors know, however, that even if earnings are good, the technical action is what dictates sound decision making. There is a large amount of overhead supply that will act as resistance while it is now -33% off its high. The number of top-rated funds owning its shares rose from 652 in Dec '10 to 764 in Jun '11, a reassuring sign concerning the I criteria. However, its current Up/Down Volume Ratio of 0.6 is an unbiased indication that it has been recently enduring distributional pressure, suggesting that future data may reveal waning ownership by top-rated funds.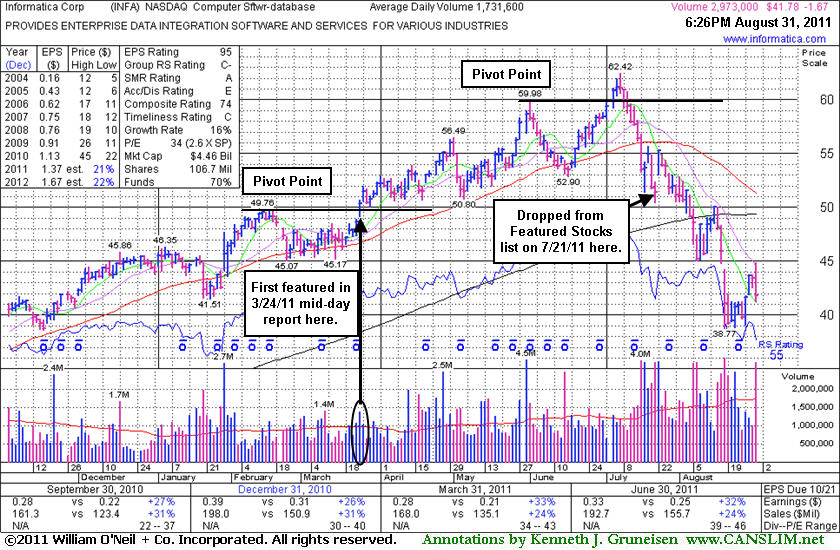
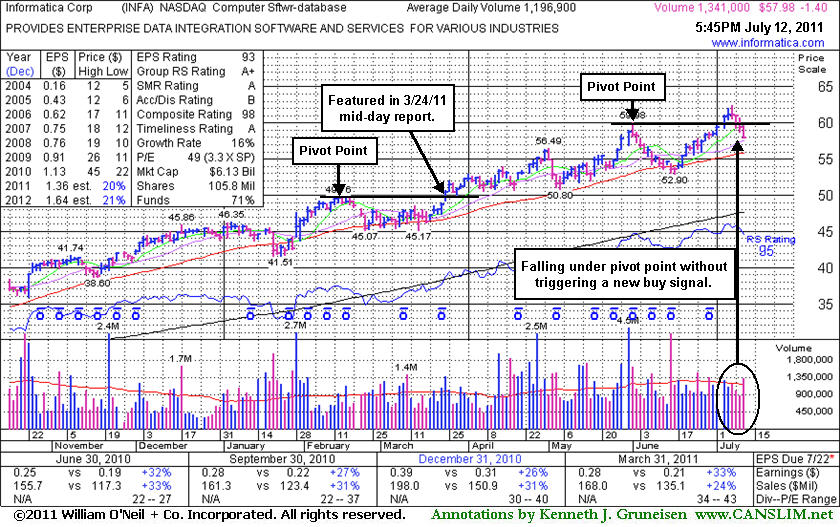
Falling Under New Pivot Point Without Triggering Fresh Buy Signal - Tuesday, July 12, 2011
Informatica Corp. (INFA -$1.40 or -2.36% to $57.98) has been pulling back, consolidating below its new pivot point recently cited. This high-ranked Computer Software - Database firm faces no resistance due to overhead supply. Disciplined investors know to watch for a volume-driven breakout gain above the pivot point with at least +50% above average volume to first trigger a convincing new (or add-on) technical buy signal before taking action.Following its last appearance in this FSU section with an annotated daily graph on 6/17/11 under the headline, "Computer Software Firm Extended From Last Base Pattern", this Redwood City, CA-based firm found support near its 50-day moving average (DMA) line. On July 1st its color code was changed to yellow as a new pivot point was cited based on a new short flat base pattern. Although it quietly wedged above the pivot point, the gains came without sufficient volume to trigger a buy signal. Following those half-hearted gains there have been 4 consecutive losses. Today's loss came with slightly above average volume and it closed near the session low, showing signs of distributional pressure rather than more favorable institutional accumulation.
Since the 3/24/11 mid-day report (read here) highlighted in yellow at $50.04 it has traded as much as +24.7% higher. It reported +33% earnings on +24% sales revenues for the quarter ended March 31, 2011 versus the year ago period. That followed prior strong results after its Jun, Sep, and Dec '10 earnings increases were all above the +25% minimum guidelines. It has also maintained a steady annual earnings (A criteria) history. The number of top-rated funds owning its shares rose from 634 in Mar '10 to 726 in Mar '11, a reassuring sign concerning the I criteria.
Computer Software Firm Extended From Last Base Pattern - Friday, June 17, 2011
Informatica Corp. (INFA +$0.59 or +1.10% to $54.13) posted a small gain today, finding support near its 50-day moving average (DMA) line. It hit a new 52-week high on 6/01/11 but then there was a negative reversal noted. This high-ranked Computer Software - Database firm did not form a sound new base pattern. Following its last appearance in this FSU section with an annotated daily graph on 5/24/11 under the headline "Prior Highs and 50-Day Average Define Support to Watch", it surged to new highs with volume-driven gains. It is extended from its latest sound base pattern. Disciplined investors may watch for a new base to form and new (or add-on) buy signals to possibly develop and be noted. Since the 3/24/11 mid-day report highlighted this Redwood City, CA-based Computer Software - Database firm in yellow it has traded as much as +19.86% higher.
It reported +33% earnings on +24% sales revenues for the quarter ended March 31, 2011 versus the year ago period. That followed prior strong results after its Jun, Sep, and Dec '10 earnings increases were all above the +25% minimum guidelines. It has also maintained a steady annual earnings (A criteria) history. The number of top-rated funds owning its shares rose from 634 in Mar '10 to 715 in Mar '11, a reassuring sign concerning the I criteria.
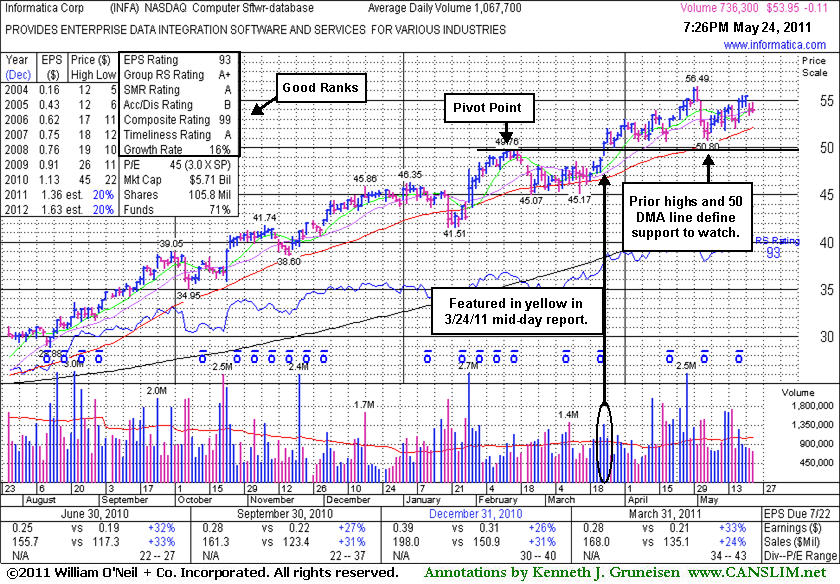
Prior Highs and 50-Day Average Define Support to Watch - Tuesday, May 24, 2011
Informatica Corp. (INFA -$0.11 or -0.20% to $53.95) was down today for a second consecutive small loss with below average volume. It is extended from its latest sound base pattern. Disciplined investors may watch for secondary buy points to possibly develop and be noted. Since its last appearance in this FSU section with an annotated graph on 4/27/11 under the headline, "New All-Time High After Another Volume-Driven Gain", it endured mild distributional pressure and slumped near prior highs in the $49 area defining support to watch closely coinciding with its 50-day moving average (DMA) line. Subsequent violations would raise concerns and could trigger technical sell signals.
Since the 3/24/11 mid-day report highlighted this Redwood City, CA-based Computer Software - Database firm in yellow it has traded as much as +12.9% higher. It reported +33% earnings on +24% sales revenues for the quarter ended March 31, 2011 versus the year ago period. That followed prior strong results after its Jun, Sep, and Dec '10 earnings increases were all above the +25% minimum guidelines. It has also maintained a steady annual earnings (A criteria) history. The number of top-rated funds owning its shares rose from 634 in Mar '10 to 713 in Mar '11, a reassuring sign concerning the I criteria.
New All-Time High After Another Volume-Driven Gain - Wednesday, April 27, 2011
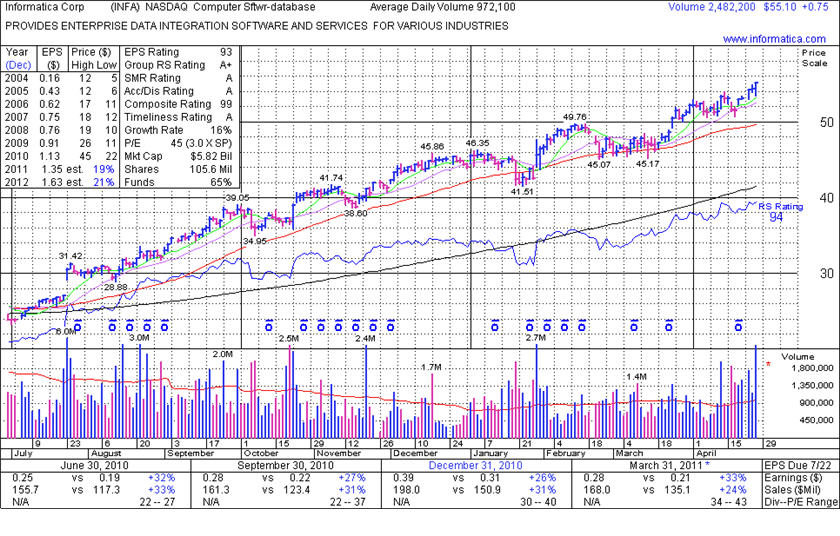
Informatica Corp. (INFA +$0.75 or +1.38% to $55.10) finished at the session high today with a 5th consecutive gain with above average volume for yet another new 52-week high. It is extended from its latest sound base pattern. Disciplined investors may watch for secondary buy points to develop. It reported +33% earnings on +24% sales revenues for the quarter ended March 31, 2011 versus the year ago period. Prior highs in the $49 area define support to watch coinciding with its 50-day moving average (DMA) line. Since its last appearance in this FSU section with an annotated graph on 3/28/11 under the headline, "Quiet Pullback Following Breakout With Near Minimum Volume", it stubbornly held its ground and rallied higher.
In the 3/24/11 mid-day report this Redwood City, CA-based Computer Software - Database firm was highlighted in yellow and noted for having strong characteristics. The Jun, Sep, and Dec '10 earnings increases were all above the +25% minimum guidelines, and it has maintained a steady annual earnings (A criteria) history. The number of top-rated funds owning its shares rose from 634 in Mar '10 to 678 in Mar '11, a reassuring sign concerning the I criteria.
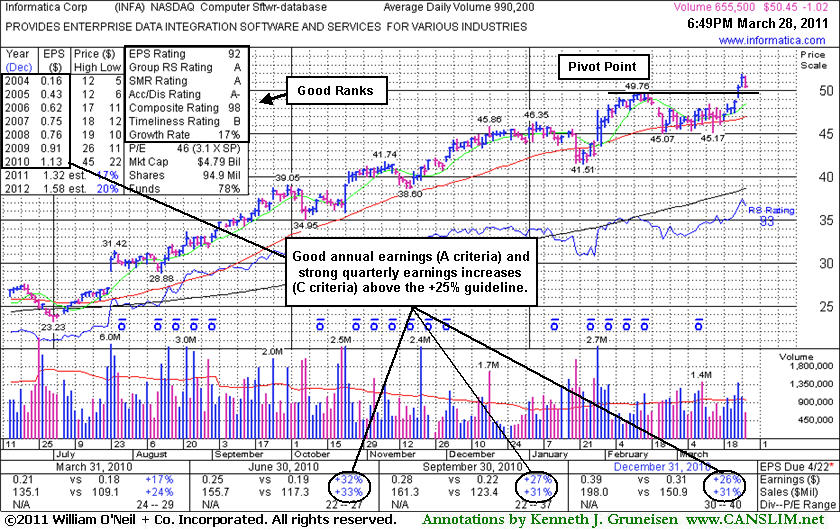
Quiet Pullback Following Breakout With Near Minimum Volume - Monday, March 28, 2011
In the 3/24/11 mid-day report this Redwood City, CA-based Computer Software - Database firm was highlighted in yellow and noted for having strong characteristics. Its sales revenues and earnings increases for the 3 most recent quarters (Jun, Sep, Dec '10) were above the +25% minimum guidelines and it has maintained a steady annual earnings (A criteria) history. The number of top-rated funds owning its shares rose from 634 in Mar '10 to 677 in Dec '10, a reassuring sign concerning the I criteria. Recent action has been encouraging, but 3 out of 4 stocks move in the direction of the major averages. A follow-through day (FTD) has thus far been elusive, and we have repeatedly noted that the M criteria remains a concern until a follow-through day provides a reassuring sign confirming that odds are most favorable for investors under the investment system's guidelines.
Informatica Corp. (INFA -$1.02 or -1.98% to $50.45) pulled back today on lighter volume after 6 consecutive gains had helped it rally to new 52-week highs. It had triggered a technical buy signal as it rose with +42% above average volume (near the bare minimum volume increase per the investment system's guidelines for a proper technical buy signal) on 3/24/11 while breaking out from an orderly flat base pattern during which its 50-day moving average (DMA) line acted as support.
News of Offering Leads to Swift Test of Support at 50 DMA Line - Wednesday, March 08, 2006
A very important technical tool that savvy investors have learned to incorporate in their technical analysis is the 50-day moving average (DMA) line. The 50 DMA line plays a pivotal role relative to a stock's price. If the price of a stock is above its 50 DMA then odds are that its 50 DMA will act as formidable support. Conversely, if the price is below its 50 DMA then the moving average acts as resistance.
Informatica Corp. (INFA -$1.07 or -6.92% to $14.40) gapped lower as it fell on monstrous volume more than 7 times is average on Wednesday. Through the prior session the company�s fundamentals still looked good and technically the stock was holding up relatively well. However, news that is fundamental in nature can have, and often does have, an immediate impact on share prices. In this case the company announced that it plans to price an offering of $200 million in convertible senior notes. It plans to use $50 million of the proceeds to repurchase stock and the remainder for working capital, including possible acquisitions, strategic investments, additional share repurchases and other general corporate purposes. Investors may be wise to expect the offering to hinder the stock's upward price progress for the near term, yet the ultimate result of the completed offering should actually be a greater level of institutional ownership interest. Regardless, even though the price is holding above its 50 DMA ($14.04), a significant break below there would be considered yet another more significant sell signal.
INFA was first featured on Wednesday, January 4th, 2006 in the CANSLIM.net Mid Day Breakouts Report (read here) as it was breaking out. Without much concern along the way, it enjoyed healthy post-breakout action up until now. Notes recently published on the stock included mention that a significant break below its upward trend line would be a sell signal. Sellers showed no mercy as it gapped down, violating its upward trendline which triggered the first clear technical sell signal. The bulls showed up and offered support at this stocks 50 DMA. This reinforces the importance of closely following CANSLIM.net and adhering to a strict sell discipline.

Mid-Day BreakOuts Report Helps Investors Recognize Winners! - Friday, January 27, 2006
Statistically, about 40% of winning stocks will pull back after breaking out. In other words, it is not uncommon for stocks to pullback and retest support near their pivot point after breaking out. It is important to see the bulls show up and offer support at or above the pivot point. This may offer investors a chance to increase their exposure before the stock continues advancing. However, an important caveat is that volume should contract as the stock pulls back towards its pivot point. Heavy volume behind losses can be cause for concern, especially if the stock does not find support at its pivot point. Whenever a recent breakout is completely negated by a loss that leads to a close back in the prior base, this is construed as a technical sell signal and a sign that the bears are regaining control.
Informatica Corp. (INFA +1.7 or +$10.03% to $15.25) gapped higher on Friday after reporting very strong earnings after Thursday's close. INFA was first featured on January 4th, 2006 in the CANSLIM.net's Mid-Day Breakouts Report (read here) at $12.83 as it was emerging from a solid 7-month base on above average volume. This issue was one of the first stocks to break out as the major averages moved higher at the start of 2006. After breaking out it is common for leading stocks to pull back and retest near their pivot point before continuing to new highs, and this stock held up well during its retesting period. The fundamentals of this stock are impressive, with a 99 EPS rank, the highest possible rating! It has enjoyed triple digit percentage increases in earnings in each of its past 4 consecutive quarterly comparisons. Revenue has also managed to accelerate, growing by a greater percentage increase in each of the past four quarterly comparisons. Prudent investors who consistently follow CANSLIM.net reports were able to take action and capitalize on its rise of nearly +18.86% as of Friday's close. It is not considered buyable within the proper guidelines now, of course, as it is important to remain disciplined and not chase stocks more than +5% above their pivot point.

Negative Reversals Are Worst When Volume Runs High - Monday, January 09, 2006
After a stock breaks out, it is imperative to continue monitoring its daily and weekly price and volume patterns for any possible ailments that may develop. Every so often, there are a few ominous technical signals that emerge. Prudent investors have learned to identify them due to the fact that they tend to lead to lower prices. One of these disconcerting technical signals is called a negative reversal.
A negative reversal occurs when a stock opens up the session heading higher but then reverses and ultimately closes lower. Reversals are often considered more severe if the stock's initial gains lift it to a new high, but it then reverses and closes for a loss on heavier than average volume and ends near the session's utmost lows. Negative reversals can occur on a daily, weekly and monthly chart. In general, the longer the time frame involved, the more concern is prompted by the severity of the reversal. Volume is directly correlated with the severity as well.
Informatica Corp. (INFA -$0.13 or -0.99% to $13.05) opened today's session headed higher, but the buying demand dried up and it ultimately ended the session lower. This stock was first featured on January 4th, 2006 in the CANSLIM.net Mid-Day Breakouts Report as it was breaking out of a solid six-month base on three times average volume (read here). The stock spent the next several sessions advancing before negatively reversing on Monday. However, one encouraging sign for the bulls is that volume did not swell behind the reversal, so the action shouldn't have yet prompted great concern. If the price falls back below the recent pivot point, and especially if volume swells behind any damaging losses, then this recent breakout would be totally negated and a technical sell signal would be triggered. Meanwhile, the stock's prior chart highs should be expected to act as a support level on any normal light volume retracement.

Breakout Encountering Some Resistance But Looks Good - Wednesday, January 04, 2006
A classic example of the success enjoyed by many CANSLIM.net readers usually starts when an investor reads a CANSLIM.net report and buys a featured stock before it has risen above the pivot point by greater than 5% (maximum buy price). After a stock breaks out above its pivot point, there is only a +5% window that investors have to purchase the stock under the proper guidelines. Once a stock rises above the "maximum buy price" the risk of a shake out balloons, meaning that even a normal retracement in the stock might force you to employ the 7-8% loss cutting rule. Much can be told by the stock's daily action in the weeks and months that follow a breakout. Typically, a light volume and orderly pullback suggests that the bulls remain in control. However, high volume pullbacks that violate support paint a totally different picture.
Informatica Corp. (INFA +$0.33 or +2.52% to $12.78) blasted out of a 5-month base on impressive volume today, triggering a technical buy signal. This stock was featured in today's (January 4, 2006) CANSLIM.net Mid-Day BreakOuts Report as it was moving above its pivot point (read here). It is important to adhere to the guidelines and not "chase" a stock by buying it +5% above its pivot point. That said, since the stock reversed from its intra-day high ($13.20) and closed in the middle to lower portion of today's range, the opportunity is there to accumulate shares within the +5% window between the pivot point and maximum buy price. However, the action today suggests that the stock was encountering some resistance as it tried to rally into new high ground. Greater concern would be prompted in the event of a more serious reversal leading to a close back in the stock's prior base, so be sure to follow the 7-8% stop loss rule, as always. It is the best way to reduce the possibility of even greater losses.
