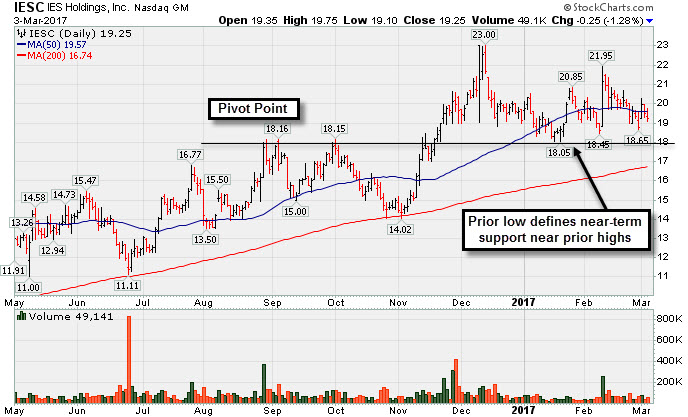
Recent Low Defines Support Near Prior Highs - Friday, March 3, 2017
I E S Holdings Inc's (IESC -$0.25 or -1.28% to $19.25) prior low ($18.05 on 1/18/17) defines important support near prior highs. It has been consolidating near its 50-day moving average (DMA) line. Its Relative Strength rating at 73 remains below the 80+ minimum guideline for buy candidates.
The high-ranked Building - Maintenance & Service firm was last shown in this FSU section on 1/19/17 with an annotated graph under the headline, "Violated 50-Day Moving Average Line and Now Testing Prior Highs". Recently it reported Dec '16 quarterly earnings -33% on +27% sales revenues, below the +25% minimum earnings guideline (C criteria), raising fundamental concerns. It had reported very strong Sep '16 quarterly sales revenues and earnings increases. It was highlighted in yellow in the 11/23/16 mid-day report as it returned to the Featured Stocks list while noted - "Fundamentals remain strong. Recent volume-driven gains helped it rally to new highs and above the new pivot point cited based on its 9/06/16 high plus 10 cents."
IESC showed bullish action after dropped from the Featured Stocks list on 10/27/16. Following damaging volume-driven losses it found support at its 200-day moving average (DMA) line. Members were previously reminded - "Under the fact-based system a stock which was previously sold can be bought back again if strength returns." The usual sell rules apply if a stock is repurchased, and in the Certification the teach investors to make a 10% larger purchase than on the prior entry.
Its strong earnings track record included 5 previous quarterly earnings increases above the +25% minimum earnings guideline (C criteria). In addition to that fact its sales revenues growth rate showed encouraging acceleration, helping it better match the fact-based investment system's guidelines. Annual earnings (A criteria) growth has been strong for the past 3 years.
Today it has a Timeliness rating of C, and its Sponsorship rating is currently a D. The number of top rated funds owning its shares rose from 52 in Dec '15 to 151 in Dec '16, a reassuring sign concerning the I criteria. Its small supply of only 21.5 million shares (S criteria) in the public float can contribute to greater price volatility in the event of institutional buying or selling
Charts used courtesy of www.stockcharts.com
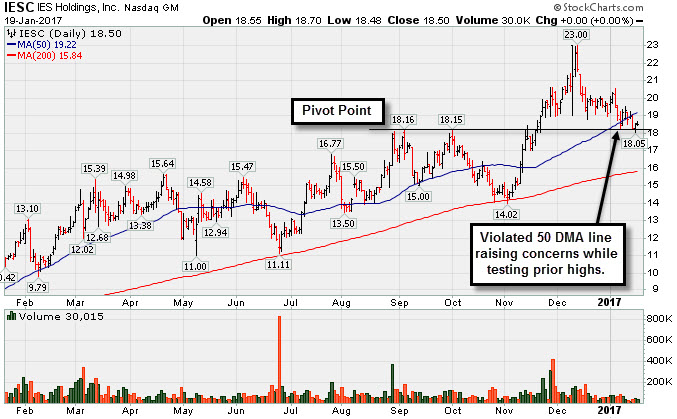
Violated 50-Day Moving Average Line and Now Testing Prior Highs - Thursday, January 19, 2017
I E S Holdings Inc (IESC $18.50) has recently posted small gains with light volume, remaining below its 50-day moving average (DMA) line. Prior highs in the $18 area define important support. More damaging losses would trigger a worrisome technical sell signal. Only a prompt rebound above the 50 DMA line ($19.22) would help its outlook improve. It was last shown in this FSU section on 12/21/16 with an annotated graph under the headline, "Consolidating After Strong Sep '16 Quarterly Earnings News".
The high-ranked Building - Maintenance & Service firm reported very strong Sep '16 quarterly sales revenues and earnings increases. It was highlighted in yellow in the 11/23/16 mid-day report as it returned to the Featured Stocks list while noted - "Fundamentals remain strong. Recent volume-driven gains helped it rally to new highs and above the new pivot point cited based on its 9/06/16 high plus 10 cents."
IESC showed bullish action after dropped from the Featured Stocks list on 10/27/16. Following damaging volume-driven losses it found support at its 200-day moving average (DMA) line. Members were previously reminded - "Under the fact-based system a stock which was previously sold can be bought back again if strength returns." The usual sell rules apply if a stock is repurchased, and in the Certification the teach investors to make a 10% larger purchase than on the prior entry.
Its strong earnings track record includes 5 consecutive quarterly earnings increase above the +25% minimum earnings guideline (C criteria). In addition to that fact its sales revenues growth rate showed encouraging acceleration, helping it better match the fact-based investment system's guidelines. Annual earnings (A criteria) growth has been strong for the past 3 years.
Today it has a Timeliness rating of B, and its Sponsorship rating is currently a C. The number of top rated funds owning its shares rose from 52 in Dec '15 to 144 in Dec '16, a reassuring sign concerning the I criteria. Its small supply of only 7.5 million shares (S criteria) in the public float can contribute to greater price volatility in the event of institutional buying or selling
Charts used courtesy of www.stockcharts.com
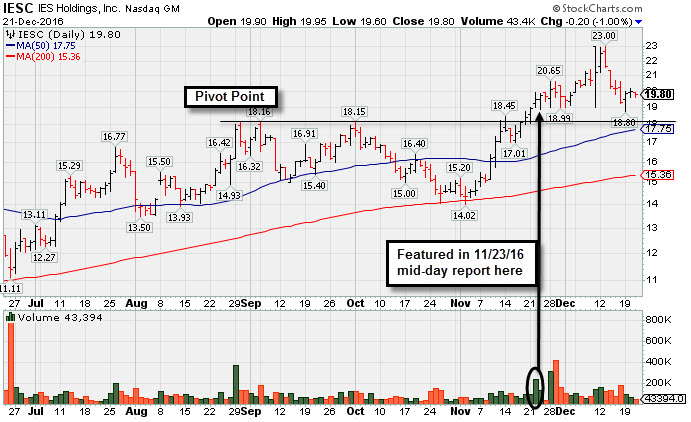
Consolidating After Strong Sep '16 Quarterly Earnings News - Wednesday, December 21, 2016
I E S Holdings Inc (IESC -$0.20 or -1.00% to $19.80) halted its slide with a noted "positive reversal" on 12/19/16 for a gain with near average volume. It is consolidating above its "max buy" level. Prior highs in the $18 area define initial support to watch. The high-ranked Building - Maintenance & Service firm reported very strong Sep '16 quarterly sales revenues and earnings increases. It was last shown in this FSI section on 11/23/16 with an annotated graph under the headline, "Strength Returned for Previously Featured Leader". It was highlighted in yellow as it returned to the Featured Stocks list that day while noted - "Fundamentals remain strong. Recent volume-driven gains helped it rally to new highs and above the new pivot point cited based on its 9/06/16 high plus 10 cents."
IESC showed bullish action after dropped from the Featured Stocks list on 10/27/16. Following damaging volume-driven losses it found support at its 200-day moving average (DMA) line. Members were previously reminded - "Under the fact-based system a stock which was previously sold can be bought back again if strength returns." The usual sell rules apply if a stock is repurchased, and in the Certification the teach investors to make a 10% larger purchase than on the prior entry.
Its strong earnings track record includes 5 consecutive quarterly earnings increase above the +25% minimum earnings guideline (C criteria). In addition to that fact its sales revenues growth rate showed encouraging acceleration, helping it better match the fact-based investment system's guidelines. Annual earnings (A criteria) growth has been strong for the past 3 years.
Today it has a Timeliness rating of B, and its Sponsorship rating is currently a C. The number of top rated funds owning its shares rose from 52 in Dec '15 to 141 in Sep '16, a reassuring sign concerning the I criteria. Its small supply of only 7.5 million shares (S criteria) in the public float can contribute to greater price volatility in the event of institutional buying or selling
Charts used courtesy of www.stockcharts.com
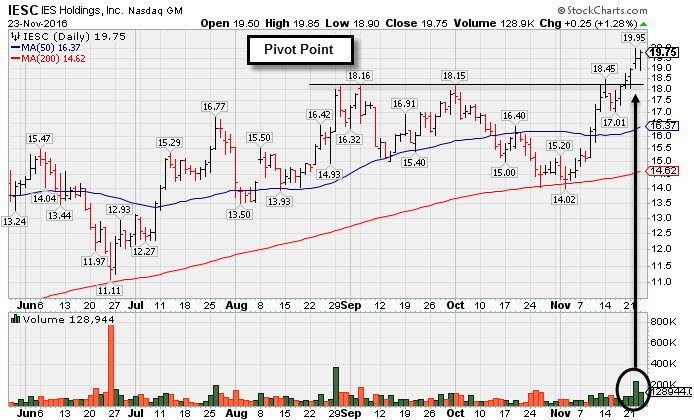
Strength Returned for Previously Featured Leader - Wednesday, November 23, 2016
I E S Holdings Inc (IESC +$0.25 or +1.28% to $19.75) was highlighted in yellow as it returned to the Featured Stocks list. Fundamentals remain strong. Recent volume-driven gains helped it rally to new highs and above the new pivot point cited based on its 9/06/16 high plus 10 cents.
IESC was last shown in this FSU section on 9/27/16 with an annotated graph under the headline, "Wedging Higher With Recent Gains Lacking Great Volume". It subsequently slumped below its 50-day moving average (DMA) line and then met resistance at that short term average when trying to rebound. It showed bullish action after dropped from the Featured Stocks list on 10/27/16. Following damaging volume-driven losses it found support at its 200-day moving average (DMA) line. Members were previously reminded - "Under the fact-based system a stock which was previously sold can be bought back again if strength returns." The usual sell rules apply if a stock is repurchased, and in the Certification the teach investors to make a 10% larger purchase than on the prior entry.
The high-ranked Building - Maintenance & Service firm reported Jun '16 quarterly earnings +79% on +25% sales revenues, continuing its strong earnings track record. That marked its 4th consecutive quarterly earnings increase above the +25% minimum earnings guideline (C criteria) in addition to the fact its sales revenues growth rate showed encouraging acceleration, helping it better match the fact-based investment system's guidelines. Annual earnings (A criteria) growth has been strong for the past 3 years.
Today it has a Timeliness rating of A, but its Sponsorship rating is currently a D. The number of top rated funds owning its shares rose from 53 in Dec '15 to 141 in Sep '16, a reassuring sign concerning the I criteria. Its small supply of only 7.5 million shares (S criteria) in the public float can contribute to greater price volatility in the event of institutional buying or selling
Charts used courtesy of www.stockcharts.com
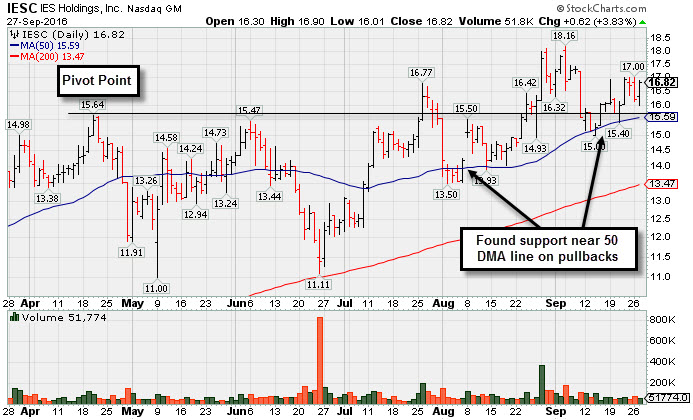
Wedging Higher With Recent Gains Lacking Great Volume - Tuesday, September 27, 2016
I E S Holdings Inc (IESC -$0.62 or -3.83% to $16.82) has been wedging higher with gains lacking great volume conviction after recently finding support at its 50-day moving average (DMA) line ($15.59). That short-term average and the prior low ($15.00 on 9/14/16) define near-term support.
IESC was last shown in this FSU section on 8/30/16 with an annotated graph under the headline, "Strength Returned With Heavier Volume Gains for Highs", pulling back after hitting new highs above its "max buy" level with a considerable gain backed by +270% above average volume on the prior session.
Members were previously reminded - "Under the fact-based system a stock which was previously sold can be bought back again if strength returns." The usual sell rules apply if a stock is repurchased, and in the Certification the teach investors to make a 10% larger purchase than on the prior entry.
IESC was shown in this FSU section on 7/26/16 with an annotated graph under the headline, "Volume-Driven Gain for New Highs Clinched Technical Buy Signal". It cleared the pivot point cited based on its 4/20/16 high plus 10 cents. Subsequent losses raised concerns for investors and likely triggered the fact-based investment system's sell rule at -7% from the purchase price. It slumped in the prior base and undercut its 50-day moving average (DMA) line before finding support. It gapped up on 8/08/16.
The high-ranked Building - Maintenance & Service firm reported Jun '16 quarterly earnings +79% on +25% sales revenues, continuing its strong earnings track record. That marked its 4th consecutive quarterly earnings increase above the +25% minimum earnings guideline in addition to the fact its sales revenues growth rate showed encouraging acceleration, helping it better match the fact-based investment system's guidelines. Annual earnings (A criteria) growth has been strong for the past 3 years.
Today it has a Timeliness rating of A, but its Sponsorship rating is currently a D. It found support at its 200-day moving average (DMA) line and rebounded after previously dropped from the Featured Stocks list on 6/21/16. The number of top rated funds owning its shares rose from 52 in Jun '15 to 123 in Jun '16, a reassuring sign concerning the I criteria. Its small supply of only 7.51 million shares (S criteria) in the public float can contribute to greater price volatility in the event of institutional buying or selling
Charts used courtesy of www.stockcharts.com
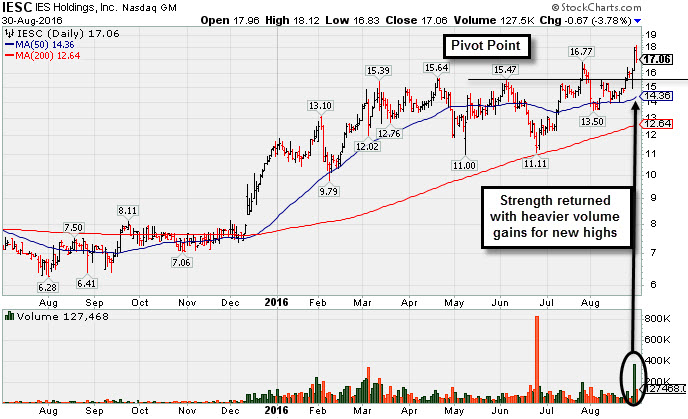
Strength Returned With Heavier Volume Gains for Highs - Tuesday, August 30, 2016
I E S Holdings Inc (IESC -$0.67 or -3.78% to $17.06) pulled back today after hitting new highs above its "max buy" level with a considerable gain backed by +270% above average volume on the prior session. Members were recently reminded - "Under the fact-based system a stock which was previously sold can be bought back again if strength returns." The usual sell rules apply if a stock is repurchased, and in the Certification the teach investors to make a 10% larger purchase than on the prior entry.
IESC was last shown in this FSU section on 7/26/16 with an annotated graph under the headline, "Volume-Driven Gain for New Highs Clinched Technical Buy Signal". It cleared the pivot point cited based on its 4/20/16 high plus 10 cents. Subsequent losses raised concerns for investors and likely triggered the fact-based investment system's sell rule at -7% from the purchase price. It slumped in the prior base and undercut its 50-day moving average (DMA) line before finding support. It gapped up on 8/08/16.
The high-ranked Building - Maintenance & Service firm reported Jun '16 quarterly earnings +79% on +25% sales revenues, continuing its strong earnings track record. That marked its 4th consecutive quarterly earnings increase above the +25% minimum earnings guideline in addition to the fact its sales revenues growth rate showed encouraging acceleration, helping it better match the fact-based investment system's guidelines. Annual earnings (A criteria) growth has been strong for the past 3 years.
Today it has a Timeliness rating of A, but its Sponsorship rating is currently a D. It found support at its 200-day moving average (DMA) line and rebounded after previously dropped from the Featured Stocks list on 6/21/16. The number of top rated funds owning its shares rose from 52 in Jun '15 to 115 in Jun '16, a reassuring sign concerning the I criteria. Its small supply of only 7.51 million shares (S criteria) in the public float can contribute to greater price volatility in the event of institutional buying or selling
Charts used courtesy of www.stockcharts.com
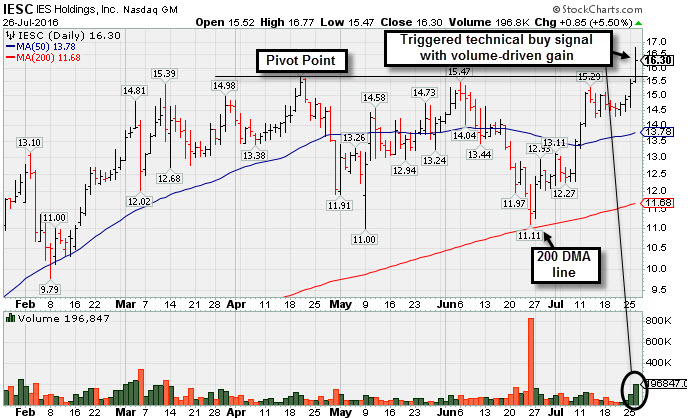
Volume-Driven Gain for New Highs Clinched Technical Buy Signal - Tuesday, July 26, 2016
I E S Holdings Inc (IESC +$0.85 or +5.50% to $16.30) Finished strong today after highlighted in yellow with pivot point cited based on its 4/20/16 high plus 10 cents. The gain for new highs (N criteria) helped it rise above the pivot point backed by +140% above average volume and clinch a new technical buy signal. Fundamentals remain strong and it found support at its 200-day moving average (DMA) line and rebounded after dropped from the Featured Stocks list on 6/21/16. Today it has a Timeliness rating of A, but its Sponsorship rating is currently a D.
The high-ranked Building - Maintenance & Service firm was last shown in this FSU section on 6/06/16 with an annotated graph under then headline, "Perched Within Striking Distance of New Highs". It is due to report earnings on 8/07/16 for the latest quarter. It reported earnings +88% on +20% sales revenues for the Mar '16 quarter, marking its 3rd consecutive quarterly earnings increase above the +25% minimum earnings guideline and helping it better match the fact-based investment system's guidelines. Annual earnings (A criteria) growth has been strong for the past 3 years.
The number of top rated funds owning its shares rose from 52 in Jun '15 to 87 in Jun '16, a reassuring sign concerning the I criteria. The current Up/Down Volume Ratio of 0.7 is an unbiased indication its shares have been under some distributional pressure over the past 50 days. Its small supply of only 7.52 million shares (S criteria) in the public float can contribute to greater price volatility in the event of institutional buying or selling
Charts used courtesy of www.stockcharts.com
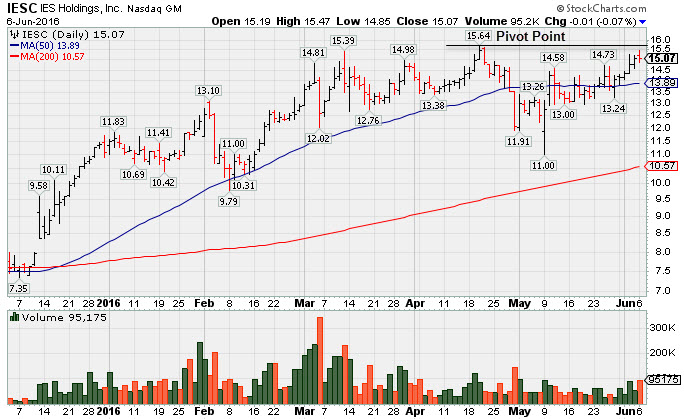
Perched Within Striking Distance of New Highs - Monday, June 6, 2016
I E S Holdings Inc (IESC -$0.01 or -0.07% to $15.07) finished unchanged after challenging its 52-week high. It was highlighted in yellow with pivot point based on its 4/20/16 high plus 10 cents in the the earlier mid-day report (read here). Disciplined investors will watch for volume-driven gains above the pivot point for new highs (N criteria) which are still needed to trigger a technical buy signal.
The high-ranked Building - Maintenance & Service firm reported earnings +88% on +20% sales revenues for the Mar '16 quarter, marking its 3rd consecutive quarterly earnings increase above the +25% minimum earnings guideline and helping it better match the fact-based investment system's guidelines. Annual earnings (A criteria) growth has been strong for the past 3 years.
The number of top rated funds owning its shares rose from 52 in Jun '15 to 68 in Mar '16, a reassuring sign concerning the I criteria. The current Up/Down Volume Ratio of 1.7 is an unbiased indication its shares have been under accumulation over the past 50 days. Its small supply of only 7.5 million shares (S criteria) in the public float can contribute to greater price volatility in the event of institutional buying or selling