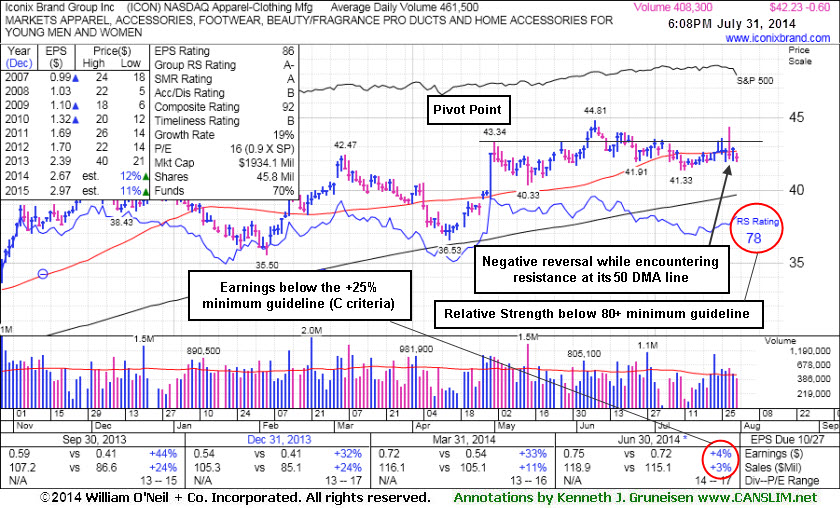
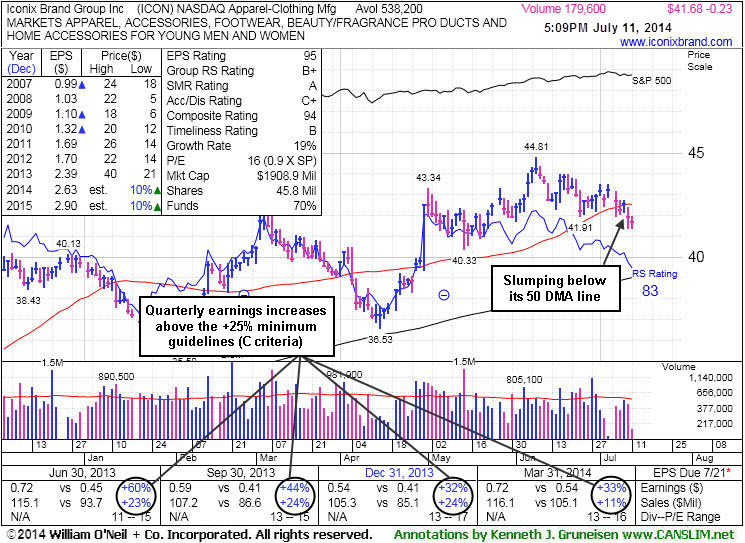
Iconix Brand Group Inc (ICON -$0.23 or -0.55% to $41.68) encountered resistance near its 50-day moving average (DMA) recently and there was a "negative reversal" on 7/29/14. It reported earnings +4% on +3% sales revenues for the Jun '14 quarter, below the +25% minimum earnings guideline (C criteria), raising fundamental concerns. Its Relative Strength rating has slumped below the 80+ minimum guideline for buy candidates under the fact-based system and it faces resistance due to overhead supply up through the $44 level which may hinder its ability to rally. More damaging losses undercutting prior lows ($41.33 on 7/10/14) would raise greater concerns and trigger a more worrisome technical sell signal.
The stock was last shown in this FSU section on 7/11/14 with annotated graphs under the headline, "Slump Below 50-Day Moving Average Line Hurt Outlook". Disciplined investors limit losses while they are small by always selling if any stock falls more than -7% from their purchase price.
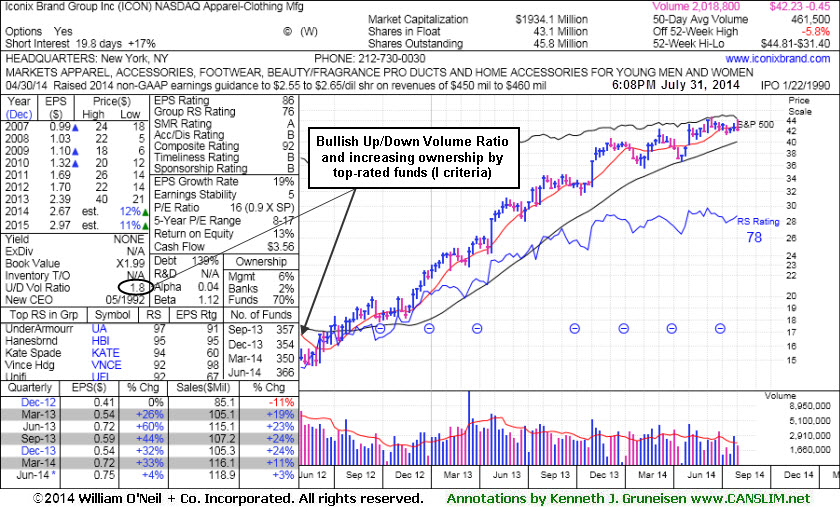
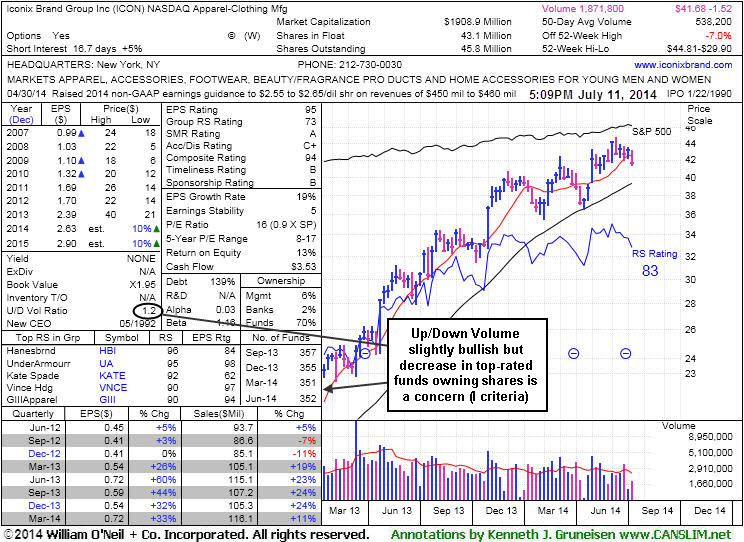
The high-ranked Apparel - Clothing Manufacturing firm's annual earnings (A criteria) history has been steady. The number of top-rated funds owning its shares fell from 357 in Sep '13 to 366 in Jun '14, not a reassuring sign concerning the I criteria. However, its current Up/Down Volume Ratio of 1.8 is a unbiased indication its shares have been under accumulation over the past 50 days.
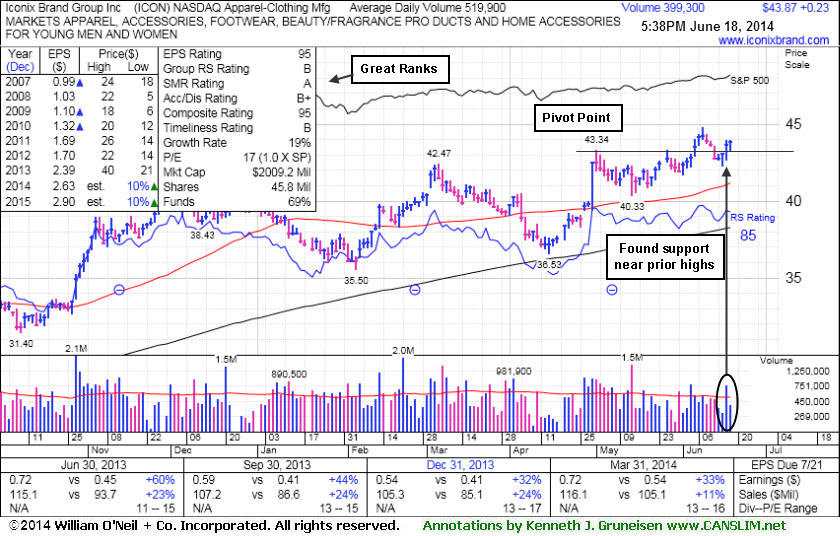
The stock was last shown in this FSU section on 6/18/14 with annotated graphs under the headline, "Found Support Above Prior Highs During Consolidation". It made little headway following its recent technical breakout and stalled after rallying above prior highs in the $42 area. Disciplined investors limit losses while they are small by always selling if any stock falls more than -7% from their purchase price.
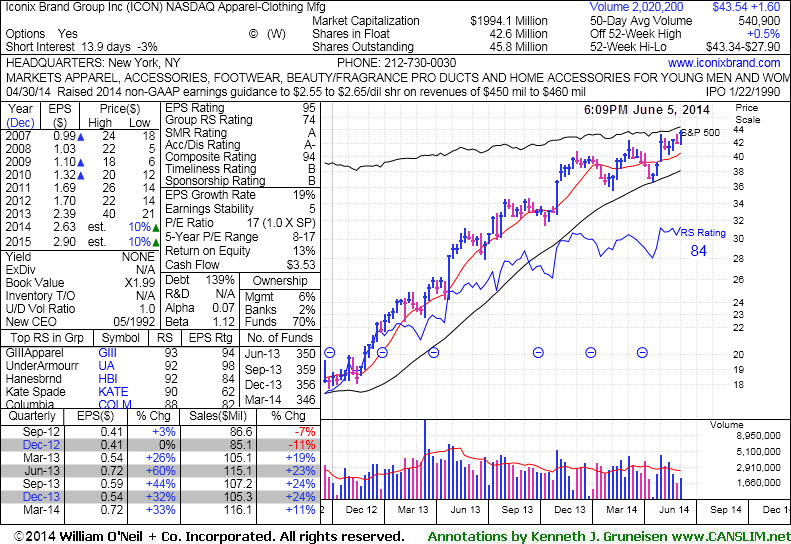
It reported earnings +33% on +11% sales revenues for the Mar '14 quarter, continuing its streak of earning increases above the +25% minimum guideline (C criteria). Fundamentals remain strong for the high-ranked Apparel - Clothing Manufacturing firm. Its annual earnings (A criteria) history has been steady. It has earned a 95 Earnings Per Share Rating (EPS) which suggests that its recent earnings growth history has been stellar. Its Relative Strength rating is 83, above the 80+ minimum rank for buy candidates under the fact-based system. The number of top-rated funds owning its shares fell from 357 in Sep '13 to 352 in Jun '14, not a reassuring sign concerning the I criteria. However, its current Up/Down Volume Ratio of b is a unbiased indication its shares have seen some slight accumulation over the past 50 days.
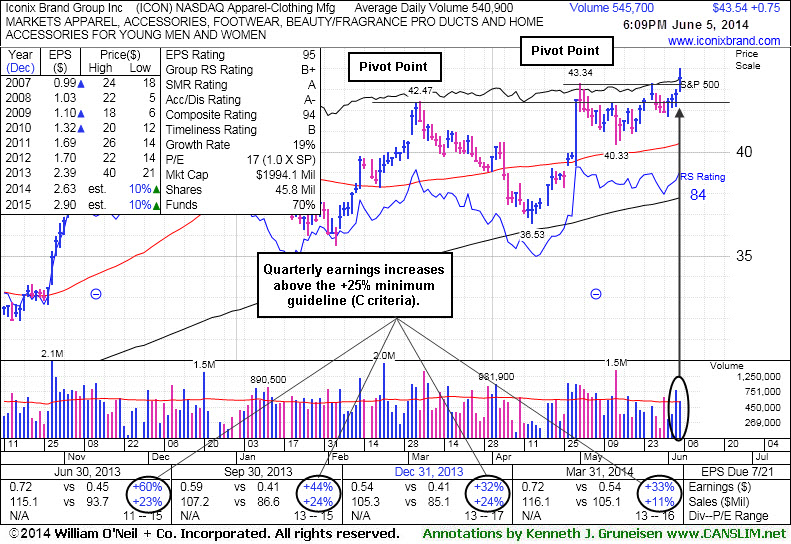
Iconix Brand Group Inc (ICON +$0.23 or +0.54% to $43.87) has made little headway following its recent technical breakout. It found support with a gain on heavy volume on 6/17/14 while consolidating above prior highs in the $43-42 area defining initial support to watch. The stock was last shown in this FSU section on 6/05/14 with annotated graphs under the headline, "Gain With Above Average Volume an Encouraging Sign "as it hit new all-time highs with gains backed by above average volume and triggered a new (or add-on) technical buy signal. It had stalled after rallying above prior high in the $42 area before, and the gain through $43 and $44 marked its first volume-backed gain above its previously cited pivot point.
Its 50-day moving average (DMA) line defines near-term support below its prior highs. A violation of that short-term average or would raise serious concerns and trigger a more worrisome technical sell signal. Disciplined investors avoid chasing stocks extended more than +5% above their pivot point, and they always sell if any stock falls more than -7% from their purchase price. Keep in mind that 3 out of 4 stocks tend to move in the same direction of the major averages (M criteria) and the broader market is strong.
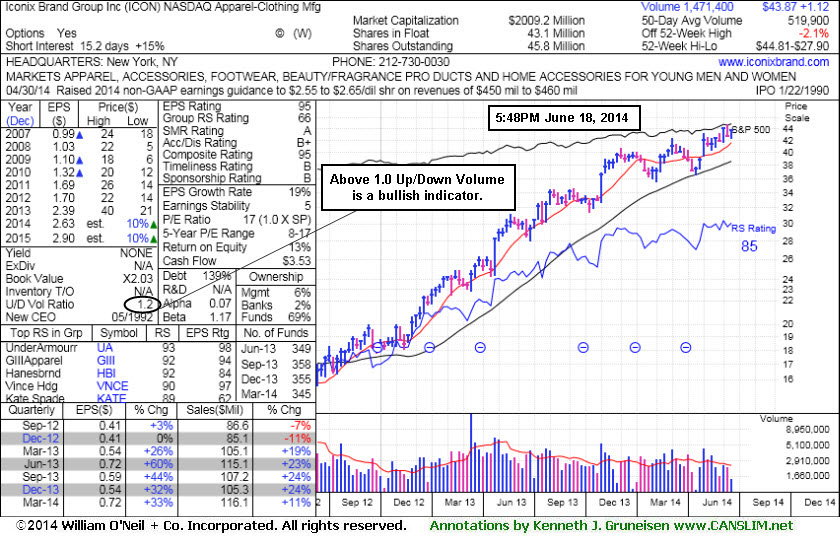
It reported earnings +33% on +11% sales revenues for the Mar '14 quarter, continuing its streak of earning increases above the +25% minimum guideline (C criteria). Fundamentals remain strong for the high-ranked Apparel - Clothing Manufacturing firm. Its annual earnings (A criteria) history has been steady. It has earned a 95 Earnings Per Share Rating (EPS) which suggests that its recent earnings growth history has been stellar. Its Relative Strength rating is 85, above the 80+ minimum rank for buy candidates under the fact-based system. The number of top-rated funds owning its shares fell from 359 in Sep '13 to 345 in Mar '14, not a reassuring sign concerning the I criteria.
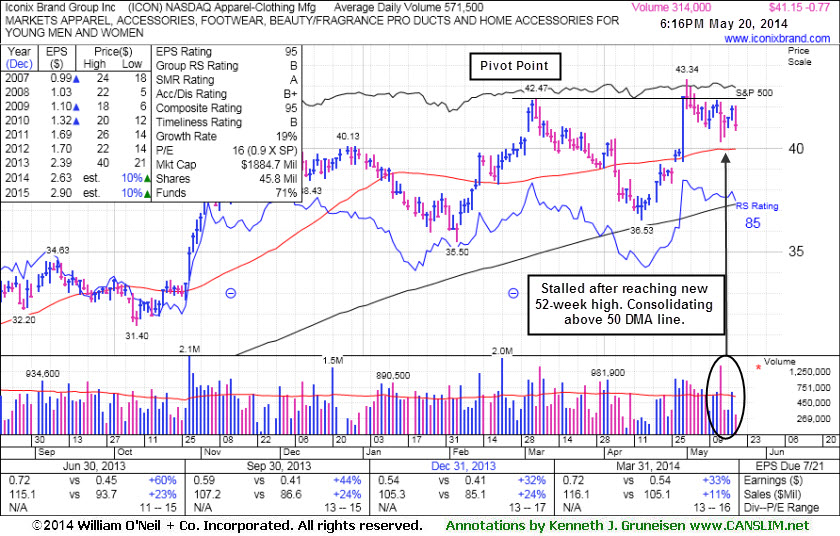
The stock was last shown in this FSU section on 5/20/14 with annotated graphs under the headline, "Consolidating Above 50 DMA Line Still Perched Near 52-Week High". Its 50-day moving average (DMA) line defines near-term support. A violation of that short-term average would raise concerns and trigger a technical sell signal. It reported earnings +33% on +11% sales revenues for the Mar '14 quarter, continuing its streak of earning increases above the +25% minimum guideline (C criteria).
A new pivot point has been cited based on its 5/01/14 high plus 10 cents as is has built a short "square box" base. Subsequent gains above the new pivot point with at least +40% above average volume would be a welcome reassurance it was attracting serious fresh institutional buying demand and triggering a new (or add-on) technical buy signal.
Keep in mind that 3 out of 4 stocks tend to move in the same direction of the major averages (M criteria) and the broader market is strong. Members are reminded that disciplined investors always limit losses by selling any stock that falls more than -7% from their purchase price.
Fundamentals remain strong for the high-ranked Apparel - Clothing Manufacturing firm. Its annual earnings (A criteria) history has been steady. It has earned a 95 Earnings Per Share Rating (EPS) which suggests that its recent earnings growth history has been stellar. Its Relative Strength rating is 84, above the 80+ minimum rank for buy candidates under the fact-based system. The number of top-rated funds owning its shares fell from 359 in Sep '13 to 346 in Mar '14, not a reassuring sign concerning the I criteria.
ICON stalled near its 52-week high following a considerable 4/30/14 volume-driven gain and finish near its pivot point. Confirming gains above the pivot point with at least +40% above average volume could trigger a new (or add-on) technical buy signal. Keep in mind that 3 out of 4 stocks tend to move in the same direction of the major averages (M criteria) and confirming gains from the major averages are still needed as reassurance the broader market is strong. Members are also reminded that disciplined investors always limit losses by selling any stock that falls more than -7% from their purchase price.
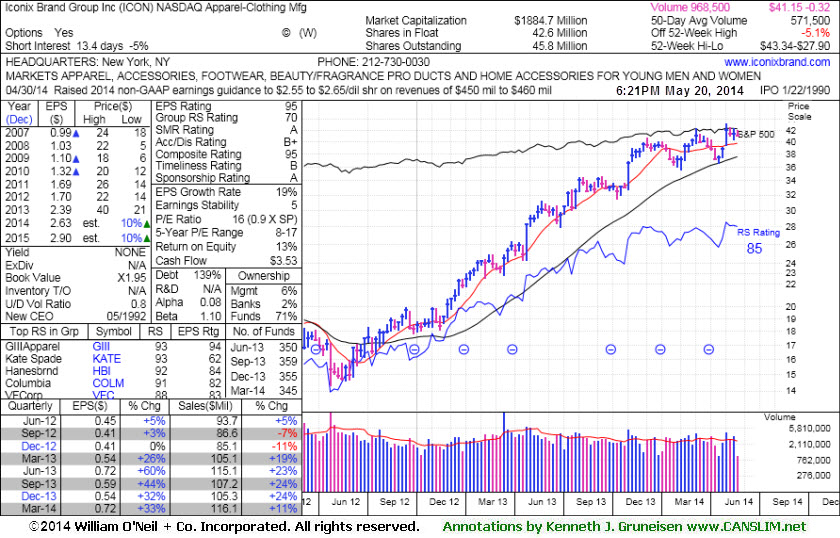
Fundamentals remain strong for the high-ranked Apparel - Clothing Manufacturing firm. Its annual earnings (A criteria) history has been steady. It has earned a 95 Earnings Per Share Rating (EPS) which suggests that its recent earnings growth history has been stellar. Its Relative Strength rating is 85, above the 80+ minimum rank for buy candidates under the fact-based system. The number of top-rated funds owning its shares fell from 359 in Sep '13 to 345 in Mar '14, not a reassuring sign concerning the I criteria.
Keep in mind that 3 out of 4 stocks tend to move in the same direction of the major averages (M criteria) and confirming gains from the major averages are still needed as reassurance the broader market is strong. Members are also reminded that disciplined investors always limit losses by selling any stock that falls more than -7% from their purchase price.
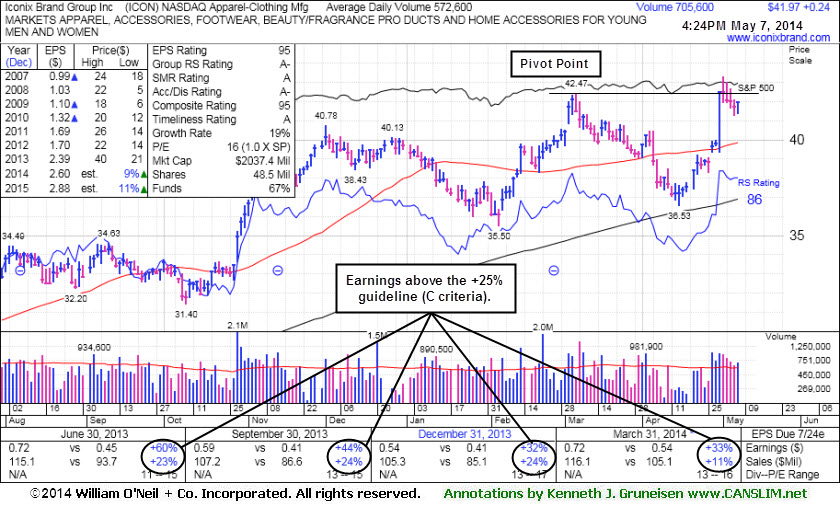
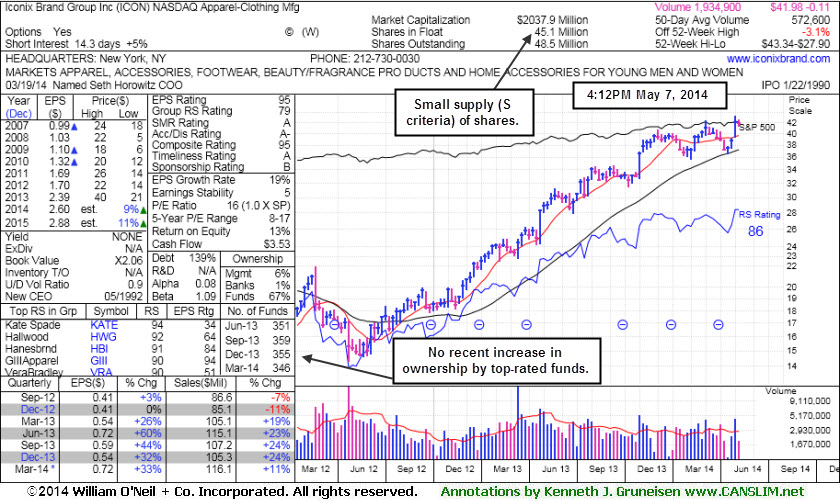
Fundamentals remain strong for the high-ranked Apparel - Clothing Manufacturing firm. ICON reported earnings +33% on +11% sales revenues for the quarter ended March 31, 2014 versus the year ago period marking its 5th consecutive quarterly earnings increase above the +25% guideline (C criteria). Its annual earnings (A criteria) history has been steady. It has earned a 95 Earnings Per Share Rating (EPS) which suggests that its recent earnings growth history has been stellar. Its Relative Strength rating is 86, above the 80+ minimum rank for buy candidates under the fact-based system.
The number of top-rated funds owning its shares fell from 359 in Sep '13 to 346 in Mar '14, not a reassuring sign concerning the I criteria. The stock has shown resilience and strength since last shown in this FSU section on 4/24/14 with annotated graphs under the headline, "Rebound Above 50-Day Average Needed to Improve Outlook".
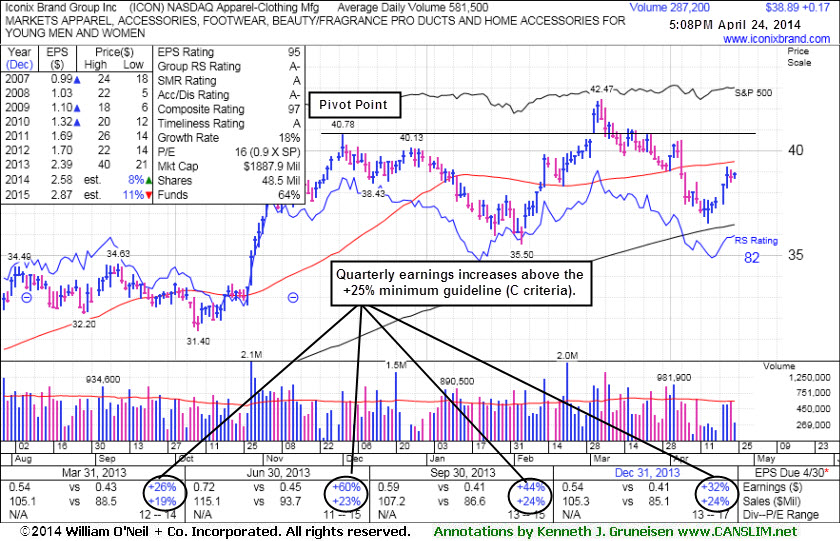
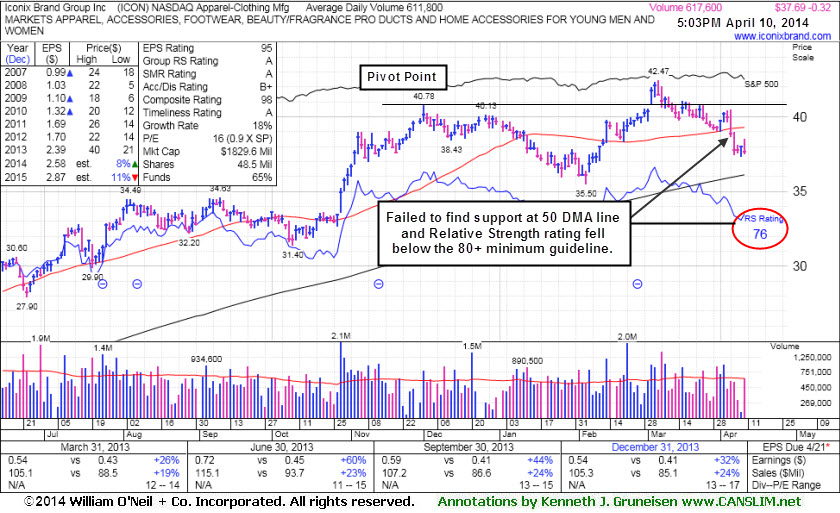
ICON was last shown in this FSU section on 4/10/14 with annotated graphs under the headline, "Violated 50-Day Average and Relative Strength Rank Fell", while a loss on higher (above average) volume indicated that it was encountering distributional pressure. Members were reminded - "Disciplined investors always limit losses by selling any stock that falls more than -7% from their purchase price."
After slumping back into its prior base weeks ago it also sank below its 50 DMA line raising more concerns and triggering a technical sell signal. The number of top-rated funds owning its shares fell from 359 in Sep '13 to 346 in Mar '14, not a reassuring sign concerning the I criteria.
Fundamentals remain strong for the high-ranked Apparel - Clothing Manufacturing firm. It reported earnings +32% on +24% sales revenues for the Dec '13 quarter, marking its 4th consecutive quarterly earnings increase above the +25% guideline (C criteria). Its annual earnings (A criteria) history has been steady.
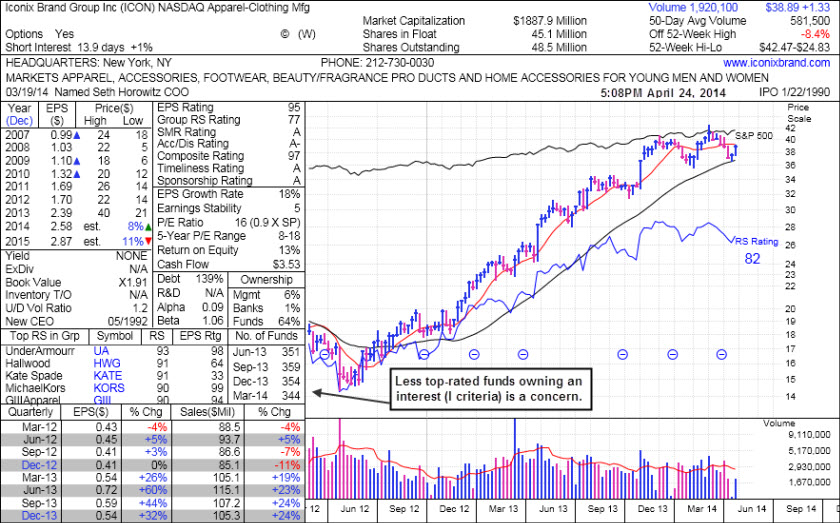
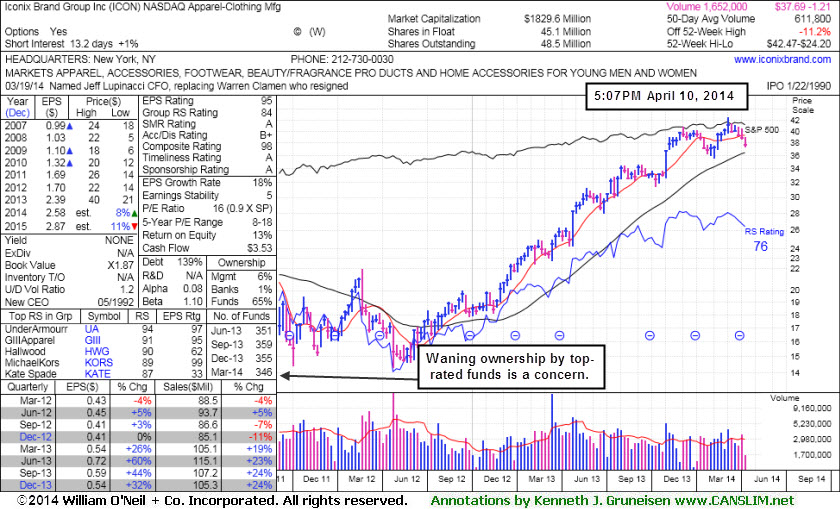
Iconix Brand Group Inc (ICON -$0.32 or -0.84% to $37.69) erased an early gain today and ended near the session low with a loss. After slumping back into its prior base weeks ago it had initially found support at its 50-day moving average (DMA) line. However, the recent deterioration below its 50 DMA line raised more concerns and triggered a technical sell signal. A rebound above the 50 DMA line would help its outlook. Meanwhile, its Relative Strength rating (see red circle on weekly graph below) has slumped to 76, below the 80+ minimum guideline for buy candidates. Also, the number of top-rated funds owning its shares fell from 359 in Sep '13 to 346 in Mar '14, not a reassuring sign concerning the I criteria.
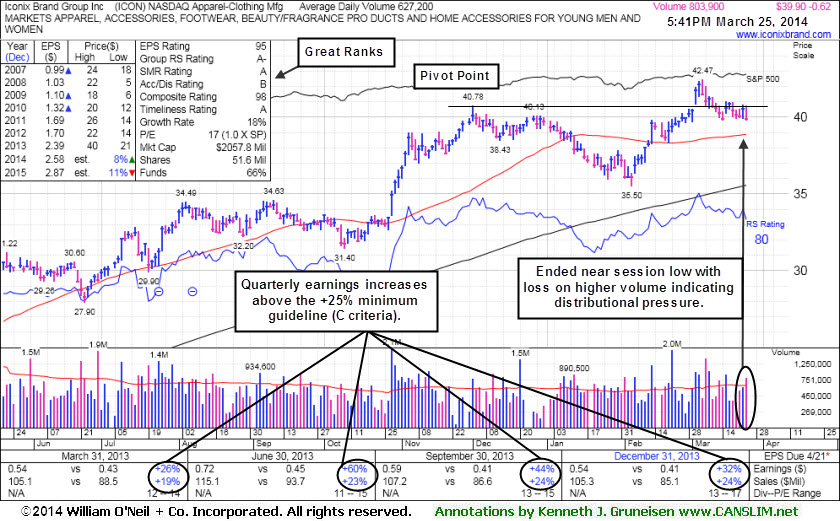
ICON was last shown in this FSU section on 3/25/14 with annotated graphs under the headline, "Falling Back Under Prior Highs Raises Concerns", while a loss on higher (above average) volume indicated that it was encountering distributional pressure. Members were reminded - "Disciplined investors always limit losses by selling any stock that falls more than -7% from their purchase price."
Fundamentals remain strong for the high-ranked Apparel - Clothing Manufacturing firm. It reported earnings +32% on +24% sales revenues for the Dec '13 quarter, marking its 4th consecutive quarterly earnings increase above the +25% guideline (C criteria). Its annual earnings (A criteria) history has been steady.
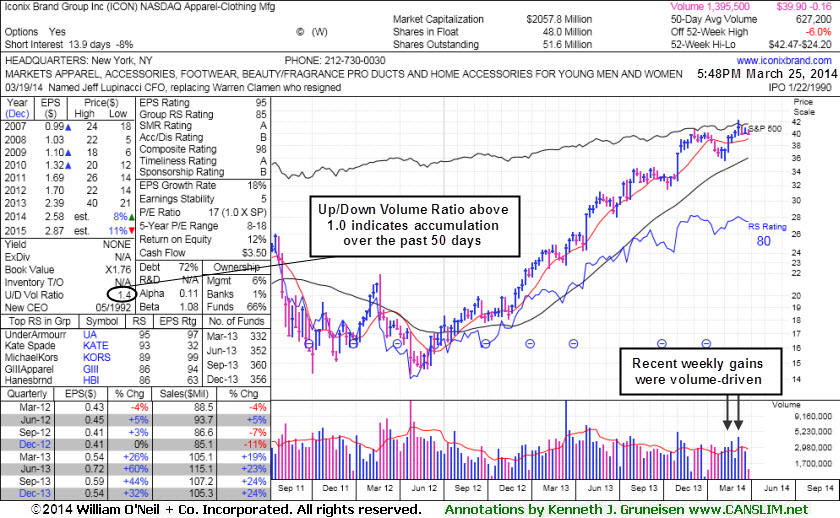
The weekly chart shows recent weekly gains were backed by above average volume. Its Up/Down Volume Ratio of 1.4 currently is an unbiased indication that shares have been under accumulation over the past 50 days. Disciplined investors always limit losses by selling any stock that falls more than -7% from their purchase price. It is consolidating above prior highs in the $40 area defining near-term support.
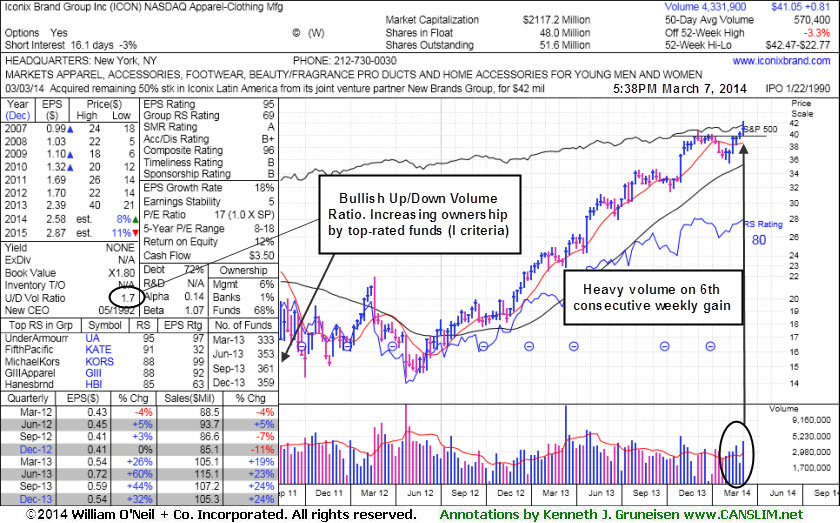
The high-ranked Apparel - Clothing Manufacturing firm reported earnings +32% on +24% sales revenues for the Dec '13 quarter, marking its 4th consecutive quarterly earnings increase above the +25% guideline (C criteria). Its annual earnings (A criteria) history has been steady. The number of top-rated funds owning its shares rose from 333 in Mar '13 to 356 in Dec '13, a reassuring sign concerning the I criteria.
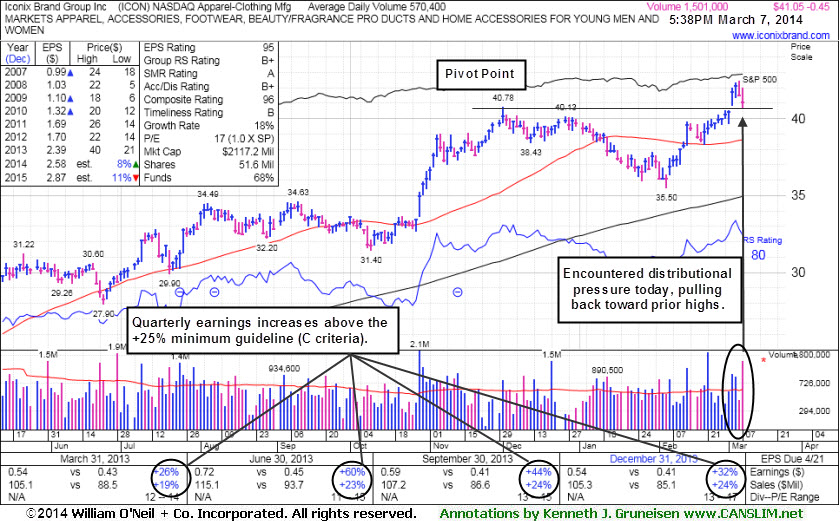
Iconix Brand Group Inc (ICON -$0.45 or -1.08% to $41.05) encountered distributional pressure and suffered a loss with above average volume on Friday after highlighted in yellow with pivot point cited based on its 12/02/13 high plus 10 cents in the earlier mid-day report (read here). The weekly chart shows it was the 6th consecutive weekly gain, and it has the look of a riskier "late-stage" base. Disciplined investors always limit losses by selling any stock that falls more than -7% from their purchase price. It is consolidating above prior highs in the $40 area defining near-term support.
Technically, on 3/04/14 it gapped up for a volume-driven breakout to new high territory. No resistance remains due to overhead supply so it is free to rally unhindered by anxious sellers hoping to break even on a losing trade. The high-ranked Apparel - Clothing Manufacturing firm reported earnings +44% on +24% sales revenues for the Sep '13 quarter, marking its 3rd consecutive quarterly earnings increase above the +25% guideline (C criteria). Its annual earnings (A criteria) history has been steady. The 12/13/13 mid-day report last noted - "Patient investors may watch for a new base of secondary buy point to possibly develop and be noted in the weeks ahead."
The number of top-rated funds owning its shares rose from 333 in Mar '13 to 359 in Dec '13, a reassuring sign concerning the I criteria. Its current Up/Down Volume Ratio of 1.7 is an unbiased indication that its shares have been under accumulation over the past 50 days.