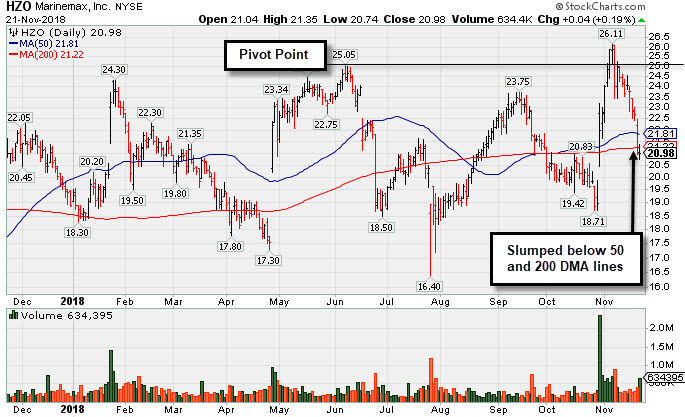
Negated Recent Breakout and Slumped Below 200 Day Average - Wednesday, November 21, 2018
Marinemax Inc (HZO +$0.04 or +0.19% to $20.98) has slumped below its 50-day and 200-day moving average (DMA) lines raising concerns. Disciplined investors always limit losses by selling any stock that falls more than -7% from their purchase price. It will be dropped from the Featured Stocks list tonight. A rebound above the 50 DMA line is needed for its outlook to improve.
HZO was highlighted in yellow with pivot point cited based on its 6/07/18 high plus 10 cents in the 11/02/18 mid-day report (read here) and shown that evening with an annotated graph under the headline, "Boat Retailer Has Strong Earnings History".
Recently it reported Sep '18 earnings +105% on +23% sales revenues, its 4th consecutive quarter with a big earnings increase more than the +25% minimum (C criteria) versus the year ago period. Sales revenues growth has shown encouraging acceleration in sequential quarterly comparisons versus the year ago periods. Its annual earnings (A criteria) history has been strong and steady.
Recently it reported Sep '18 earnings +105% on +23% sales revenues, its 4th consecutive quarter with a big earnings increase more than the +25% minimum (C criteria) versus the year ago period. Sales revenues growth has shown encouraging acceleration in sequential quarterly comparisons versus the year ago periods. Its annual earnings (A criteria) history has been strong and steady.
The number of top-rated funds owning its shares rose from 250 in Dec '17 to 280 in Sep '18, a reassuring sign concerning the I criteria. The current Up/Down Volume Ratio of 1.0 is an unbiased indication its shares have been neutral concerning accumulation/distribution over the past 50 days. Its Timeliness Rating is A and Sponsorship Rating is B.
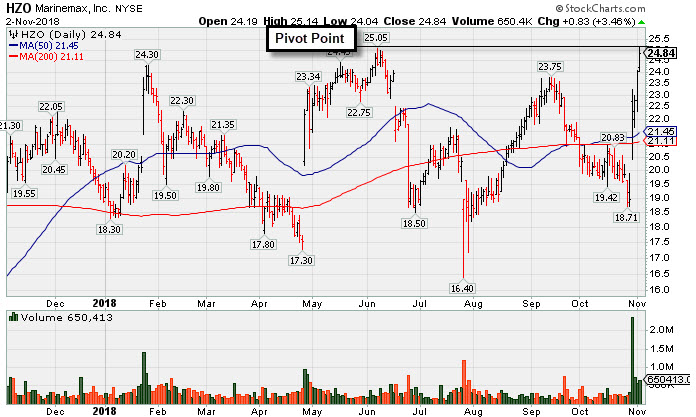
Boat Retailer Has Strong Earnings History - Friday, November 2, 2018
Marinemax Inc (HZO +$0.83 or +3.46% to $24.84) was highlighted in yellow with pivot point cited based on its 6/07/18 high plus 10 cents in the earlier mid-day report (read here). It rebounded above its 50-day moving average (DMA) line with a streak of volume-driven gains this week. Subsequent gains and a strong close above the pivot point backed by at least +40% above average volume may trigger a technical buy signal.
Recently it reported Sep '18 earnings +105% on +23% sales revenues, its 4th consecutive quarter with a big earnings increase more than the +25% minimum (C criteria) versus the year ago period. Sales revenues growth has shown encouraging acceleration in sequential quarterly comparisons versus the year ago periods. Its annual earnings (A criteria) history has been strong and steady.
Recently it reported Sep '18 earnings +105% on +23% sales revenues, its 4th consecutive quarter with a big earnings increase more than the +25% minimum (C criteria) versus the year ago period. Sales revenues growth has shown encouraging acceleration in sequential quarterly comparisons versus the year ago periods. Its annual earnings (A criteria) history has been strong and steady.
The number of top-rated funds owning its shares rose from 250 in Dec '17 to 279 in Sep '18, a reassuring sign concerning the I criteria. The current Up/Down Volume Ratio of 1.4 is an unbiased indication its shares have been under accumulation over the past 50 days. Its Timeliness Rating is A and Sponsorship Rating is B.