50-Day Moving Average Violation Triggered Technical Sell Signal - Tuesday, April 5, 2022
Hovering Near High After Rising From Prior Base - Tuesday, March 15, 2022
Extended From Prior Base After 6th Consecutive Gain - Friday, February 18, 2022
Bullish Action Followed Another Strong Quarterly Report -
50-Day Moving Average Violation Triggered Technical Sell Signal - Tuesday, April 5, 2022
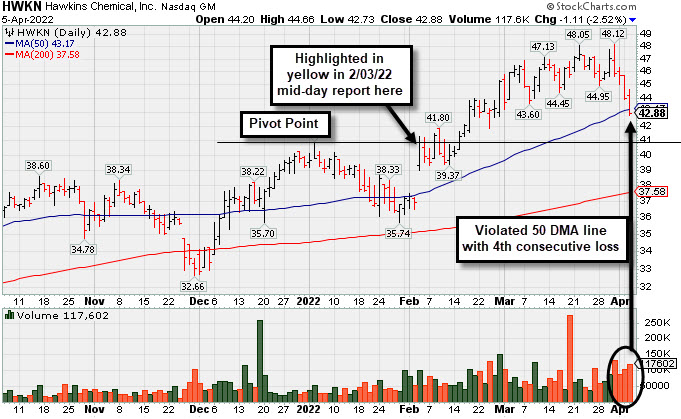
Hawkins Inc (HWKN -$1.11 or -2.52% to $42.88) violated its 50-day moving average (DMA) line today triggering a technical sell signal as it suffered a 4th consecutive loss with above average volume after a noted "negative reversal" at its all-time high. Only a prompt rebound above the 50 DMA line would help its outlook improve.
HWKN was highlighted in yellow with pivot point cited based on its 1/04/22 high plus 10 cents in the 2/03/22 mid-day report (read here). It was last covered in greater detail on 3/15/22 with an annotated graph under the headline, "Hovering Near High After Rising From Prior Base".
Bullish action came after it reported Dec '21 quarterly earnings +26% on +31% sales revenues versus the year ago period. Three of the 4 latest quarterly comparisons showed earnings increases above the +25% minimum guideline (C criteria) with a strong sales revenues growth rate. Annual earnings growth (A criteria) has been strong after a downturn in FY '18. It has an Earnings Per Share Rating of 91.
There are only 21.1 million shares outstanding (S criteria) which contribute to greater price volatility in the event of institutional buying or selling. The number of top-rated funds owning its shares rose from 326 in Mar '21 to 343 in Dec '21, a reassuring sign concerning the I criteria. The current Up/Down Volume Ratio of 0.9 is an unbiased indication its shares have been under distributional pressure over the past 50 days. The company hails from the CHEMICALS - Basic Chemicals industry group which is currently ranked 60th on the 187 Industry Groups list (L criteria). It has a Timeliness Rating of B and Sponsorship Rating of B.
Hovering Near High After Rising From Prior Base - Tuesday, March 15, 2022
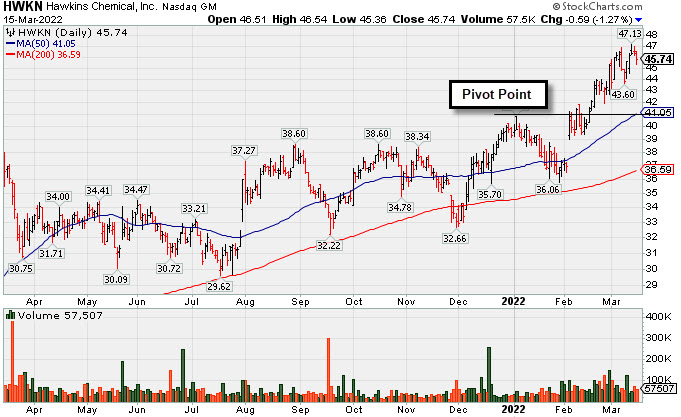
Hawkins Inc (HWKN -$0.59 or -1.27% to $45.74) is hovering near its all-time high, extended from any sound base. Prior highs in the $40 area coincide with its 50-day moving average (DMA) line defining important near-term support to watch on pullbacks.
HWKN was highlighted in yellow with pivot point cited based on its 1/04/22 high plus 10 cents in the 2/03/22 mid-day report (read here). It was last covered in greater detail on 2/18/22 with an annotated graph under the headline, "Extended From Prior Base After 6th Consecutive Gain".
Bullish action came after it reported Dec '21 quarterly earnings +26% on +31% sales revenues versus the year ago period. Three of the 4 latest quarterly comparisons showed earnings increases above the +25% minimum guideline (C criteria) with a strong sales revenues growth rate. Annual earnings growth (A criteria) has been strong after a downturn in FY '18. It has an Earnings Per Share Rating of 91.
There are only 21.1 million shares outstanding (S criteria) which contribute to greater price volatility in the event of institutional buying or selling. The number of top-rated funds owning its shares rose from 326 in Mar '21 to 340 in Dec '21, a reassuring sign concerning the I criteria. The current Up/Down Volume Ratio of 1.3 is an unbiased indication its shares have been under accumulation over the past 50 days. The company hails from the CHEMICALS - Basic Chemicals industry group which is currently ranked 28th on the 187 Industry Groups list (L criteria). It has a Timeliness Rating of A and Sponsorship Rating of B.
Extended From Prior Base After 6th Consecutive Gain - Friday, February 18, 2022
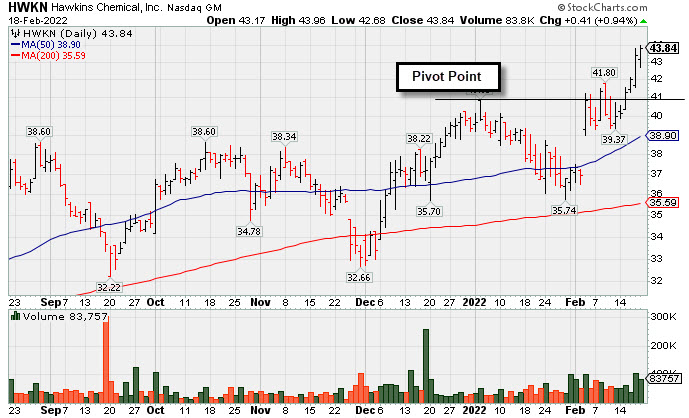
Hawkins Inc (HWKN +$0.41 or +0.94% to $43.84) posted a 6th consecutive gain today with above average volume as it hit another new all-time high. It is extended from prior highs in the $40 area which define initial support above its 50-day moving average DMA line ($39.02).
Bullish action came after it reported Dec '21 quarterly earnings +26% on +31% sales revenues versus the year ago period. Three of the 4 latest quarterly comparisons showed earnings increases above the +25% minimum guideline (C criteria) with a strong sales revenues growth rate. Annual earnings growth (A criteria) has been strong after a downturn in FY '18. It has an Earnings Per Share Rating of 90.
There are only 21.1 million shares outstanding (S criteria) which contribute to greater price volatility in the event of institutional buying or selling. The number of top-rated funds owning its shares rose from 326 in Mar '21 to 338 in Dec '21, a reassuring sign concerning the I criteria. The current Up/Down Volume Ratio of 2.0 is an unbiased indication its shares have been under accumulation over the past 50 days. The company hails from the CHEMICALS - Basic Chemicals industry group which is currently ranked 25th on the 187 Industry Groups list (L criteria). It has a Timeliness Rating of B and Sponsorship Rating of C.
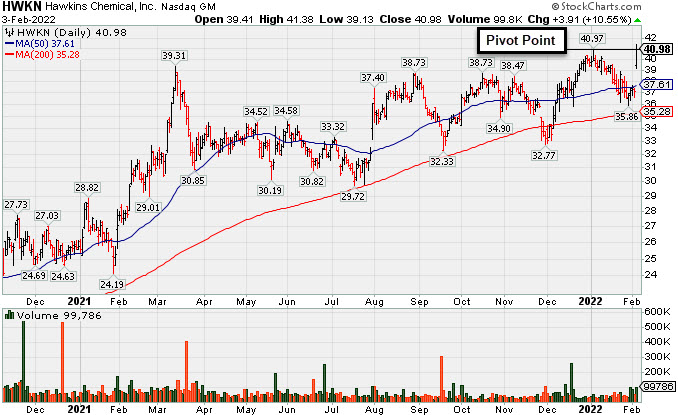
Bullish Action Followed Another Strong Quarterly Report -
Hawkins Inc (HWKN +$3.91 or +10.55% to $40.98) was highlighted in yellow with pivot point cited based on its 1/04/22 high plus 10 cents in the earlier mid-day report (read here). It gapped up today rebounding above its 50-day moving average (DMA) line ($37.59) and hitting a new all-time high. Subsequent gains and a strong close above the pivot point backed by at least +40% above average volume may trigger a convincing technical buy signal.
Bullish action came after it reported Dec '21 quarterly earnings +26% on +31% sales revenues versus the year ago period. Three of the 4 latest quarterly comparisons showed earnings increases above the +25% minimum guideline (C criteria) with a strong sales revenues growth rate. Annual earnings growth (A criteria) has been strong after a downturn in FY '18. It has an Earnings Per Share Rating of 89.
There are only 21.1 million shares outstanding (S criteria) which contribute to greater price volatility in the event of institutional buying or selling. The number of top-rated funds owning its shares rose from 326 in Mar '21 to 340 in Dec '21, a reassuring sign concerning the I criteria. The current Up/Down Volume Ratio of 1.7 is an unbiased indication its shares have been under accumulation over the past 50 days. The company hails from the CHEMICALS - Basic Chemicals industry group which is currently ranked 59th on the 187 Industry Groups list (L criteria). It has a Timeliness Rating of B and Sponsorship Rating of C.