There is 1 more featured stock write-up on since to 2/22/2025
Breakout Backed by Volume Twice the Average Daily - Tuesday, January 28, 2025
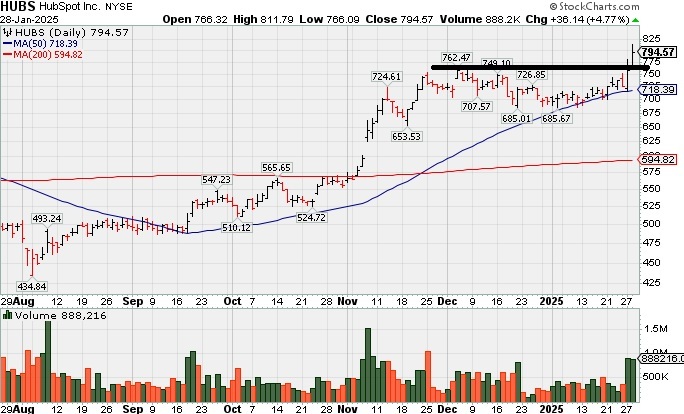
Hubspot Inc (HUBS +$36.14 or +4.77% to $794.57) hit a new 52-week high with today's 2nd consecutive gain backed by +103% above average volume triggering a technical buy signal. Its color code was changed to yellow when highlighted in the 1/27/25 mid-day report (read here) with new pivot point cited based on its 12/04/24 high plus 10 cents, rallying from support near its 50-day moving average (DMA) line ($717). It was noted - "A gain and strong close above the pivot point may clinch a technical buy signal. Fundamentals remain strong. It went through a deep consolidation and rebounded since dropped from the Featured Stocks list when last noted on 5/02/24." HUBS was last shown in this FSU section on 4/25/24 in detail with an annotated graph under the headline, "HUBS Testing 50-day Moving Average Line Again".
HUBS has a highest possible Earnings Per Share Rating of 99. Through the Sep '24 quarter its earnings increases versus the year-ago periods have been strong and steady above the +25% minimum guideline (C criteria). Its annual earnings history (A criteria) has been strong.
The number of top-rated funds owning its shares rose from 1,530 in Jun '23 to 1,890 in Dec '24, a reassuring sign concerning the I criteria. Its current Up/Down Volume Ratio of 1.1 is an unbiased indication its shares have been under accumulation over the past 50 days.
Chart courtesy of www.stockcharts.com


HUBS Testing 50-day Moving Average Line Again - Thursday, April 25, 2024
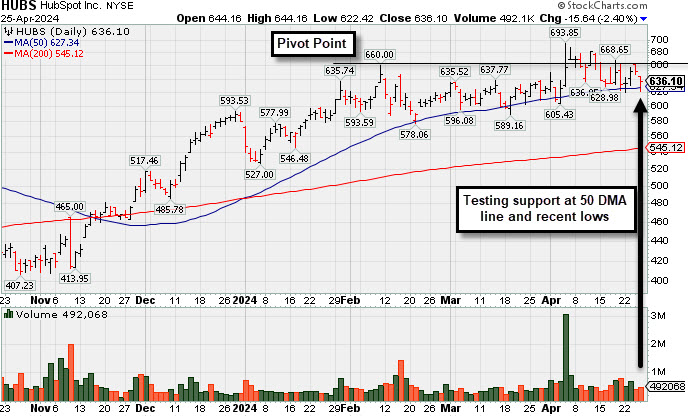
Hubspot Inc (HUBS -$16.06 or -2.46% to $635.68) pulled back again today with near average volume, testing support at its 50-day moving average (DMA) line ($627) and recent lows. More damaging losses would raise serious concerns and trigger a worrisome technical sell signal.
HUBS was highlighted in yellow with pivot point cited based on its 2/09/24 high plus 10 cents in the mid-day report (read here) and last shown in this FSU section on 4/04/24 in detail with an annotated graph under the headline, "Encountered Distributional Pressure and Finished Below Pivot Point".
HUBS has a highest possible Earnings Per Share Rating of 99. Dec '23 quarterly earnings +59% on +24% sales revenues versus the year-ago period marked its 6th consecutive quarterly comparison well above the +25% minimum guideline (C criteria). Its annual earnings history (A criteria) has been strong. It faces some resistance due to old overhead supply up to the $866 level.
The number of top-rated funds owning its shares rose from 1,530 in Jun '23 to 1,821 in Mar '24, a reassuring sign concerning the I criteria. Its current Up/Down Volume Ratio of 1.6 is an unbiased indication its shares have been under accumulation over the past 50 days.

Encountered Distributional Pressure and Finished Below Pivot Point - Thursday, April 4, 2024
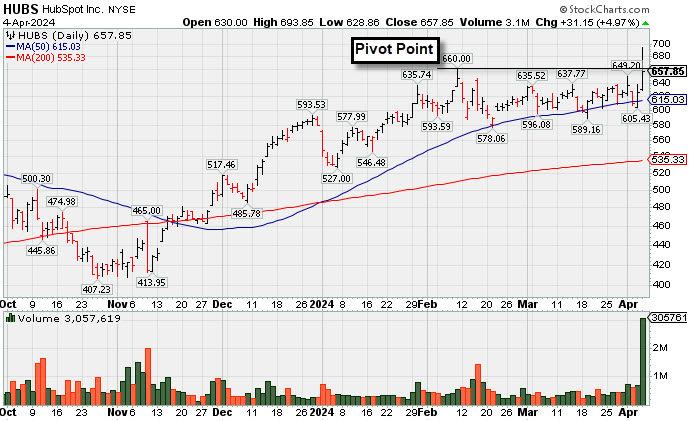
Hubspot Inc (HUBS +$31.15 or +4.97% to $657.85) finished in the middle of its intra-day range after highlighted in yellow with pivot point cited based on its 2/09/24 high plus 10 cents in the earlier mid-day report. It hit a new 52-week high with today's volume-driven gain triggering a technical buy signal, however the stock did not finish the session above the pivot point. It also failed to close in the upper third of its intra-day range, a sign of it encountering distributional pressure as it was also impacted by widespread market weakness. Confirming volume-driven gains would be a reassuring sign of lurking institutionaI buyers. It found prompt support at its 50-day moving average (DMA) line ($615.57) in recent weeks which defines important near-term support above the recent low ($589.16 on 3/19/24).
HUBS has a highest possible Earnings Per Share Rating of 99. Dec '23 quarterly earnings +59% on +24% sales revenues versus the year-ago period marked its 6th consecutive quarterly comparison well above the +25% minimum guideline (C criteria). Its annual earnings history (A criteria) has been strong. It faces some resistance due to old overhead supply up to the $866 level.
The number of top-rated funds owning its shares rose from 1,530 in Jun '23 to 1,783 in Dec '23, a reassuring sign concerning the I criteria. Its current Up/Down Volume Ratio of 1.5 is an unbiased indication its shares have been under accumulation over the past 50 days.
