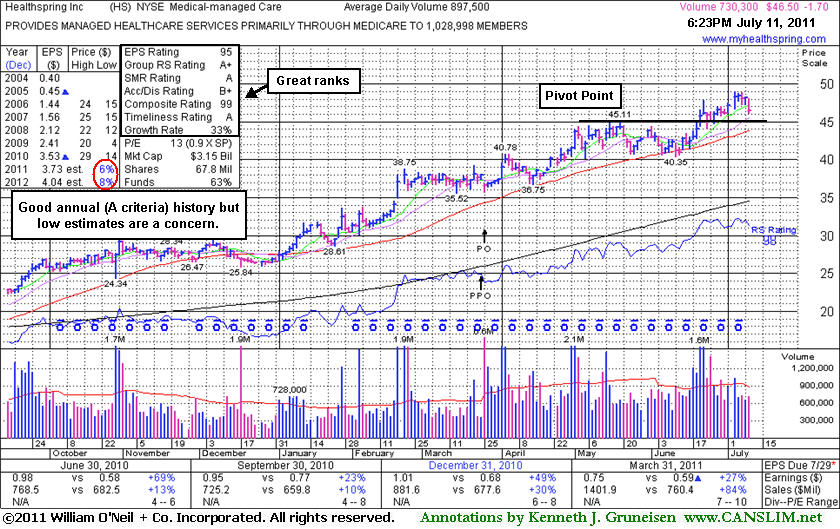
Healthspring Inc (HS -$1.70 or -3.53% to $46.50) is quietly consolidating under its "max buy" level today and its color code was changed to yellow. Odds are best for investors when buying stock while they are rising, not falling. As it consolidates, prior resistance near $45 defines support to watch now above important support at its 50-day moving average (DMA) line. After its last appearance in this FSU section on June 16, 2011 with an annotated graph under the headline, New Pivot Point Cited After Orderly Consolidation", it rallied from near its 50 DMA line with a streak of consecutive volume-driven gains to new highs as it triggered another technical buy signal.
Since HS was first featured at $19.91 in the 8/27/10 mid-day report it has traded up as much as +146%. Along the way it had paused to form new bases and new pivot points were noted before it broke out again. The number of top-rated funds owning its shares rose from 437 in June '10 to 519 in March '11, a reassuring sign concerning the I criteria. For the quarter ended March 31, 2011 versus the year earlier period its +84% increase in sales revenues marked an acceleration from +30% and +10% increases in the Sep and Dec '10 quarters, respectively. It has maintained strong earnings increases above the +25% guideline (C criteria) in the latest quarters and other bullish characteristics including high ranks. Street earnings estimates calling for EPS growth only in the +6-8% range in FY '11 and FY '12 remain a concern (see red circle).
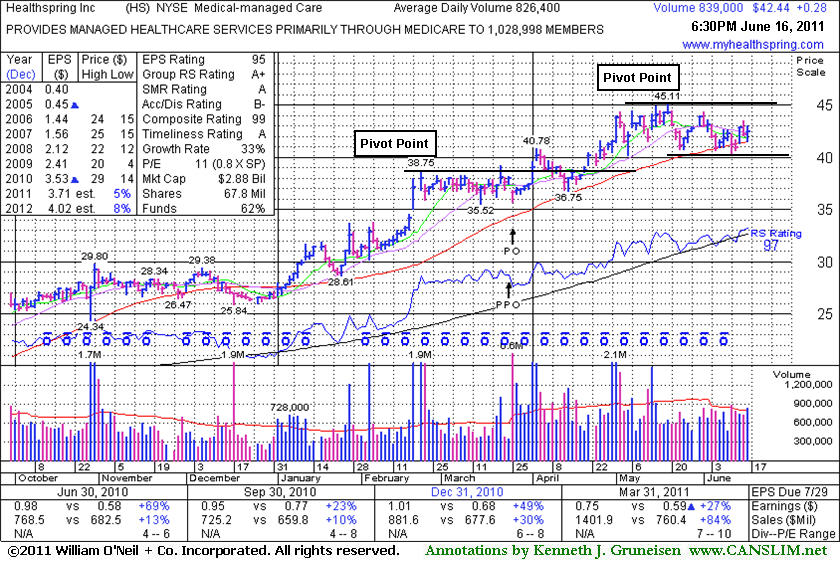
After its last appearance in this FSU section on May 20, 2011 with an annotated graph under the headline, "Extended From Sound Base After +126% Rally in 9 Months", it has held its ground stubbornly while enduring mild distributional pressure. Since HS was first featured at $19.91 in the 8/27/10 mid-day report it has traded up as much as +126.56%. Along the way it had paused to form a new base and a new pivot point was noted before it broke out again in January.
The number of top-rated funds owning its shares rose from 437 in June '10 to 519 in March '11, a reassuring sign concerning the I criteria. For the quarter ended March 31, 2011 versus the year earlier period its +84% increase in sales revenues marked an acceleration from +30% and +10% increases in the Sep and Dec '10 quarters, respectively. It has maintained strong earnings increases above the +25% guideline (C criteria) in the latest quarters and other bullish characteristics including high ranks. Street earnings estimates calling for EPS growth only in the +5-8% range in FY '11 and FY '12 remain a concern.
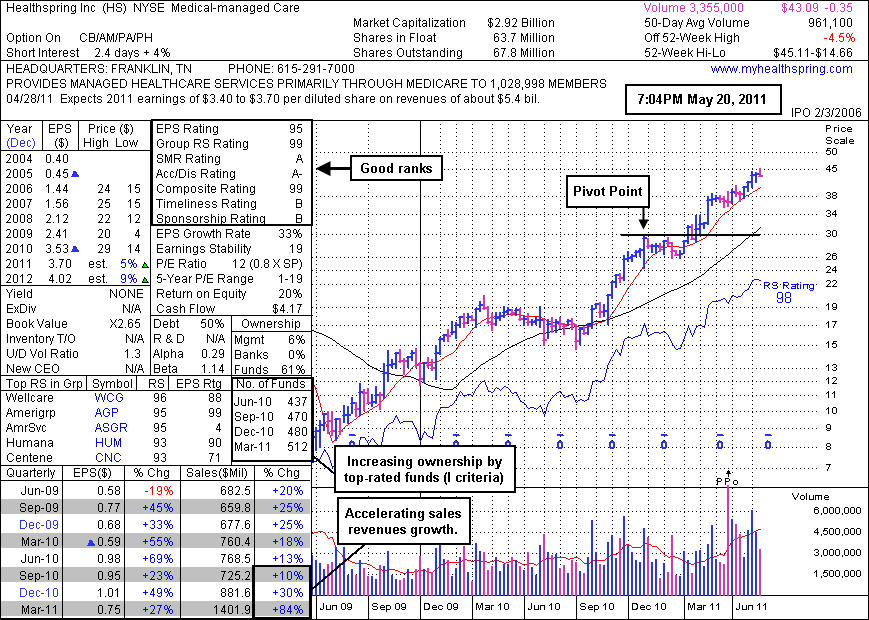
Healthspring Inc's (HS -$1.18 or -2.67% to $43.09) volume total cooled this week while hovering at its all-time high, extended from any sound base pattern. Disciplined investors may watch for a secondary buy point or new base to possibly develop and be noted. Meanwhile, prior highs define important chart support to watch along with its 50-day moving average (DMA) line in the $39-40 area. Violations would trigger technical sell signals. Following its last appearance in this FSU section on April 21, 2011 with an annotated graph under the headline,"Breakout Followed Recently Noted Public Offering", it went on to new all-time highs with move volume driven gains. Since HS was first featured at $19.91 in the 8/27/10 mid-day report it has traded up as much as +126.56%. Along the way it had paused to form a new base and a new pivot point was noted before it broke out again in January.
The number of top-rated funds owning its shares rose from 437 in June '10 to 512 in March '11, a reassuring sign concerning the I criteria. For the quarter ended March 31, 2011 versus the year earlier period its +84% increase in sales revenues marked an acceleration from +30% and +10% increases in the Sep and Dec '10 quarters, respectively. It has maintained strong earnings increases above the +25% guideline (C criteria) in the latest quarters and other bullish characteristics including high ranks. Street earnings estimates calling for EPS growth only in the +5-9% range in FY '11 and FY '12 remain a concern.
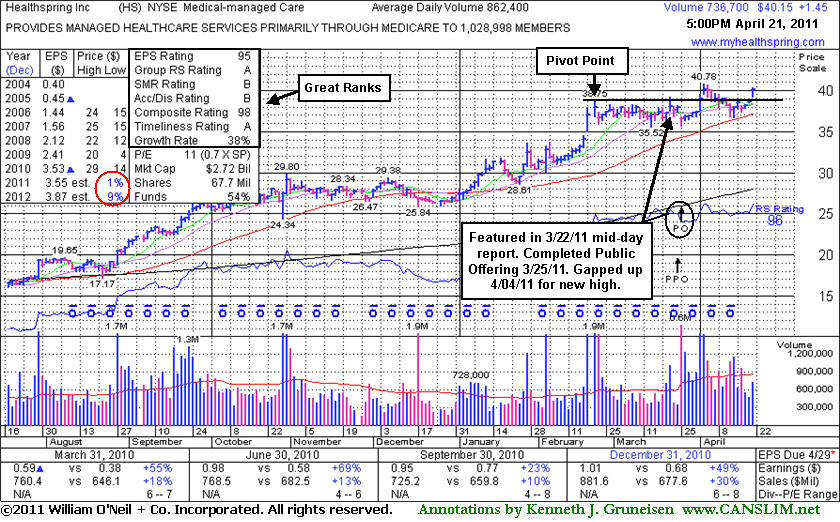
Healthspring Inc (HS +$1.45 or +3.75% to $40.13) gapped up again today and finished at its best ever close just -1.5% off its 52-week high. It found support above its 50-day moving average (DMA) line after as pullback below its pivot point last week. Its 50 DMA line ($37.19 now) defines important support above recent lows in the $35.50 area. Following its last appearance in this FSU section on March 23, 2011 with an annotated graph under the headline, "Not Yet a Convincing New Breakout", it completed a Public Offering on 3/25/11, then technically broke out on 4/01/11 and gapped up for another volume-driven gain and new all-time high on 4/04/11. The number of top-rated funds owning its shares rose from 438 in March '10 to 483 in March '11, a reassuring sign concerning the I criteria.
Since HS was first featured at $19.91 in the 8/27/10 mid-day report it has traded up as much as +104.8%. After an orderly flat base near minimum length, its color code was most recently changed to yellow with pivot point cited based on its 52-week high plus 10 cents when featured in the 3/22/11 mid-day report (read here). For the quarter ended December 31, 2011 versus the year earlier period its +30% increase in sales revenues and +49% increase in earnings were a welcome reassurance after sequential deceleration from +25%, +18%, +13%, to +10% in the Dec '09 and Mar, Jun, Sep '10 quarters, respectively. In light of its stronger sales and earnings increases in the latest quarter and other bullish characteristics, new buying efforts could be justified by disciplined investors. However, previously noted Street earnings estimates calling for EPS growth only in the +1-9% range in FY '11 and FY '12 (see red circle) remain a concern.
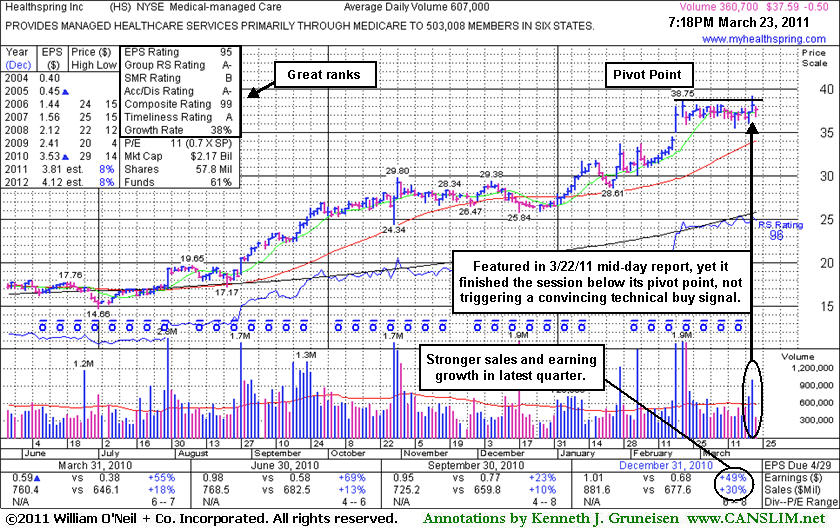
Healthspring Inc (HS -$1.16 or -2.97% to $36.96) pulled back today on lighter volume. It had failed to convincingly rally for a close above its pivot point after it touched a new 52-week high on the prior session and finished at a new high close with +69% above average volume behind its gain. After an orderly flat base near minimum length its color code was changed to yellow with pivot point cited based on its 52-week high plus 10 cents when featured in the 3/22/11 mid-day report (read here).
HS had traded up as much as +45% after it was first featured at $19.91 in the 8/27/10 mid-day report, and indeed it is much higher now than when it made its last appearance in this FSU section on December 10, 2010 with an annotated graph under the headline "Healthy Technically, But Deceleration Has Raised Concerns." Quarterly and annual earnings comparisons had shown strong +25% or greater increases (good C and A criteria) history. Concerns were raised because sales revenues growth had shown sequential deceleration from +25%, +18%, +13%, to +10% in the Dec '09 and Mar, Jun, Sep '10 quarters, respectively. It was later noted when dropped from the Featured Stocks list on 12/22/10 based on technical weakness and concerns raised by the weaker sales and earnings increases in the September quarter.
In light of its stronger sales and earnings increases in the latest quarter and other bullish characteristics, a subsequent breakout with conviction may justify new buying efforts. The number of top-rated funds owning its shares rose from 438 in March '10 to 479 in December '10, a reassuring sign concerning the I criteria. However, the M criteria argues against new buying efforts until a follow-through day confirms a new rally. Also, earnings estimates calling for EPS growth only in the +8% range in FY '11 and FY '12 were previously noted as a concern, as low Street estimates are not a very reassuring characteristic.
It was extended from an ideal base when recently noted in the 2/23/11 mid-day report - "It rebounded above its 50 DMA line and made an impressive rally after it was dropped from the Featured Stocks list on 12/22/10 based on fundamental and technical concerns. Reported earnings +49% on +30% sales revenues for the quarter ended December 31, 2010 versus the year ago period."
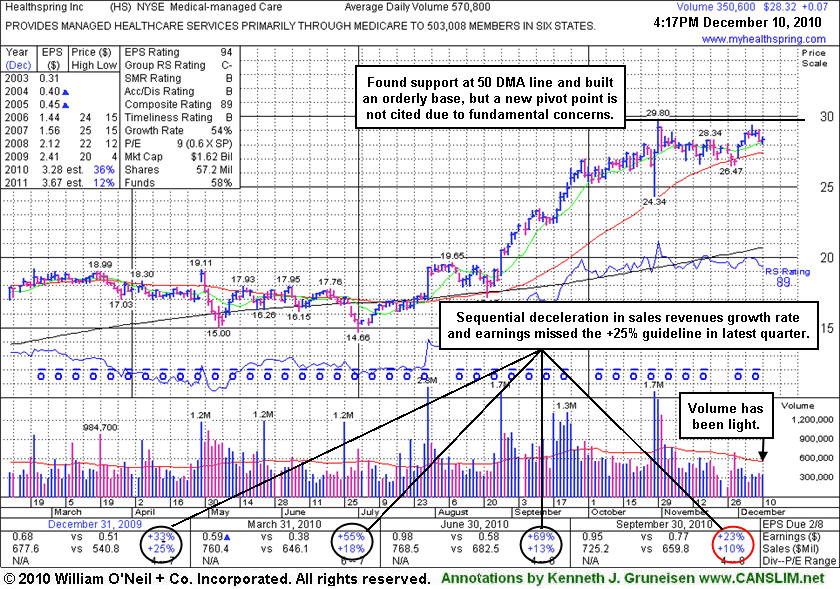
Healthspring Inc (HS +$0.06 or +0.21% to $28.31) traded up as much as +45% since featured in the 8/27/10 mid-day report at $19.91. Its breakout is easy to spot on the annotated graph below, and it quickly got extended from its original base. The volume totals have been cooling since spiking higher in late October when a shakeout tested its 50-day moving average (DMA) line. It has built an orderly base above support at its 50 DMA line, however its color code remains green and a new pivot point is not being cited due to fundamental concerns.
Quarterly and annual earnings comparisons had shown strong +25% or greater increases (good C and A criteria) history, however its earnings increased by +23% in the latest quarter ended September 30, 2010 (see red circle) versus the year ago period, just under the +25% guideline. Sales revenues growth has shown sequential deceleration from +25%, +18%, +13%, to +10% in the Dec '09 and Mar, Jun, Sep '10 quarters, respectively, raising some fundamental concerns. Disciplined investors may choose to pass over this high-ranked leader as a strong buy candidate based upon those concerns, opting for fresh buy candidates which are showing acceleration in sales revenues and earnings growth in recent quarterly comparisons. It may deserve the benefit of the doubt until a technical sell signal occurs, and its price/volume action in the coming weeks may help to forecast whether it can produce more impressive results in the quarter ending December 31, 2010. Its recent low near $26.50 defines chart support to watch just below its short-term average, where violations would trigger technical sell signals.
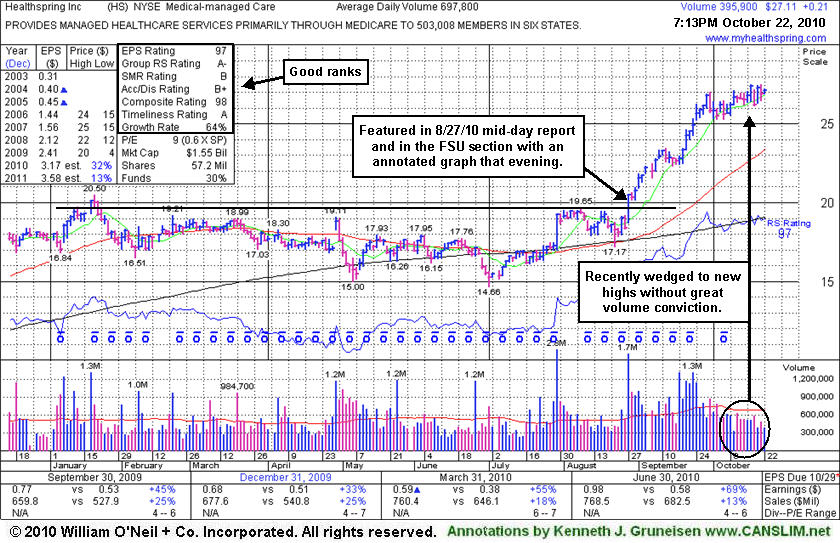
Healthspring Inc (HS +$0.21 or +0.78% to $27.11) is perched near all-time highs after 5 consecutive weekly gains. It has not formed a recent sound base and recently wedged to new highs without great volume conviction. Earnings news is due on Thursday, October 28, 2010. Support to watch is prior chart highs in the $19-20 area. Quarterly and annual earnings comparisons have showed strong +25% or greater increases (good C and A criteria) history.
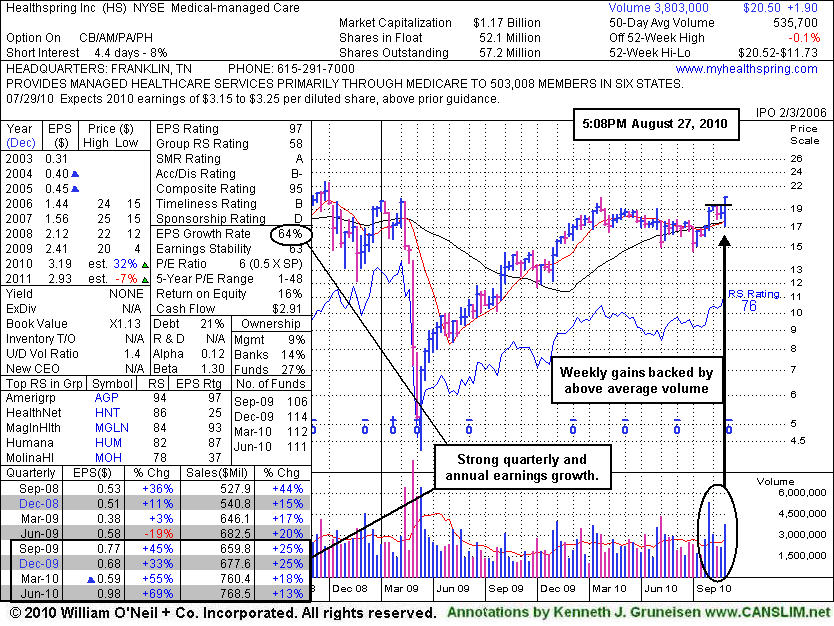
It is up +36% since featured in the 8/27/10 mid-day report and with an annotated graph under the headline "Market Cheers Healthcare Firms' Plans To Combine". It had announced news that it would acquire Bravo Health for $545 million, and was rallying from a short flat base after finding support above its 50-day moving average (DMA) and 200 DMA lines during its light volume pullback following an earlier (7/29/10) breakout. Its weekly chart showed a few recent weeks with gains backed by above average volume, a reassuring sign of institutional buying demand.
A follow through day on 9/01/10 helped the M criteria improve in the interim. Street estimates had not been calling for great earnings growth in FY '11, and the effects of recent healthcare legislation have made it difficult to make conclusions concerning the outlook of many healthcare companies, however the fresh M&A news was cheered on Friday.
Healthspring Inc (HS +$2.11 or +11.47% to $20.50) gapped up today after announcing news that it will acquire Bravo Health for $545 million. It was featured in the mid-day report (read here) rallying from a short flat base after finding support above its 50-day moving average (DMA) and 200 DMA lines during its light volume pullback following an earlier (7/29/10) breakout. It faces resistance at its 52-week high and the M criteria remains a concern until a follow-through day emerges. Quarterly and annual earnings comparisons have showed strong +25%. or greater increases (good C and A criteria) history. Street estimates had not been calling for great earnings growth in FY '11, and the effects of recent healthcare legislation have made it difficult to make conclusions concerning the outlook of many healthcare companies, however the fresh M&A news was cheered on Friday. Its weekly chart shows a few recent weeks with gains backed by above average volume, a reassuring sign of institutional buying demand.