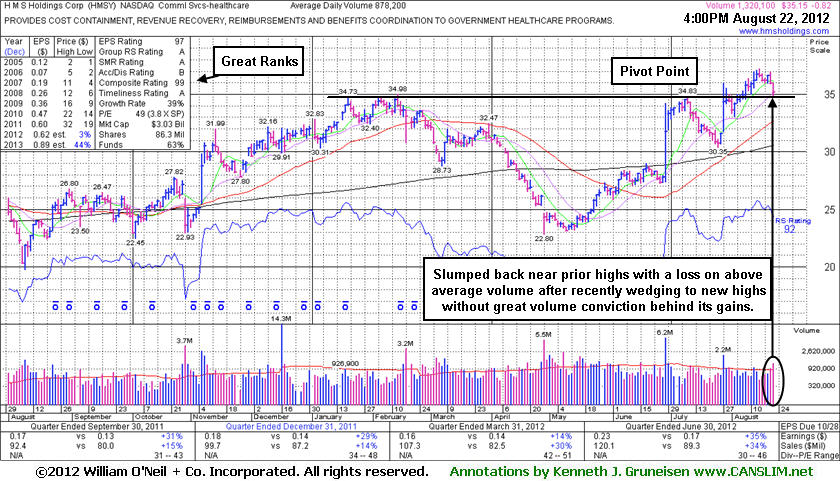
Awaiting Confirming Gains and Encountering Distributional Pressure - Wednesday, August 22, 2012
H M S Holdings Corp (HMSY -$0.87 or -2.42% to $35.10) pulled back with higher volume today, a discouraging sign of distributional pressure. It is still hovering near its pivot point and finished just -5.7% off its 52-week high. No resistance remains due to overhead supply, and prior highs are a likely chart support area while more damaging losses would raise greater concerns. As previously noted - "Gains above a stock's pivot point must have at least +40% above average volume, preferably greater, to trigger a proper technical buy signal." It had wedged to new highs without great volume conviction and failed to produce the volume-driven gain needed to trigger a buy signal since its last appearance in this FSU section on 7/27/12 under the headline, "Touched New 52-Week High After 6-Month Cup With Handle Base".The high-ranked Commercial Services - Healthcare firm reported earnings +35% on +34% sales revenues for the quarter ended June 30, 2012 versus the year ago period. In the 7/27/12 mid-day report it was highlighted in yellow with a new pivot point based on its 7/10/12 high (read here). It hit a new 52-week high while trying to rally from a 6-month cup-with-handle base pattern, but it finished that session below its pivot point. Subsequent volume-driven gains above its pivot may still confirm a technical buy signal. Its annual earnings (A criteria) growth has been strong, and it has reported earnings above the +25% minimum guideline in 3 of the past 4 quarterly comparisons through Jun '12. Sales revenues growth was stronger in the 2 most recent comparisons, sequentially accelerating. The number of top-rated funds owning its shares rose from 451 in Sep '11 to 525 in Jun '12, a reassuring sign concerning the I criteria.
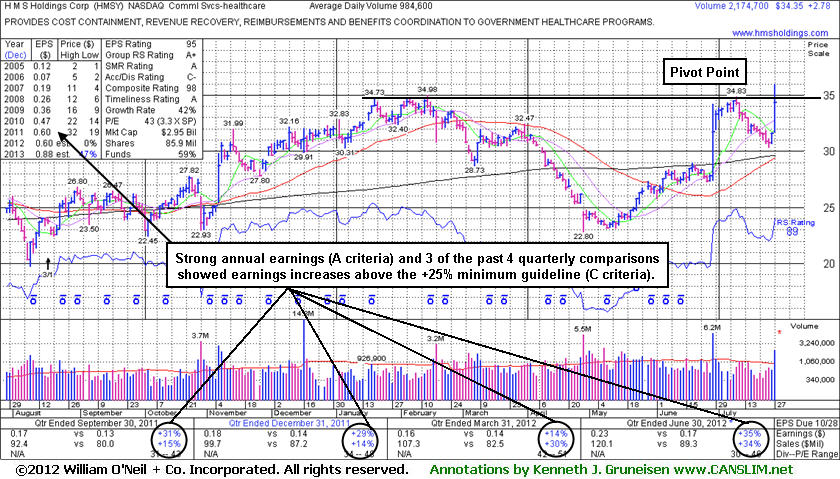
Touched New 52-Week High After 6-Month Cup With Handle Base - Friday, July 27, 2012
Often, when a leading stock is setting up to breakout of a solid base it is highlighted in CANSLIM.net's Mid-Day Breakouts Report. The most relevant factors are noted in the report which alerts prudent CANSLIM oriented investors to place the issue in their watch list. After doing any necessary backup research, the investor is prepared to act after the stock triggers a technical buy signal (breaks above its pivot point on more than +50% average turnover) but before it gets too extended from a sound base. In the event the stock fails to trigger a technical buy signal and its price declines then it will simply be removed from the watch list. Disciplined investors know to buy as near as possible to the pivot point and avoid chasing stocks after they have rallied more than +5% above their pivot point. It is crucial to always limit losses whenever any stock heads the wrong direction, and disciplined investors sell if a struggling stock ever falls more than -7% from their purchase price.H M S Holdings Corp's (HMSY +$2.78 or +8.81% to $34.35) reported earnings +35% on +34% sales revenues for the quarter ended June 30, 2012 versus the year ago period. It was highlighted in yellow with new pivot point based on its 7/10/12 high in the earlier mid-day report (read here). No resistance remains due to overhead supply. It hit a new 52-week high while trying to rally from a 6-month cup-with-handle base pattern, but it finished today's session below its pivot point. Subsequent volume-driven gains above its pivot may trigger a technical buy signal. Its ongoing success largely hinges largely upon the broader market's ability to reconfirm and then sustain a meaningful rally, however, as the M criteria reminds investors that 3 out of 4 stocks generally move in the same direction as the major averages.
It last appearance in this FSU section was on 3/02/12 under the headline, "Dropping From Featured Stocks List After Damaging Losses". Then it had failed to find support at its 50-day moving average (DMA) line and its Accumulation/Distribution Rating had slumped to a worst possible E rating. It went on to deeply undercut its 200 DMA line before making an impressive rebound in recent months. This Commercial Services - Healthcare firm's annual earnings (A criteria) growth has been strong, and it has reported earnings above the +25% minimum guideline in 3 of the past 4 quarterly comparisons through Jun '12. Sales revenues growth was stronger in the 2 most recent comparisons, sequentially accelerating. The number of top-rated funds owning its shares rose from 453 in Sep '11 to 506 in Jun '12, a reassuring sign concerning the I criteria.
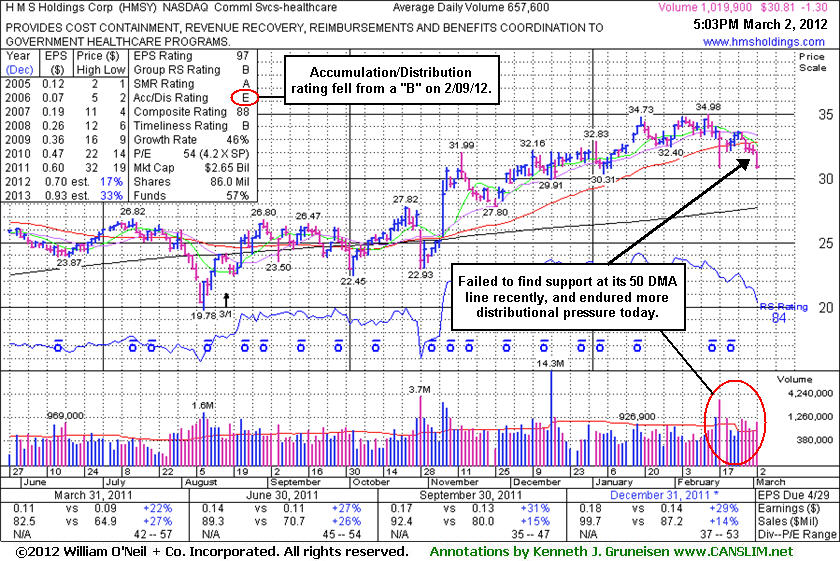
Dropping From Featured Stocks List After Damaging Losses - Friday, March 02, 2012
H M S Holdings Corp's (HMSY -$1.30 or -4.05% to $30.81) finished near the session low today with another damaging loss on above average volume. It failed to find support at its 50-day moving average (DMA) line while it slumped for 5 consecutive losses. Only a rebound above that short-term average would help its outlook improve.
Based on its technical deterioration it will be dropped from the Featured Stocks list tonight. Its last appearance in this FSU section was on 2/09/12 with an annotated graph under the headline, "Remaining Well Above 50-Day Average Since Early November Breakout". Since then its Accumulation/Distribution Rating has slumped from a B to a worst possible E rating (see red circle). It violated its 50 DMA line intra-day with a loss on heavy volume on 2/17/12 but finished the session above that important short-term average. None of its subsequent gains have been backed by above average volume and it slumped with heavier volume.
This Commercial Services - Healthcare firm has maintained a solid sales revenues and earnings growth history that still satisfies the C and A criteria. It reported earnings +29% on +14% sales revenues for the quarter ended December 31, 2011 versus the year ago period. The number of top-rated funds owning its shares rose from 432 in Dec '10 to 495 in Dec '11, a reassuring sign concerning the I criteria.
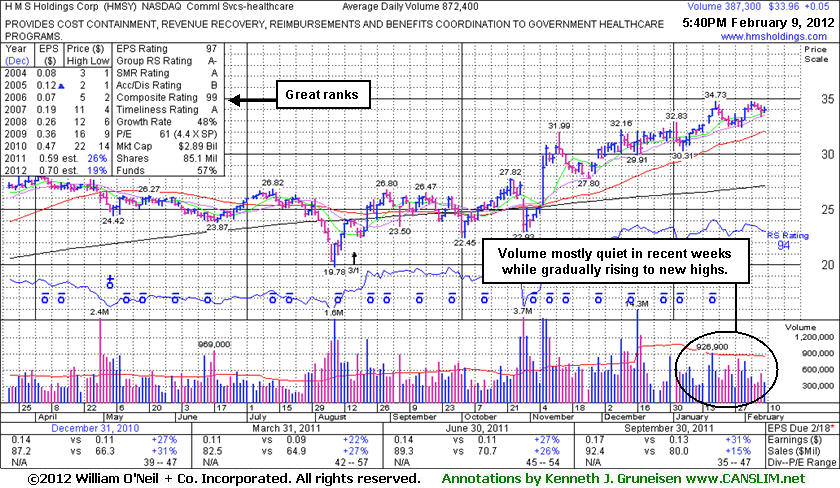
Remaining Well Above 50-Day Average Since Early November Breakout - Thursday, February 09, 2012
H M S Holdings Corp's (HMSY +$0.05 or +0.15% to $33.96) volume totals have been cooling in recent weeks while hovering near its all-time high. No resistance remains to hinder its progress, but it is extended from its prior base pattern. Its 50-day moving average (DMA) line and prior highs near $32 define near-term chart support to watch. Its last appearance in this FSU section was on 12/28/11 with an annotated graph under the headline, "No Resistance Remains But Now Extended From Prior Base Pattern." None of its subsequent gains have been backed by above average volume, yet it is also true that no losses have been marked by above average volume.
It is due to report earnings on the morning of February 17, 2012 for the latest quarter ended December 31, 2011 versus the year ago period. Volume and volatility often increase near earnings news. This Commercial Services - Healthcare firm has maintained a solid sales revenues and earnings growth history that still satisfies the C and A criteria. It reported earnings +31% on +15% sales revenues for the quarter ended September 30, 2011 versus the year ago period. The number of top-rated funds owning its shares has risen from 432 in Dec '10 to 485 in Dec '11, a reassuring sign concerning the I criteria. It has stayed well above its 50 DMA line throughout its ongoing rally since 11/07/11 when it confirmed a technical buy signal with a solid volume-driven gain into new high territory.
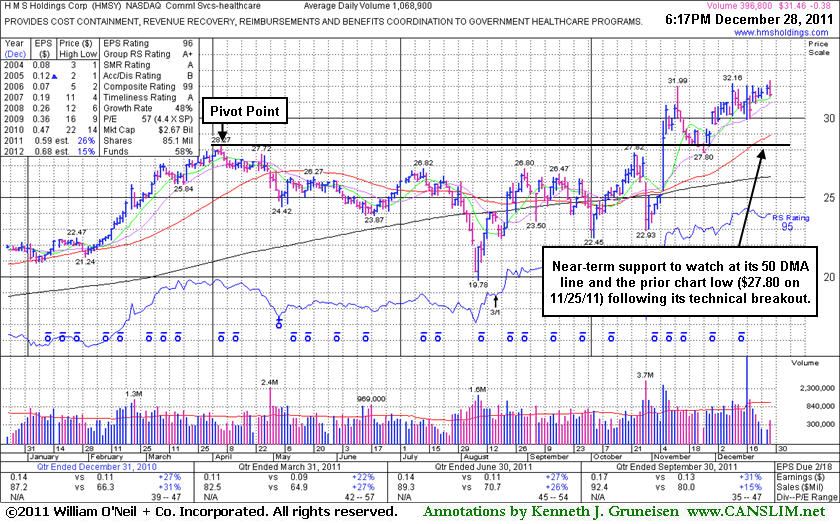
No Resistance Remains But Now Extended From Prior Base Pattern - Wednesday, December 28, 2011
H M S Holdings Corp (HMSY -$0.38 or -1.19% to $31.46) is stubbornly holding its ground near its all-time high with volume totals cooling. No resistance remains, but it is extended from its prior base. Its last appearance in this FSU section was on 11/30/11 with an annotated weekly graph under the headline, "Rallied Above 'Max Buy' Level Following Consolidation." Its color code was changed to green that day after rising above its "max buy" level. Prior highs in the $27-28 area acted as support during the recent pullback. Its earlier appearance in this FSU section was on 11/04/11 with an annotated graph under the headline, "Recent Damage Needs Repair For Outlook to Improve." On the very next session it not only repaired the damage, it confirmed a technical buy signal with a solid volume-driven gain into new high territory.
This Commercial Services - Healthcare firm has maintained a solid sales revenues and earnings growth history that still satisfies the C and A criteria. It reported earnings +31% on +15% sales revenues for the quarter ended September 30, 2011 versus the year ago period. The number of top-rated funds owning its shares has risen from 432 in Dec '10 to 464 in Sep '11, a reassuring sign concerning the I criteria.
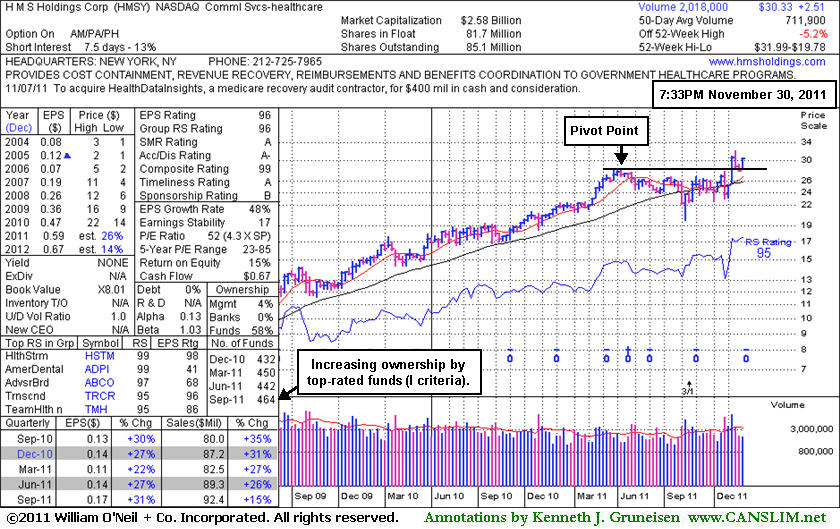
Rallied Above "Max Buy" Level Following Consolidation - Wednesday, November 30, 2011
H M S Holdings Corp (HMSY +$1.35 or +4.66% to $30.33) gapped up today for another solid gain with slightly above average volume, and its color code was changed to green after rising back above its "max buy" level. Prior highs in the $27-28 area acted as support during the recent pullback. Its last appearance in this FSU section was on 11/04/11 with an annotated graph under the headline, "Recent Damage Needs Repair For Outlook to Improve." On the very next session it not only repaired the damage, it confirmed a technical buy signal with a solid volume-driven gain into new high territory.
It reported earnings +31% on +15% sales revenues for the quarter ended September 30, 2011 versus the year ago period. This Commercial Services - Healthcare firm has maintained a solid sales revenues and earnings growth history that still satisfies the C and A criteria. The number of top-rated funds owning its shares has risen from 432 in Dec '10 to 464 in Sep '11, a reassuring sign concerning the I criteria.
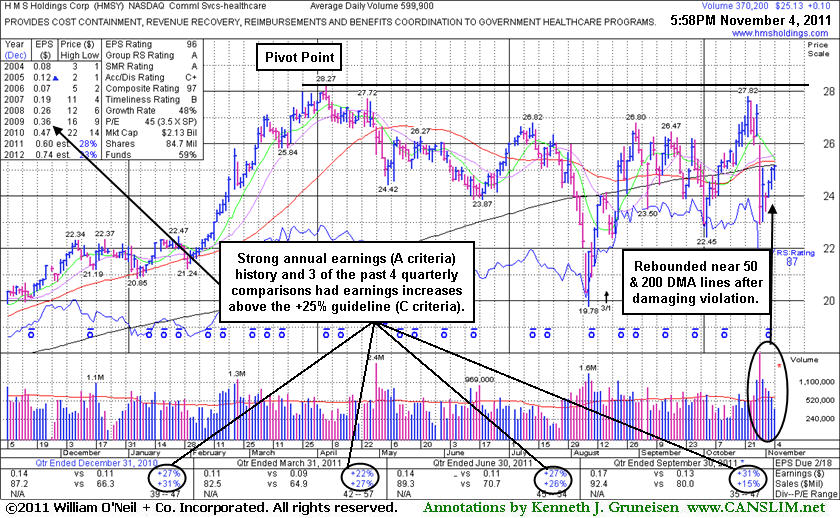
Recent Damage Needs Repair For Outlook to Improve - Friday, November 04, 2011
H M S Holdings Corp (HMSY +$0.10 or +0.40% to $25.13) posted a third consecutive small gain today with ever-lighter volume, finishing just below its 50-day and 200-day moving average (DMA) lines. Subsequent gains above those moving averages could help its outlook to improve, meanwhile it could continue to struggle. Disciplined investors will note that it did not trigger a technical buy signal after it was featured in yellow in the 10/27/11 mid-day report (read here) with pivot point based on its 52-week high plus 10 cents. Afterward it reported earnings +31% on +15% sales revenues for the quarter ended September 30, 2011 versus the year ago period, then gapped down and violated its 50 and 200 DMA lines raising concerns and triggering technical sell signals.
Its last appearance in this FSU section was on 5/23/11 with an annotated graph under the headline, "Volume Quiet While Sputtering Under 50-Day Average", and shortly thereafter it was dropped from the Featured Stocks list on 6/06/11. Later it slumped below its 200 DMA line and there was a 3:1 stock split (effective 8/17/11). It still has some work to do, repairing the recent technical damage. Disciplined investors may watch for gains above its 50 DMA and 200 DMA lines for its outlook to improve, meanwhile, volume-driven gains into new high ground could ultimately trigger a new buy signal. This Commercial Services - Healthcare firm has maintained a solid sales revenues and earnings growth history that still satisfies the C and A criteria. The number of top-rated funds owning its shares has risen from 488 in Jun '11 to 497 in Sep '11, a reassuring sign concerning the I criteria.
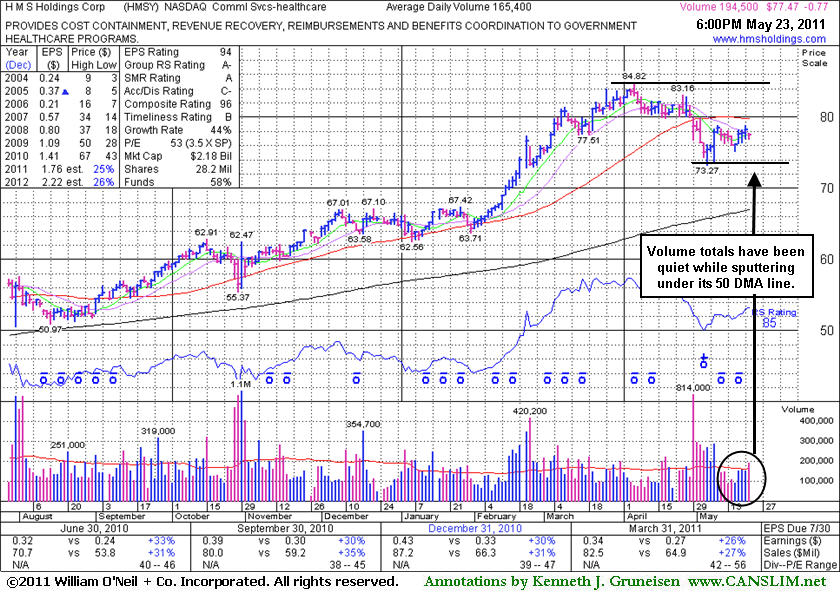
Volume Quiet While Sputtering Under 50-Day Average - Monday, May 23, 2011
H M S Holdings Corp (HMSY -$0.77 or -0.98% to $77.47) closed lower after a small gap down today on slightly above average volume. Deterioration below its recent chart low ($73.27) would raise more serious concerns and trigger an additional sell signal. Since its last appearance in this FSU section on 4/26/11 with an annotated graph under the headline, "Consolidating Above 50-Day Average Ahead Of Earnings News," it subsequently violated its 50-day moving average (DMA) line, triggering a technical sell signal with damaging distributional losses. It has lingered for the past 3 weeks below its 50-day moving average (DMA) line which may now act as resistance. A rally above that important short-term average line is needed to improve its technical stance. Meanwhile, the path of least resistance may likely lead it lower. Also keep in mind, 3 out of 4 growth stocks follow along with the broader market (M criteria) direction, and today's market commentary cites technical damaged that has hurt the outlook concerning any new buying efforts for the near term.
Disciplined investors may watch for a new base to possibly form and be noted in the future. First, gains above its short-term average line are needed for its outlook to improve. In just over 26 months after it was first featured at $34.08 in the February 20, 2009 mid-day report (when clearing an ascending base pattern) it has traded up as much as +148.8% higher. This Commercial Services - Healthcare firm has maintained a solid sales revenues and earnings growth history that still satisfies the C and A criteria. The number of top-rated funds owning its shares has risen from 462 in Mar '10 to 508 in Mar '11, a very reassuring sign concerning the I criteria.
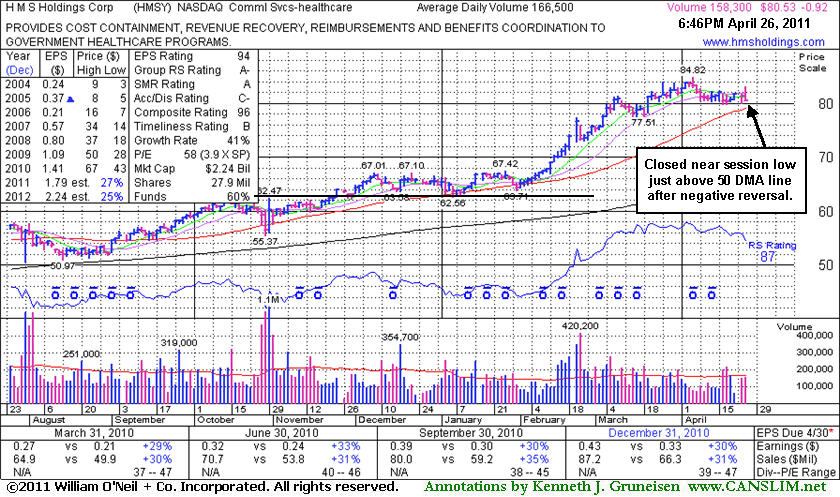
Consolidating Above 50-Day Average Ahead Of Earnings News - Tuesday, April 26, 2011
H M S Holdings Corp (HMSY -$0.92 or -1.13% to $80.53) gapped up today, then reversed into the red and closed near the session low. It is quietly perched -5.1% below its all-time high. Before the market open on Friday, April 29, 2011 it will report the financial results for the first quarter 2011 which ended March 31. Volume and volatility often increase near earnings news. Its short consolidation above its 50-day moving average (DMA) line ($79.08 now) is not a long enough period to be considered a sound new base pattern. Disciplined investors may watch for a new base to form and be noted in the future. In just over 26 months since it was first featured at $34.08 in the February 20, 2009 mid-day report when clearing an ascending base pattern it has traded up as much as +148.8% higher.
Volume totals have mostly been light or near average since its last appearance in this FSU section on 3/25/11 with an annotated graph under the headline, "Distributional Pressure Evident While Advancing". This Commercial Services - Healthcare firm has maintained a solid sales revenues and earnings growth history that still satisfies the C and A criteria. The number of top-rated funds owning its shares has risen from 462 in Mar '10 to 504 in Mar '11, a very reassuring sign concerning the I criteria.
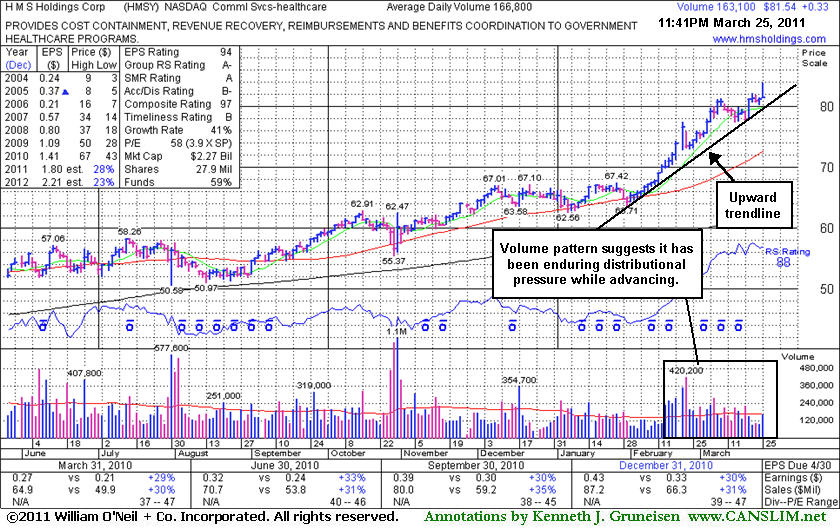
Distributional Pressure Evident While Advancing - Friday, March 25, 2011
When a stock is at clear of all resistance due to overhead supply it can rally unhindered by the weight of anxious seller who own it at higher prices. This Commercial Services - Healthcare firm has maintained a solid sales revenues and earnings growth history that still satisfies the C and A criteria. The number of top-rated funds owning its shares has risen from 462 in Mar '10 to 503 in Dec '10, a very reassuring sign concerning the I criteria.
H M S Holdings Corp (HMSY +$0.33 or +0.41% to $81.54) hit a new 52-week high today, but then it erased most of its gain and finished near the session low. That was not as ominous as a "negative reversal" might have been, but it did suggest that it was facing profit taking pressure. The volume pattern suggests that it has been enduring some distributional pressure, even while it was advancing in recent weeks. It has been repeatedly noted as "extended from any sound base pattern", and yet it could go on to produce more climactic gains. The upward trendline defines an initial support level where a violation might raise concerns and be considered a "early sell signal" before support at its 50-day moving average (DMA) line. Since its last appearance in this FSU section on 2/16/11 with an annotated graph under the headline, "Earnings News Pending Following Persistent Gains", it reported earnings +30% on +31% sales revenues for the quarter ended December 31, 2010 versus the year ago period.
Earnings News Pending Following Persistent Gains - Wednesday, February 16, 2011
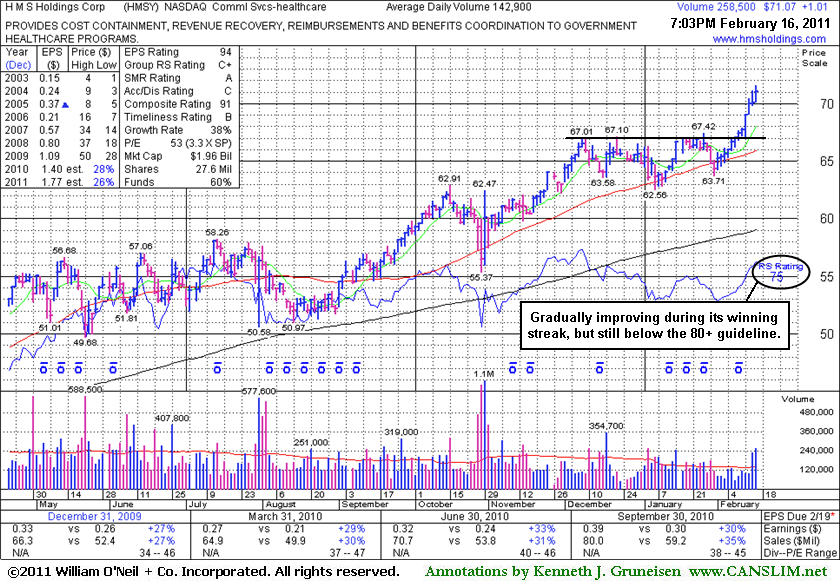
H M S Holdings Corp (HMSY +$1.01 or +1.44% to $71.07) hit yet another new 52-week high today with its 12th consecutive gain with ever-increasing volume since it found support at its 50-day moving average (DMA) line. No resistance remains due to overhead supply. Prior highs near $67 define initial support to watch on pullbacks. It quietly rose from an orderly base-on-base type pattern. Its Relative Strength rank (now 75) was noted as a concern, and despite its subsequent progress that rating has only gradually improved since its last appearance in this FSU section with an annotated graph on 1/03/11 under the headline "Waning Relative Strength Yet Only -2.7% Off High". A new pivot point was not cited recently due to its choppy action and lack of significant progress from its earlier breakout while its RS waned. The graph below clearly illustrates how it encountered resistance in the $67 area, and gains with higher than average volume came only after it was already getting extended from latest "base" period.
It will host a webcast and conference call at 9:00AM ET on Friday, February 18, 2011 to discuss the financial results for the fourth quarter 2010 which ended December 31, 2010. Volume and volatility often increase near earnings news. Near its last earnings announcement it briefly undercut prior chart highs and its 50-day moving average line and its prompt rebound was noted as an impressive sign of institutional support. This Commercial Services - Healthcare firm has maintained a solid sales revenues and earnings growth history that still satisfies the C and A criteria.
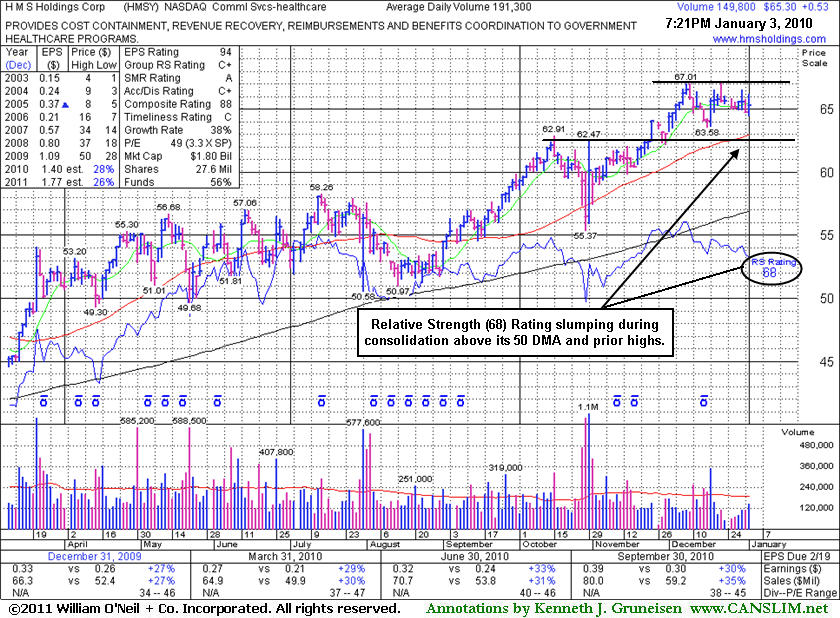
Waning Relative Strength Yet Only -2.7% Off High - Monday, January 03, 2011
H M S Holdings Corp (HMSY +$0.13 or +0.21% to $61.89) is quietly holding its ground -2.7% off its high and working on building a base-on-base type pattern. Prior highs in the $62 define initial chart support to watch along with its 50-day moving average (DMA) line. Near its last earnings announcement it briefly undercut prior chart highs and its 50-day moving average line. The prompt rebound was an impressive sign of institutional support. However, its Relative Strength rank has slumped to a mediocre 64 now, which is a concern because the fact-based system argues that an 80+ rank is expected of sound buy candidates. Since its last appearance in this FSU section with an annotated graph on 11/19/10 a new pivot point was identified under the headline "Second Best Close Of Year Following Volatile Period" it subsequently rallied to its best closes of the year without great volume conviction behind its gains until during its current consolidation on 12/17/19. Now there is no real resistance remaining due to overhead supply, but its latest base is short of the minimum needed for a proper 5-week flat base. Patient and disciplined investors may watch for it to complete a sound base and produce confirming gains as a critical sign of heavier institutional accumulation still needed. This Commercial Services - Healthcare firm has maintained a solid sales revenues and earnings growth history that still satisfies the C and A criteria.
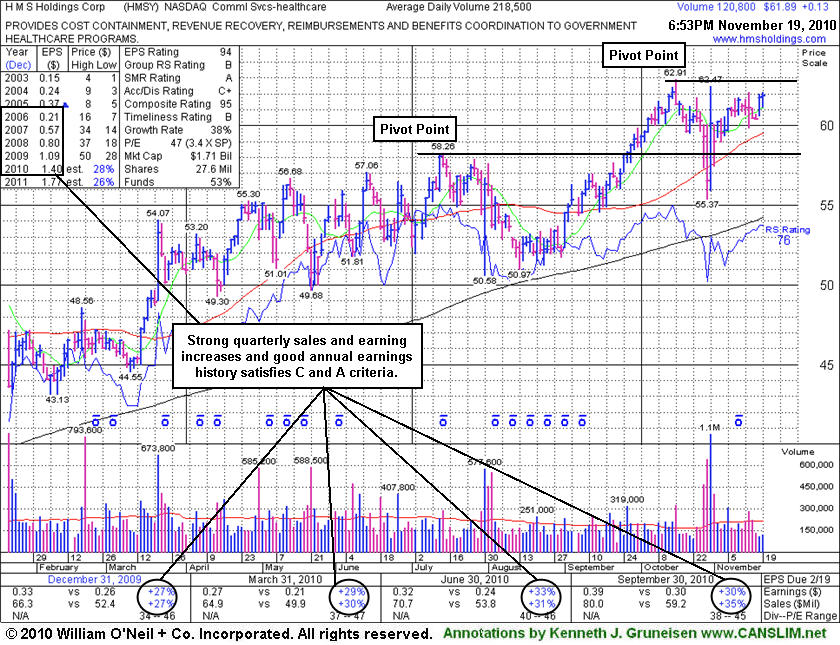
Second Best Close Of Year Following Volatile Period Near Earnings - Friday, November 19, 2010
H M S Holdings Corp (HMSY +$0.13 or +0.21% to $61.89) posted a gain today with light volume for its second-best close of the year, and no resistance remains due to overhead supply. A new pivot point is cited based on its 52-week high plus ten cents, and a subsequent breakout with volume conviction could trigger a new (or add-on) buy signal. Any violation of its 50 DMA line could raise greater concerns. Keep in mind that confirming gains from at least one of the major averages, a follow-through day, would be worth watching for with respect to the M criteria, and disciplined investors know to resist the urge to get in "early" without the compelling proof of heavy institutional (I criteria) buying demand driving a stock into new high territory, and driving the major averages higher too.
Near its last earnings announcement it briefly undercut prior chart highs and its 50-day moving average line. The prompt rebound was an impressive sign of institutional support. Patient investors may watch for confirming gains as a critical sign of heavier institutional accumulation still needed This high-ranked Commercial Services - Healthcare firm has maintained a solid sales revenues and earnings growth history that still satisfies the C and A criteria.
Healthier Base Pattern Has Developed - Monday, September 27, 2010
In recent weeks an increasing number of leading stocks setting up and breaking of solid bases have been highlighted in the CANSLIM.net Mid-Day Breakouts Report. The most relevant factors are briefly noted in the report which allows disciplined investors to place the issue in their custom watch list and receive subsequent notes directly via email immediately when they are published (click the "Alert me of new notes" link). More detailed analysis is published soon after a stock's initial appearance in yellow once any new candidates are added to the Featured Stocks list. Letter-by-letter details concerning strengths or shortcomings of the company in respect to key fundamental criteria of the investment system appear along with annotated datagraphs highlighting technical chart patterns in the Featured Stock Update (FSU) section included in the CANSLIM.net After Market Update each day.
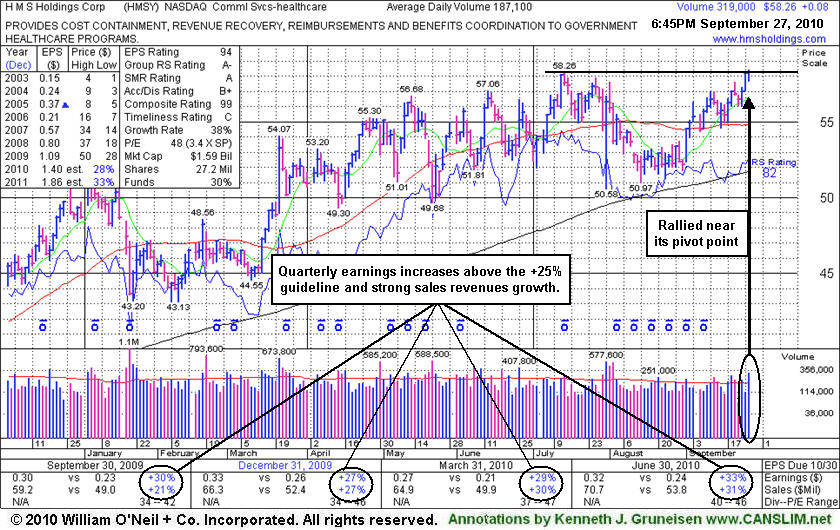
H M S Holdings Corp (HMSY +$0.08 or +0.14% to $58.26) was featured in the mid-day report today in yellow with a pivot point cited based on its 52-week high plus ten cents. Healthy action has continued since last noted in the mid-day report on 7/30/10 - "Patient investors may watch for an ideal new base pattern to form. This high-ranked Commercial Services - Healthcare firm has maintained a solid sales revenues and earnings growth history that still satisfies the C and A criteria, and it has rebounded impressively since it was dropped from the Featured Stocks list on 8/10/09."
Technically, its gain today had sufficient volume, but it failed to trigger a proper technical buy signal because it did not produce a meaningful gain above its prior high or pivot point. Confirming gains would be worth watching for, and disciplined investors know to resist the urge to get in "early" without the compelling proof of heavy institutional (I criteria) buying demand driving a stock into new high territory.
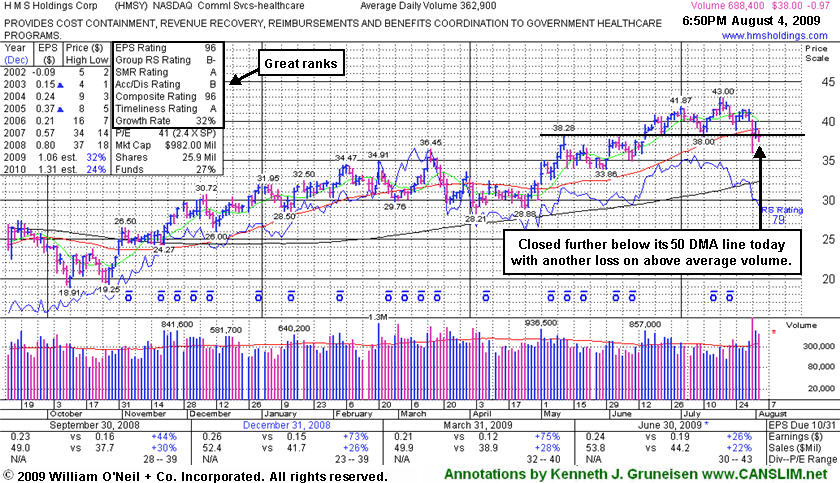
Violation Of 50-Day Moving Average Raises Concerns - Tuesday, August 04, 2009
HMS Holdings Corp (HMSY -$0.97 or -2.49% to $38.00) suffered another loss today with above average volume, closing back under its 50-day moving average (DMA) line, raising more concerns. Its 7/31/09 gap down and 50 DMA violation following its latest quarterly financial report which showed sales and earnings increases near the investment system's minimum guidelines, decelerating sequentially. This high-ranked Commercial Services - Healthcare firm's prior highs in the $38 area are an important support level. Deterioration into its prior base, or a violation of its 50 DMA line, would raise more serious concerns and trigger additional technical sell signals. It has shown healthy action since a gap up gain on 6/16/09 with heavy volume triggered a technical buy signal. The heavy volume and gap up provided a nice reassurance of institutional (the I criteria) buying demand.
A downturn in 2006 earnings is a fundamental flaw in HMS Holdings Corp's annual earnings history that raises some concerns with respect to the A criteria of the investment system. Investors' odds are usually better with a company that has a steady 3-5 year earnings growth history. That shortcoming could give investors one extra reason to be very careful about limiting losses.
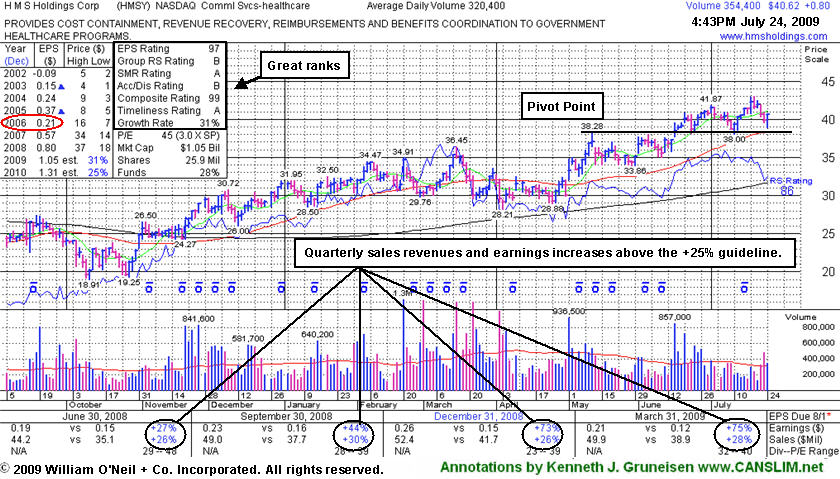
Positive Reversal For High-Ranked Healthcare Firm - Friday, July 24, 2009
Reversal days are a great way to stay ahead of potential changes to a recent trend. A positive reversal occurs when a stock opens the session heading lower, then reverses and ultimately closes the day higher. Positive reversals are often considered more severe if the stock's initial losses drive it to a new low, but it then reverses and closes the day higher on heavier than average volume and ends near the session's utmost highs. Reversals can occur on a daily, weekly or a monthly chart. In general, when a longer time frame is involved, greater implications may be given as to the severity or significance of the reversal. Volume is directly correlated with the severity of the action as well.
HMS Holdings Corp (HMSY +$0.75 or +1.88% to $40.57) made a positive reversal today after a pullback below its "max buy" level. This high-ranked Commercial Services - Healthcare firm previously tested prior highs in the $38 area -a very important initial support level that also coincides with its 50-day moving average (DMA) line. Deterioration into its prior base, or a violation of its 50 DMA line, would raise more serious concerns and trigger technical sell signals. It has shown healthy action since a gap up gain on 6/16/09 with heavy volume triggered a technical buy signal. The heavy volume and gap up provided a nice reassurance of institutional (the I criteria) buying demand.
Quarterly sales and earnings increases have been above the +25% guideline of the investment system, so it solidly satisfies the C criteria. A downturn in 2006 earnings (see red circle) is a fundamental flaw in HMS Holdings Corp's annual earnings history that raises some concerns with respect to the A criteria of the investment system. Investors' odds are usually better with a company that has a steady 3-5 year earnings growth history. That shortcoming could give investors one extra reason to be very careful about limiting losses.
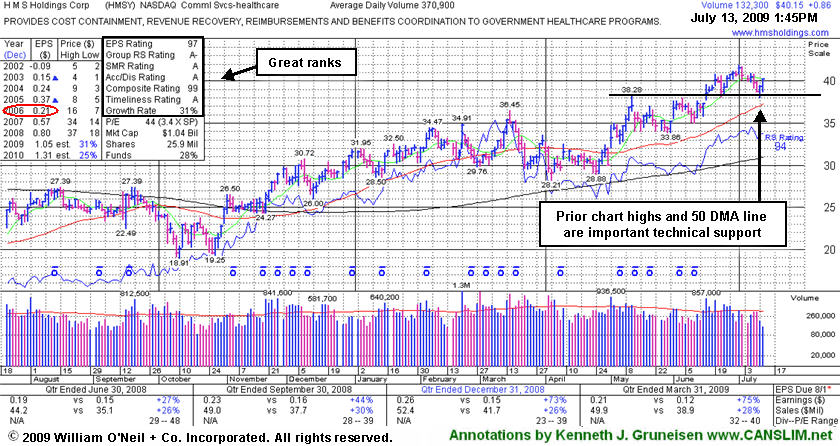
Healthy Consolidation For High-Ranked Healthcare Firm - Monday, July 13, 2009
HMS Holdings Corp (HMSY +$0.99 or +2.52% to $40.28) posted another gain on below average volume. It positively reversed on Friday after a pullback near prior highs in the $38 area which are a very important initial support level above its 50-day moving average (DMA) line. Last week it was noted as it briefly violated an upward trendline connecting its April-June lows (not shown), raising some concerns. Deterioration into its prior base, or a violation of its 50 DMA line, would raise more serious concerns and trigger technical sell signals. A gap up gain on 6/16/09 with heavy volume triggered a technical buy signal. No overhead supply is left to hinder the progress for this Commercial Services - Healthcare firm. During its latest base its daily volume totals dried up, yet the volume behind its breakout to new highs (the N criteria) day was nearly two and a half times its average volume total. The heavy volume and gap up also provided a nice reassurance of institutional (the I criteria) buying demand.
A downturn in 2006 earnings (see red circle) is a fundamental flaw in HMS Holdings Corp's annual earnings history that raises some concerns with respect to the A criteria of the investment system. Investors' odds are usually better with a company that has a steady 3-5 year earnings growth history. That shortcoming could give investors one extra reason to be very careful about limiting losses. The stock was first featured on Friday, February 20, 2009 in the CANSLIM.net Mid Day Breakouts Report (read here), then dropped from the Featured Stocks list on 4/02/09 due to weak action, returning yet again in yellow in the mid-day report on 5/01/09.
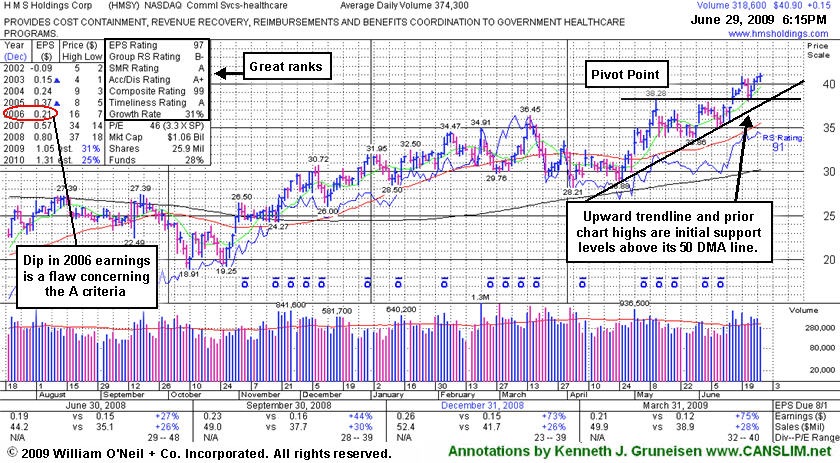
Healthcare Firm Quietly Rises Further From Prior Base - Monday, June 29, 2009
HMS Holdings Corp (HMSY +$0.15 or +0.37% to $40.90) posted a fourth consecutive gain, on lighter volume today, helped it reach a new all-time high and close above its "max buy" level. Its color code was changed to green after rising up more than +5% from its latest base. Disciplined investors avoid chasing stocks that are too extended from a sound base.
Prior chart highs near $38 are an important support level to watch, where deterioration into its prior base would raise concerns. A gap up gain on 6/16/09 with heavy volume triggered a technical buy signal. No overhead supply is left to hinder the progress for this Commercial Services - Healthcare firm. During its latest base its daily volume totals dried up, yet the volume behind its breakout to new highs (the N criteria) day was nearly two and a half times its average volume total. The heavy volume and gap up also provided a nice reassurance of institutional (the I criteria) buying demand.
A downturn in 2006 earnings (see red circle) is a fundamental flaw in HMS Holdings Corp's annual earnings history that raises some concerns with respect to the A criteria of the investment system. Investors' odds are usually better with a company that has a steady 3-5 year earnings growth history. This stock was first featured on Friday, February 20, 2009 in the CANSLIM.net Mid Day Breakouts Report (read here), then dropped from the Featured Stocks list on 4/02/09 due to weak action, returning yet again in yellow in the mid-day report on 5/01/09.
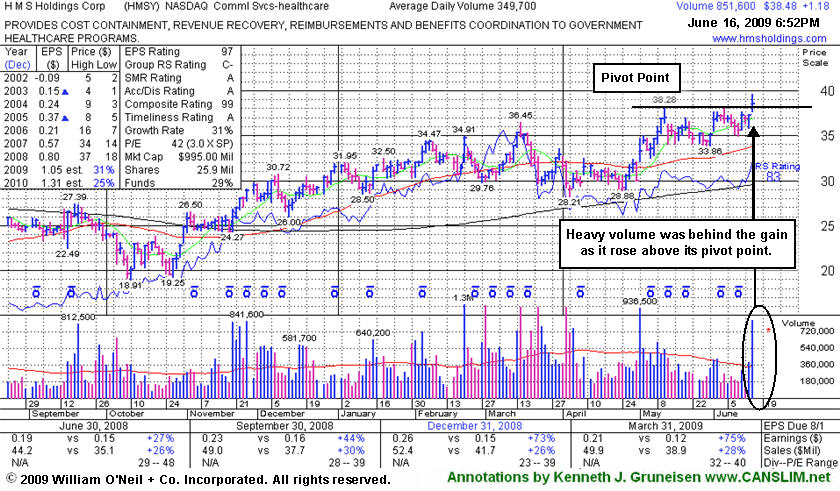
Gap Up Gain On High Volume Indicates Institutional Demand - Tuesday, June 16, 2009
HMS Holdings Corp (HMSY +$1.18 or +3.16% to $38.48) gapped up today and hit a new high with a solid gain on heavy volume, triggering a technical buy signal. The Commercial Services - Healthcare firm was helped by the healthcare group's standout gains on a mostly negative session. In its last appearance in this Featured Stock Update section, under the headline "Building An Orderly Flat Base" on June 11th (read here), an annotated graph showed it trading toward the high end of a near 5-week flat base above its 50-day moving average line. During its latest base its daily volume totals dried up, yet the volume behind its breakout to new highs (the N criteria) day was nearly two and a half times its average volume total. The heavy volume and gap up also provided a nice reassurance of institutional (the I criteria) buying demand.
A downturn in 2006 earnings is a fundamental flaw in HMS Holdings Corp's annual earnings history that raises some concerns with respect to the A criteria of the investment system. Investors' odds are usually better with a company that has a steady 3-5 year earnings growth history. This stock was first featured on Friday, February 20, 2009 in the CANSLIM.net Mid Day Breakouts Report (read here), then dropped from the Featured Stocks list on 4/02/09 due to weak action, returning yet again in yellow in the mid-day report on 5/01/09.
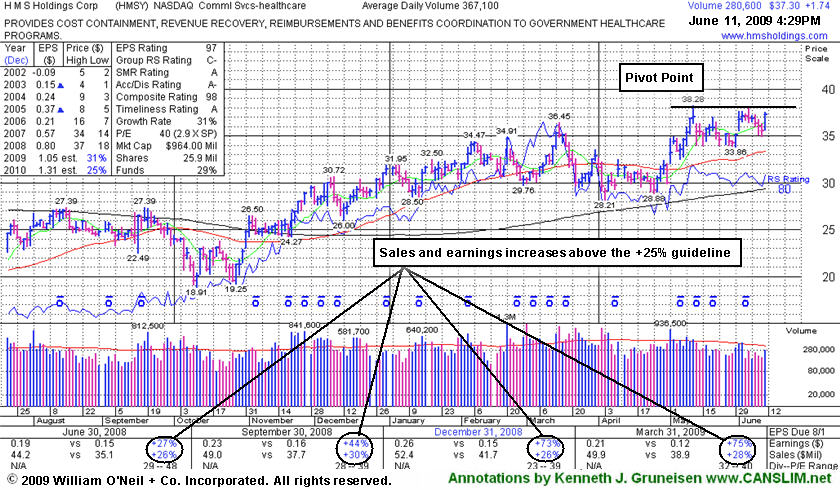
Buidling An Orderly Flat Base - Thursday, June 11, 2009
HMS Holdings Corp (HMSY +$1.74 or +4.89% to $37.30) ended today's session at a new high close after it posted a decent gain on light volume. It traded toward the high end of a near 5-week flat base above its 50-day moving average line, during which volume totals have been drying up. A new pivot point and max buy price were noted. Gains with sufficient volume are still needed to confirm a proper technical buy signal. The Commercial Services - Healthcare firm rallied to a 52-week high on 5/12/09, but it failed to produce gains with the volume needed to trigger a very convincing "breakout" or proper technical buy signal under the investment system's guidelines. Gains above a stock's pivot point need at least the minimum +50% above average volume, ideally much more volume, to meet the guidelines for buyable breakouts. Volume is a critical component to any breakout. Only when volume surges meaningfully behind a breakout from a sound base pattern do investors have the very important proof of heavy institutional (the I criteria) buying demand.
A downturn in 2006 earnings is a fundamental flaw in HMS Holdings Corp's annual earnings history that raises some concerns with respect to the A criteria of the investment system. Investors' odds are usually better with a company that has a steady 3-5 year earnings growth history. Technically, it is within close striking distance of all-time highs, and there is a chance HMSY might trigger a buy signal. This stock was first featured on Friday, February 20, 2009 in the CANSLIM.net Mid Day Breakouts Report (read here), then dropped from the Featured Stocks list on 4/02/09 due to weak action, returning yet again in yellow in the mid-day report on 5/01/09.
Quiet Consolidation May Be A High Handle - Thursday, May 28, 2009
HMS Holdings Corp (HMSY -$0.18 or -0.52% to $34.29) volume totals have been drying up in recent weeks while forming a downward sloping high handle, however the recent deterioration under its March high closes (the lower of 2 horizontal lines drawn) raises some concerns. The Commercial Services - Healthcare firm recently hit a new 52-week high, but it failed to produce confirming gains with the volume needed to trigger a convincing technical buy signal. Gains above a stock's pivot point need at least the minimum +50% above average volume, ideally much more volume, to meet the investment system's guidelines for buyable breakouts. Volume is a critical component to any breakout, and only when volume surges meaningfully behind a breakout from a sound base pattern do investors have important proof of heavy institutional (the I criteria) buying demand.
It is still within close striking distance of all-time highs and there is a chance HMSY might trigger a buy signal, however the group's Relative Strength rank has slipped from A in March to a D- now. Odds would be better for a stock in a group whose strength is improving. This stock was first featured on Friday, February 20, 2009 in the CANSLIM.net Mid Day Breakouts Report (read here), then dropped from the Featured Stocks list on 4/02/09 due to weak action, returning yet again in yellow in the mid-day report on 5/01/09.
C A N S L I M | StockTalk | News | Chart | SEC | Zacks Reports | ![]()
![]()
![]()

View all notes | Alert me of new notes | CANSLIM.net Company Profile
Volume Failed To Confirm Recent Breakout Try - Thursday, May 14, 2009
HMS Holdings Corp (HMSY -$0.01 or -0.03% to $35.49) held its ground today after its gap down on the prior session was noted as "a bearish sign", but subsequent deterioration leading to a close below its March 13 high close of $35.33 would raise more serious concerns. The high-ranked Commercial Services - Healthcare firm recently hit a new 52-week high, but it failed to produce confirming gains with the volume needed to trigger a convincing technical buy signal. Gains above a stock's pivot point need at least the minimum +50% above average volume, ideally much more volume, to meet the investment system's guidelines for buyable breakouts. Volume is a critical component to any breakout, and only when volume surges meaningfully behind a breakout from a sound base pattern do investors have important proof of heavy institutional (the I criteria) buying demand.
There is still a chance HMSY might trigger a buy signal, however the group's Relative Strength rank has slipped from A in March to a D now. Odds would be better for a stock in a group whose strength is improving. Still, no overhead supply would hinder its progress if it clears multi-year resistance in the $37 area. This stock was first featured on Friday, February 20, 2009 in the CANSLIM.net Mid Day Breakouts Report (read here), then dropped from the Featured Stocks list on 4/02/09 due to weak action, returning yet again in yellow in the mid-day report on 5/01/09.
C A N S L I M | StockTalk | News | Chart | SEC | Zacks Reports | ![]()
![]()
![]()

View all notes | Alert me of new notes | CANSLIM.net Company Profile
Resilient Healthcare Firm Gaps Up After Earnings News - Friday, May 01, 2009
HMS Holdings Corp (HMSY +$3.28 or +10.98% to $33.26) gapped up for a solid gain on heavy volume Friday after earnings beat Street expectations. Based on its resilience, this previously featured Commercial Services - Healthcare firm was color coded yellow and it was added to the Featured Stocks list with a new pivot point and max buy level while noted accordingly in the Mid-Day BreakOuts Report (read here). The high-ranked Commercial Services - Healthcare firm has shown solid quarterly sales revenues and earnings increases that satisfy the C criteria. A downturn in FY 2006 is the only flaw in its otherwise steady annual earnings (the A criteria) growth history. This stock was dropped from the Featured Stocks due to weak price/volume action shortly after it was first featured in yellow on Friday, February 20, 2009 in the CANSLIM.net Mid Day Breakouts Report (read here).
A considerable gain with above average volume helped it rally up from its 50 DMA line toward multi-year resistance in the $36-37 area. Its weekly graph below shows its 16-month cup-with-handle set-up. Technically, sufficient gains above the pivot point with heavy volume are still needed to confirm a proper buy signal.
C A N S L I M | StockTalk | News | Chart | SEC | Zacks Reports | ![]()
![]()
![]()

View all notes | Alert me of new notes | CANSLIM.net Company Profile
Prior Chart Lows Are Important Support Level Now - Thursday, March 26, 2009
HMS Holdings Corp (HMSY +$0.43 or +1.41% to $30.92) posted its third consecutive gain on ever lighter volume. After recently being hit with distributional pressure, its D+ rank for Accumulation/Distribution (see red circle) reflects that point. It has struggled since its last appearance in this FSU section under the headline "Negative Reversals Raise Concerns" (read here). A violation of recent chart lows would raise concerns and trigger more worrisome technical sell signals. For its outlook to improve, it needs to recover and trade back above its 50-day moving average (DMA) line.
HMSY has been holding its ground just above its prior chart lows since its considerable loss on 3/23/09 with heavier volume violated its 50 DMA line, triggering a technical sell signal. It was recently noted as "encountering distributional pressure", and its color code was changed to green. HMSY has shown good quarterly sales revenues and earnings increases. A downturn in FY 2006 is the only flaw in its otherwise steady annual earnings (the A criteria) growth history. This stock was first featured in yellow on Friday, February 20, 2009 in the CANSLIM.net Mid Day Breakouts Report (read here).
C A N S L I M | StockTalk | News | Chart | SEC | Zacks Reports | ![]()
![]()
![]()

View all notes | Alert me of new notes | CANSLIM.net Company Profile
Negative Reversals Raise Concerns - Monday, March 16, 2009
After a stock breaks out, it is imperative to continue monitoring its daily and weekly price and volume patterns for any possible ailments that may develop. Every so often, there are a few ominous technical signals that emerge. Prudent investors have learned to identify them due to the fact that they tend to lead to lower prices. One of these disconcerting technical signals is called a negative reversal. A negative reversal occurs when a stock opens up the session heading higher but then reverses and ultimately closes lower. Reversals are often considered more severe if the stock's initial gains lift it to a new high, but it then reverses and closes for a loss on heavier than average volume and ends near the session's utmost lows. Negative reversals can occur on a daily, weekly and monthly chart. In general, the longer the time frame involved, the more concern is prompted by the severity of the reversal. Volume is directly correlated with the severity as well.
HMS Holdings Corp (HMSY -$0.24 or -0.69% to $35.09) started the day marching to another new 52-week high. Keep in mind, there is still a limited amount of overhead supply remaining based on its prior all-time highs in the $37 area. The upward trendline identifies what may be considered another resistance level. The negative reversal for a loss on higher volume raised concerns and indicated distributional pressure - which is particularly ominous after it initially hit a new 52-week high. Healthy stocks rise on heavier volume, and then pull back with lighter volume totals. Investors who may have accumulated shares in the recent days should be disciplined about limiting losses, as always, if ever any stock falls 7-8% from your purchase price.
HMSY was first featured on Friday, February 20, 2009 in the Mid Day Breakouts Report (read here). The high-ranked Healthcare company has recently demonstrated good quarterly sales revenues and earnings increases, and it has shown resilience since it gapped down on 2/23/09 following an analyst downgrade. A downturn in FY 2006 is the only flaw in its otherwise steady annual earnings (the A criteria) growth history.
C A N S L I M | StockTalk | News | Chart | SEC | Zacks Reports | ![]()
![]()
![]()

View all notes | Alert me of new notes | CANSLIM.net Company Profile
Healthcare Group's Downturn Hurt Leader's Chances - Tuesday, March 03, 2009
Currently, the broader market direction (the M criteria) argues strongly against new buying efforts, even in the case of the bullish example below. Patience and discipline remain paramount. Don't worry about missing out on anything! In healthy market environments there is no shortage of strong buy candidates. Three out of four stocks tend to follow the direction of the major indices, so caution is warranted until a confirmed rally with a solid follow through day occurs.HMS Holdings Corp (HMSY +$0.80 or +2.64% to $31.13) blasted above its pivot point with a considerable gain on February 20, 2009 backed by nearly 4 times its average daily volume, breaking out from an "ascending base" pattern marked by 3 orderly pullbacks of 10-20%. This was clearly illustrated by the annotated graph included with its last appearance in this Featured Stock Update section on 2/20/09 under the headline, "Healthy Acting Leader Has Unhealthy Market To Contend With" (read here). It immediately ran into prompt resistance and was pressured under its 50 DMA line during a 4 session losing streak that began with a gap down on 2/23/09 following an analyst downgrade. HMSY still has good ranks after demonstrating strong quarterly sales and earnings increases above the +25% guideline. It would need to rally convincingly above its 50 DMA line for its outlook to improve, however that short term average may now act as resistance.
The trouble this high-ranked leader in the Commercial Services-Healthcare group has recently encountered reflects weak action in the broader market (the M criteria) as well as sharp deterioration in the healthcare group, which has taken a hit, but still remains in the preferred top quartile of the 197 Industry Groups, satisfying the L criteria. The Industry Group Watch section on last Thursday illustrated the impact on healthcare stocks as the government revealed plans for smaller increases in Medicare Advantage reimbursements (read here). HMSY was first featured in yellow in the 2/20/09 CANSLIM.net Mid Day Breakouts Report (read here).
C A N S L I M | StockTalk | News | Chart | SEC | Zacks Reports | ![]()
![]()
![]()

View all notes | Alert me of new notes | CANSLIM.net Company Profile
Healthy Acting Leader Has Unhealthy Market To Contend With - Friday, February 20, 2009
A classic example of the success enjoyed by many CANSLIM.net members usually starts when an investor reads a CANSLIM.net report and buys a featured stock before it has risen above the pivot point by greater than 5%. After a stock breaks out above its pivot point, there is only a 5% window that investors have to purchase the stock under the proper guidelines. Once a stock rises above the "maximum buy price" the risk of a shake out balloons, meaning that even a normal retracement in the stock might force you to employ the 7-8% loss cutting rule. Three out of four stocks tend to follow the direction of the major indices, so caution is warranted until a confirmed rally with a solid follow through day occurs. Currently, the broader market direction (the M criteria) argues strongly against new buying efforts, even in the case of the bullish example below. Patience and discipline remain paramount. Don't worry about missing out on anything! In healthy market environments there is no shortage of strong buy candidates.
HMS Holdings Corp (HMSY +$3.26 or +10.38% to $34.68) blasted above its pivot point with a considerable gain today backed by nearly 4 times its average daily volume, breaking out from an "ascending base" pattern marked by 3 orderly pullbacks of 10-20%. It has good ranks after demonstrating strong quarterly sales and earnings increases above the +25% guideline. It was featured in yellow in today's CANSLIM.net Mid Day Breakouts Report (read here).
C A N S L I M | StockTalk | News | Chart | SEC | Zacks Reports | ![]()
![]()
![]()

View all notes | Alert me of new notes | CANSLIM.net Company Profile