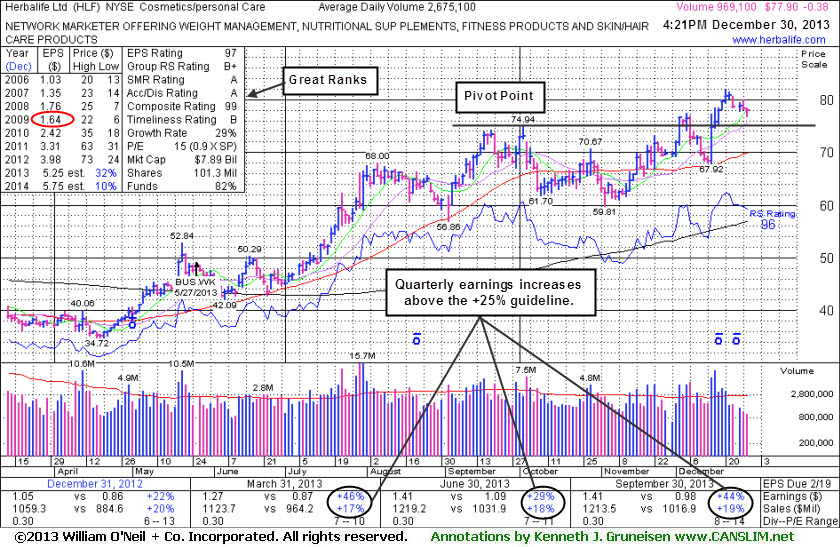
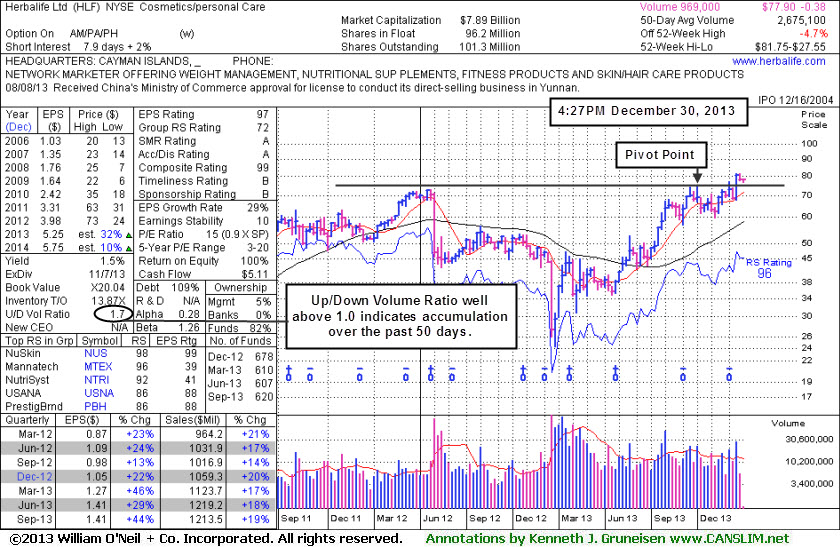
Herbalife Ltd (HLF -$0.43 or -0.55% to $77.85) is perched -4.7% off its 52-week high today. Few investors have headed for the exits lately as volume totals have been cooling following a streak of gains when rallying with no resistance due to overhead supply. Its last appearance in this FSU section was on 11/22/13 with an annotated graph under the headline, "Perched Near Highs Following Rebound", after highlighted in yellow with pivot point cited based on its 10/02/13 high plus 10 cents in the earlier mid-day report (read here). The subsequent breakout into new high territory with great volume conviction signaled the beginning of what may be a meaningful and sustained advance in price. Its color code was changed to yellow after quietly dipping below its "max buy" level. Disciplined investors always limit losses by selling if any stock falls more than -7% from their purchase price.
It reported earnings +44% on +19% sales for the quarter ended Sep 30, 2013 versus the year ago period, its 3rd consecutive quarterly earnings increase above the +25% minimum guideline (C criteria). Annual earnings (A criteria) have been strong after a downturn in FY '09. Leadership from other Cosmetics/ Personal Care firms is reassuring concerning the L criteria, however the Group Relative Strength Rating is still a rather mediocre 72 rating. Ownership by top-rated funds has recently been on the rise, increasing from 607 in Jun '13 to 620 in Sep '13, a reassuring sign concerning institutional interest (I criteria). Its current Up/Down Volume Ratio of 1.7 is an unbiased indication its shares have been under accumulation over the past 50 days.
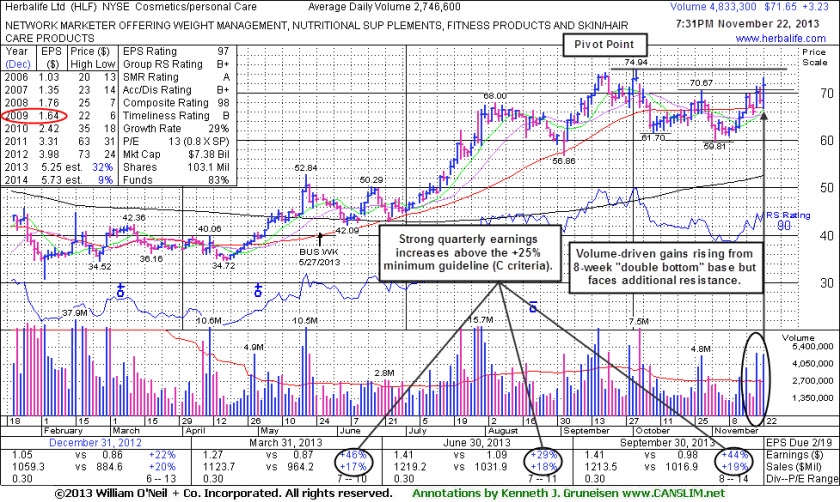
Herbalife Ltd (HLF +$3.23 or +4.72% to $71.65) was highlighted in yellow with pivot point cited based on its 10/02/13 high plus 10 cents in the earlier mid-day report (read here). Its gain Friday was backed by +76% above average volume it rallied from an 8-week "double bottom" base. However, it faces some additional resistance due to overhead supply, while a subsequent breakout into new high territory with great volume conviction could signal the beginning a meaningful advance in price.
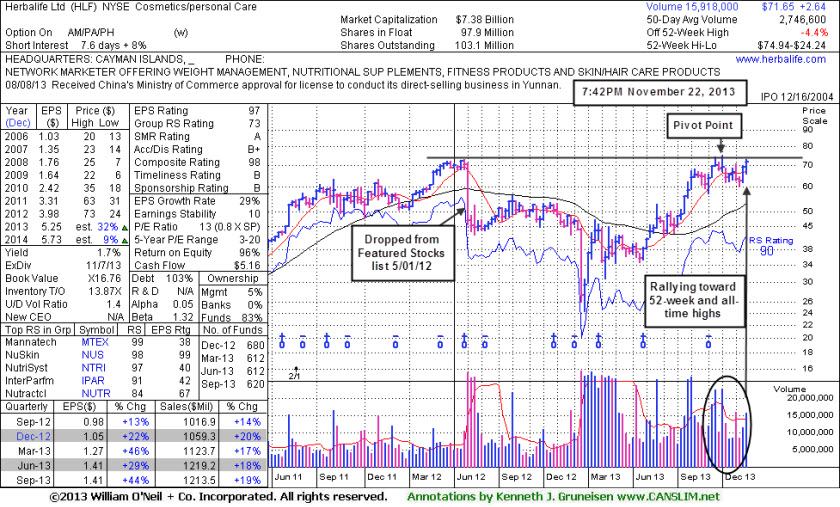
Its erratic history is of some concern, yet only little resistance remains due to overhead supply after recent volume-driven gains helped it rebound above its 50-day moving average (DMA) line. Its last appearance in this FSU section was on 4/1312 with an annotated graph under the headline, "Secondary Buy Point Following Earlier Breakout". It was dropped from the Featured Stocks list on 5/01/12 and went through a very deep consolidation below its 200 DMA line then rebounded impressively since.
It reported earnings +44% on +19% sales for the quarter ended Sep 30, 2013 versus the year ago period, its 3rd consecutive quarterly earnings increase above the +25% minimum guideline (C criteria). Annual earnings (A criteria) have been strong after a downturn in FY '09. Leadership from other Cosmetics/ Personal Care firms is reassuring concerning the L criteria, however the Group Relative Strength Rating is still a rather mediocre 73 rating. Ownership by top-rated funds has recently been on the rise, increasing from 612 in Jun '13 to 620 in Sep '13, a reassuring trend concerning institutional interest (I criteria). Its current Up/Down Volume Ratio of 1.4 is an unbiased indication its shares have been under accumulation over the past 50 days.
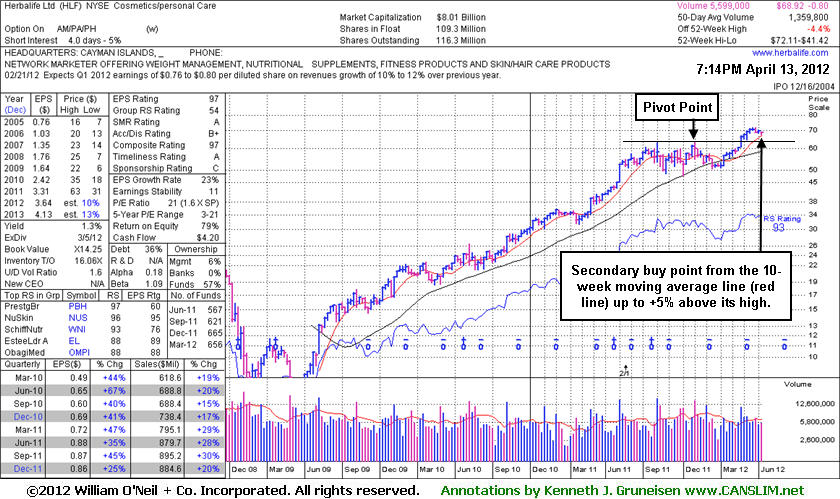
Herbalife Ltd (HLF +$0.25 or +0.36% to $68.92) is hovering only -5.7% off its all-time high today. Favorable characteristics and continued strength in the broader market (M criteria) may be critical to any stock's ongoing rally, as 3 out of 4 stocks typically follow the direction of the major indices. To avoid major setbacks disciplined investors always limit losses if a stock falls more than -7% from their buy point. In this case, the 50-day moving average comes into play as an important support level well above prior highs near $63 which define another very important chart support level to watch on pullbacks. Any slump leading to a close below its 50 DMA line would raise concerns and trigger technical sell signals.
In the Certification they teach that stocks can be bought from their first test of the 10-week moving average (WMA) line up to as much as +5% above the latest high following an earlier technical breakout. The approach offers investors a "secondary buy point" if they missed an opportunity to accumulate shares at an earlier breakout, or if they wish to make add-on purchases and "force feed" their winning positions. As long as HLF is successful in staying above its 10 WMA line, its shares could be accumulated up to +5% above its latest high, or $75.72. Obviously the further one chase a stock from a proper base the greater the risk becomes that an ordinary pullback may prompt investors to limit their losses at the -7% threshold.
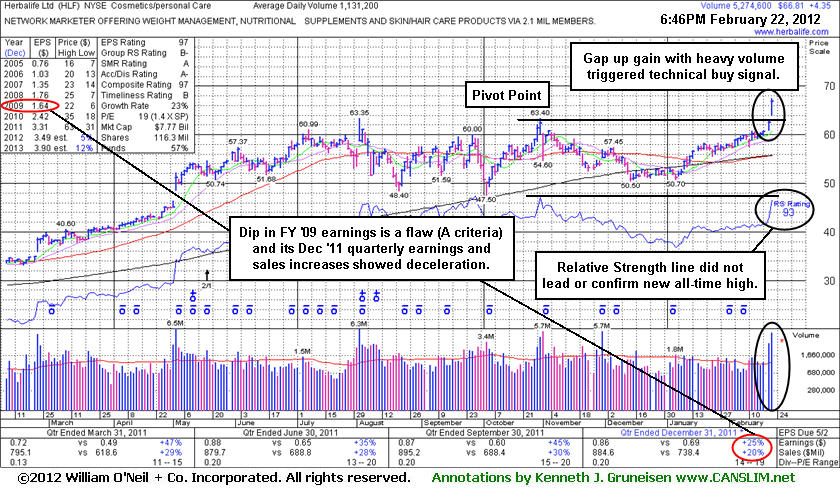
Its last appearance in this FSU section was on 2/22/12 with an annotated graph under the headline, "Former Favorite Attracting Fresh Institutional Demand", as it gapped up for a 5th consecutive gain and a new 52-week high (N criteria). In the mid-day report that day it was featured in yellow with pivot point based on its old high plus 10 cents, which it cleared, triggering a technical buy signal. The breakout was backed by more than 4 times average volume, a clear sign of institutional demand.
HLF reported earnings +25% on +20% sales revenues for the quarter ended December 31, 2011 versus the year ago period. It has shown strong sales revenues and earnings increases in prior quarterly comparisons versus the year ago period(s) satisfying the C criteria, however, the deceleration to near the minimum guideline for earnings increases may be considered a less than reassuring sign. Acceleration and bigger percentage increases, sequentially, in the year over-year comparisons is preferred over flat or decelerating growth rates.
Leadership from other Cosmetics/ Personal Care firms is reassuring concerning the L criteria, however the Group Relative Strength rating is now a mediocre 54 Rating. Ownership by top-rated funds has generally been on the rise, increasing from 567 in Jun '11 to 656 in Mar '12, a reassuring trend concerning institutional interest (I criteria).
It found support near its 200-day moving average (DMA) line during a 16-week consolidation since noted in the 10/31/11 mid-day report as it hit its old high - "This high-ranked Cosmetics / Personal Care group leader had a downward turn in FY '09 annual earnings history (flaw in respect to A criteria)." Ownership by top-rated funds has been on the rise, increasing from 560 in Jun '11 to 627 in Dec '11, a reassuring trend concerning institutional interest (I criteria). Additionally, leadership from other Cosmetics/ Personal Care firms is reassuring concerning the L criteria. Favorable characteristics and continued strength in the broader market (M criteria) may be helpful, however disciplined investors always limit losses if a stock falls more than -7% from their buy point. In this case, prior highs near $63 define initial chart support to watch on pullbacks. Any slump leading to a close below its old high close would raise concerns and hurt its outlook by negating the breakout.
Its 93 Relative Strength Rating is well above the 80+ minimum guideline for buy candidates. However, one thing shown on the annotated graph below is the fact that its Relative Strength line (blue jagged line) was actually higher last year than where it is currently plotted. Based on historic studies it is preferred that the RS line lead the way into new high territory and be claiming its own new high ground before the share price reaches new high territory. It is less reassuring in this case where the RS line is not leading or confirming.
The stock made an impressive recovery in recent years but went through a deep correction and fell from $21 to $6 following its last appearance in this FSU section on 4/22/08 with an annotated graph under the headline, "Technical Breakdown Triggers Sell Signals" as it plunged below its 50 DMA line and negated its breakout by falling back in its prior base. As technical sell signals were noted and it was dropped from the Featured Stocks page the article warned members - "Remember that it is of the utmost importance to quickly sell any stock when it triggers a technical sell signal. One of the critical characteristics of successful investing is knowing when to sell. Investors are best served when they buy based on the combination of strong fundamentals and technicals, then sell based on the technicals. The reason is because fundamentals often tend to lag a stock's technical condition and come to light later to help explain the technical chart action after the fact."
A very important technical tool that savvy investors have learned to incorporate in their technical analysis is the 50-day moving average (DMA) line. The 50 DMA line plays a pivotal role relative to a stock's price. If the price of a stock is above its 50 DMA then odds are that its 50 DMA will act as formidable support. Conversely, if the price is below its 50 DMA then the moving average acts as resistance. Healthy stocks sometimes trade under their 50 DMA lines briefly, but usually a strong candidate will promptly bounce and repair a 50 DMA violation. When a stock has violated its 50 DMA line and then lingers beneath it, the stock's outlook gets worse and worse as it spends a greater period of time trading under that important short-term average line. Once the 50 DMA line starts sloping downward it should also be acknowledged that the stock has been struggling for a while, and it might be time to reduce exposure and look for places to put that money to work in stronger buy candidates.
Herbalife Ltd (HLF -$3.73 or -9.36% to $43.57) plunged today and sliced below its 50 DMA line on above average volume, triggering technical sell signals and negating its latest breakout by falling back in its prior base. Remember that it is of the utmost importance to quickly sell any stock when it triggers a technical sell signal. One of the critical characteristics of successful investing is knowing when to sell. Investors are best served when they buy based on the combination of strong fundamentals and technicals, then sell based on the technicals. The reason is because fundamentals often tend to lag a stock's technical condition and come to light later to help explain the technical chart action after the fact.
HLF was featured in the 2/28/08 CANSLIM.net Mid-Day BreakOuts Report with a $46.14 pivot point (read here). Herbalife has a solid earnings growth and accelerating sales revenues growth history in recent quarterly comparisons, and it also has a attractive annual earnings growth history that helps to satisfy the A criteria. The Featured Stock Update section of the 3/14/08 CANSLIM.net After Market Update showed its recent breakout (read here). The stock broke out before the March 20, 2008 follow-through day, and it rallied as much as 9% before today's technical deterioration. Concerns were raised by the poor technical action as it gapped down on 4/11/08 after an analyst's "fraud discovery warning" (read here). Based on the latest weak technical action it will be dropped from the Featured Stocks list tonight.
C A N S L I M | StockTalk | News | Chart | SEC | Zacks Reports | ![]()
![]()
![]()
View all notes | Alert me of new notes | CANSLIM.net Company Profile
Statistically, about 40% of winning stocks will pull back after breaking out. In other words, it is not uncommon for stocks to pullback and retest support near their pivot point after breaking out. It is important to see the bulls show up and offer support at or above the pivot point. This may offer investors a chance to increase their exposure before the stock continues advancing. However, an important caveat is that volume should contract as the stock pulls back towards its pivot point. Heavy volume behind losses can be cause for concern, especially if the stock does not find support at its pivot point. Whenever a recent breakout is completely negated by a loss that leads to a close back in the prior base, this is construed as a technical sell signal and a sign that the bears are regaining control.
Herbalife Ltd.(HLF -$0.17 or -0.37% to $46.72) pulled back and retested its prior chart highs near $46. This high ranked leader traded above its latest $46.14 pivot point on 3/12/08 to new all-time highs with volume more than double its average daily trading total, enough to trigger a new technical buy signal. However, there are still concerns about the M criteria which make any new buying efforts questionable without a follow through day of solid gains on heavy volume. Disciplined investors also know to avoid buying stocks that are extended from an ideal buy point, so it would be most ideal if a chance comes to accumulate shares without paying above the $48.45 max buy price at +5% above its pivot point.
HLF was featured in the 2/28/08 CANSLIM.net Mid-Day BreakOuts Report (read here). Herbalife has shown solid earnings growth and accelerating sales revenues growth in recent quarterly comparisons, and it also has a attractive annual earnings growth history that helps to satisfy the A criteria. HLF sports very healthy ranks, and faces very little resistance due to overhead supply now. Its Earnings Per Share (EPS) stands at a firm 95 and its Relative Strength (RS) rating is a solid 92. It gapped up on 2/27/08 after reporting strong earnings and raising its profit outlook. Its good annual and quarterly earnings growth history satisfies the C and A criteria. Remember that 3 out of 4 growth stocks move in tandem with the major averages. Therefore, it is imperative to remain patient and wait for this nascent rally attempt to be confirmed before initiating any new positions. This high-ranked leader should remain on an active watchlist until the major averages produce a new follow-through.
C A N S L I M | StockTalk | News | Chart | SEC | Zacks Reports |
View all notes | Alert me of new notes | CANSLIM.net Company Profile
|
Herbalife Ltd. |
| |
|
Ticker Symbol: HLF (NYSE) |
Industry Group: Cosmetics/Personal Care |
Shares Outstanding: 70,200,000 |
|
Price: $39.90 4:04PM ET |
Day's Volume: 259,000 6/30/2006 4:04PM ET |
Shares in Float: 54,800,000 |
|
52 Week High: $41.21 6/30/2006 4:04PM ET |
50-Day Average Volume: 401,200 |
Up/Down Volume Ratio: 1.7 |
|
Pivot Point: $40.99 5/16/2006 high plus .10 |
Pivot Point +5% = Max Buy Price: $43.04 |
Web Address: http://www.herbalife.com/ |
C A N S L I M | StockTalk | News | Chart | SEC | Zacks Reports
View all notes | Alert me of new notes | CANSLIM.net Company Profile
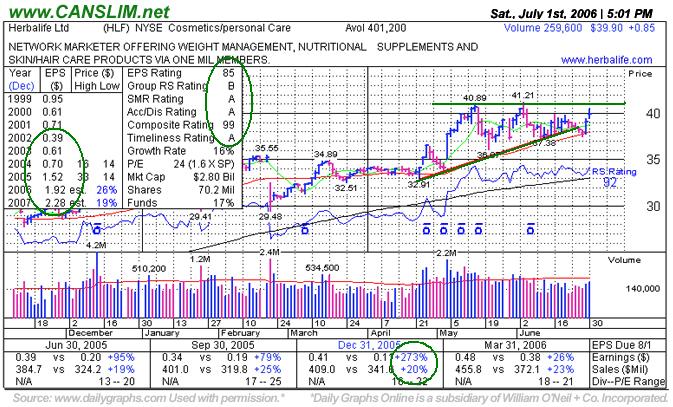
CANSLIM.net Profile: Herbalife, Ltd. engages in the marketing and sale of weight management, nutritional supplement, and personal care products. Its weight management products include meal replacements; weight-loss accelerators; appetite suppression products; healthy snacks; Niteworks that supports energy and vascular and circulatory health; and ShapeWorks, a weight management program that personalizes protein intake and also includes a customized meal plan. Its earnings per share have steadily increased by more than +95%, +79%, +273%, and +26% respectively in the past four quarterly financial comparisons in Jun, Sep, Dec '05, and Mar '06 versus the year earlier help this issue meet the "C", and it has a strong annual earnings history since it began trading in 2004. Return on Equity is an almost unheard of 95%, sharply higher than the +17% guideline. During the past two months while this issue has been steadily basing its relative strength rating has jumped. This high-ranked leader hails from the Cosmetics/Personal Care group which is currently ranked 72nd out of 197 Industry Groups tracked for relative price performance over the past 6 months, and while that is not in the top quartile, there has been additional leadership in the industry group to satisfy the "L" criteria. Management owns a 22% stake, keeping them keenly focused on shareholder value.
What to Look For and What to Look Out For: Look for this issue to eventually test upper boundary of its new base. Ideally, for the bulls, a breakout of its new base on above average volume at least +50% would trigger a new technical buy signal. Upon a fresh technical breakout to new highs with at least +50% heavier than average volume, odds would then favor further price gains. On the other hand, if the present base's lows and 50 DMA are violated, look out for the bears to regain control and by sending prices back into the prior base (under $35). If this occurs the prior breakout would be totally negated, and technically the outlook would change for the worse.
Technical Analysis: This stock is currently building an impressive base-on-base pattern. It late April this stock blasted out of a 4-month base to new highs on two consecutive days of gains on massive volume and triggered a new technical buy signal. Immediately thereafter, this issue pulled back on about average volume and found support at its 50 DMA. During the recent period of market weakness HLF found support above its 50 DMA line which should continue to serve as a key support level in the weeks and months to come.
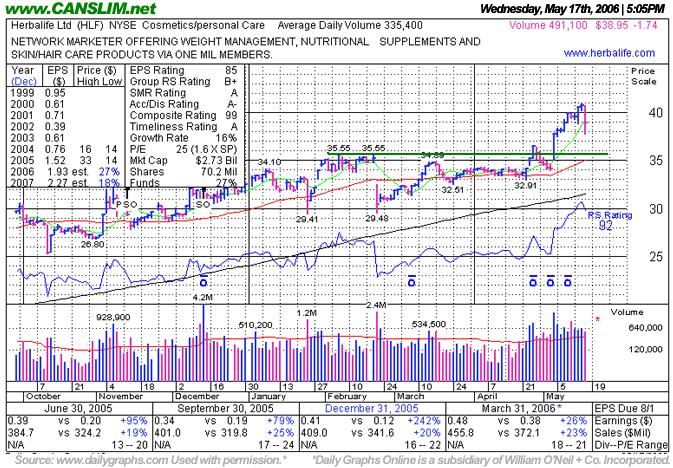
A classic example of the success enjoyed by many CANSLIM.net readers usually starts when an investor reads a CANSLIM.net report and buys a featured stock before it has risen above the pivot point by greater than 5%. After a stock breaks out above its pivot point, there is only a +5% window that investors have to purchase the stock under the proper guidelines. Once a stock rises above the "maximum buy price" the risk of a shake out balloons, meaning that even a normal retracement in the stock might force you to employ the 7-8% loss cutting rule. Much can be told by the stock's daily action in the weeks and months that follow a breakout. Typically, a light volume and orderly pullback suggests that the bulls remain in control. However, high volume pullbacks that violate support paint a totally different picture.
Herbalife Ltd. (HLF -$0.30 or -0.77% to $38.64) ended lower on below average turnover on Friday. This stock was featured on Monday, January 30th, 2006 in the CANSLIM.net Mid-Day BreakOuts Report (read here). A big gap down after its earnings release on February 22nd, 2006 flashed a clear technical sell signal, however the stock managed to eventually claw its way back above its 50-day moving average (DMA) line. On April 25th it was again featured prominently, this time in the CANSLIM.net After-Market Update with the headline, "Rise Above New Pivot Point Leaves Minimal Overhead Supply Left", calling attention to the stock's bullish chart (read here). Then it blasted to new highs on massive volume on May 4th, 2006 after reporting solid first quarter results, prompting the note "Gap open and solid gains to new highs today triggering a technical buy signal" in that day's Mid-Day BreakOuts Report (read here). Since then, this issue has traded above its $35.65 pivot point by nearly +16% and has spent the past few weeks tracing out its base-on-base pattern. It is impressive that this stock has managed to move to new highs and hold up so well while the major indices broke through support, a bullish divergence. As long as this issue continues trading above its pivot point then odds favor that higher prices will follow.
C A N S L I M | StockTalk | News | Chart | SEC | Zacks Reports
View all notes | Alert me of new notes | CANSLIM.net Company Profile
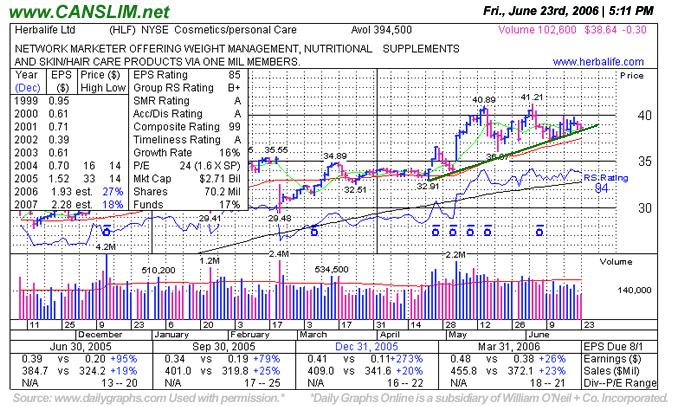
A classic example of the success enjoyed by many CANSLIM.net readers usually starts when an investor reads a CANSLIM.net report and buys a featured stock before it has risen above the pivot point by greater than 5%. After a stock breaks out above its pivot point, there is only a +5% window that investors have to purchase the stock under the proper guidelines. Once a stock rises above the "maximum buy price" the risk of a shake out balloons, meaning that even a normal retracement in the stock might force you to employ the 7-8% loss cutting rule. Much can be told by the stock's daily action in the weeks and months that follow a breakout. Typically, a light volume and orderly pullback suggests that the bulls remain in control. However, high volume pullbacks that violate support paint a totally different picture.
Herbalife Ltd. (HLF -1.74 or -4.28% to $38.95) closed lower on above average volume, however the total today was lower than the volume behind its recent advance. This stock was featured on Monday, January 30th, 2006 in the CANSLIM.net Mid-Day BreakOuts Report (read here). More recently, this issue blasted to new highs on massive volume on May 4th, 2006 after reporting solid first quarter results, prompting the note "Gap open and solid gains to new highs today triggering a technical buy signal" in that day's Mid-Day BreakOuts Report (read here). Since then, this issue has traded above its $39.65 pivot point by as much as +14.69%. Technically, the pullback is no cause for alarm at present, as any stock will normally take time to consolidate after a meaningful gain. It is impressive that this stock has managed to move to new highs while the major indices broke through support, a bullish divergence. If the broader market continues moving lower, however, a strong defense is even more important.
C A N S L I M | StockTalk | News | Chart | ![]() DGO | SEC | Zacks Reports
DGO | SEC | Zacks Reports
View all notes | Alert me of new notes | CANSLIM.net Company Profile
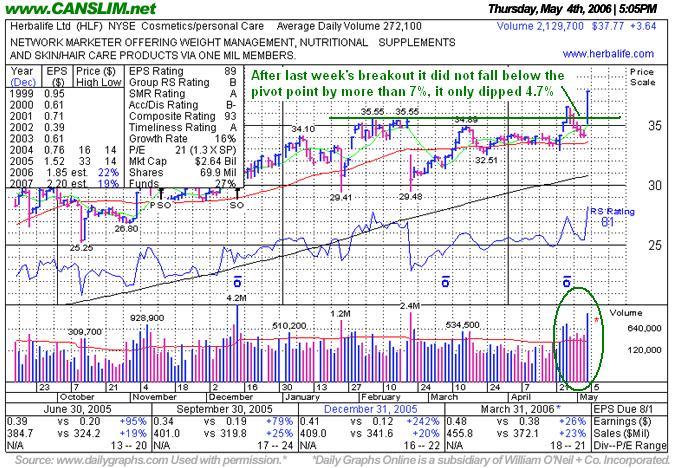
Once again, the "L" criteria in CAN SLIM(TM) tells investors to choose leading companies in leading industry groups, and when we have identified a high-ranked leader with the proper characteristics we should wait and watch for gains on at least +50% above average volume as a confirmation that a breakout is attracting meaningful institutional sponsorship. A classic example of the success enjoyed by many CANSLIM.net readers usually starts when an investor reads a CANSLIM.net report and buys a featured stock immediately after it rises above its pivot point, as makes their entry as close to it as possible, always before it rises beyond the pivot point by greater than 5%. After a stock triggers a technical buy signal and is purchased, it is always important to employ the 7-8% loss cutting rule in the event of a downturn. All stocks encounter some selling pressure from time to time, however a healthy company will not normally fall more than 7% under its pivot point.
Herbalife Ltd. (HLF +$3.64 or +8.79% to $37.77) gapped up for considerable gains on more than 7 times normal turnover on Thursday, ending the session three cents off its new all-time high. This stock was featured on Monday, January 30th, 2006 in the CANSLIM.net Mid Day Breakouts Report (read here) at $33.14. HLF was more recently highlighted with an annotated DailyGraph(R) in this section of the CANSLIM.net after-Market Update last Tuesday, April 25th, 2006, as it was gapping to new highs (read here). Then it followed through to the upside on the following session, rising on enormous volume as it broke to new highs out of a solid 5 month base. However, that bullish breakout action was followed by 5 consecutive trading sessions that tested the bulls' resolve. Note that all of those down sessions were on volume that was average or above average, yet those totals paled in comparison to the impressive up days' massive volume. The bulls regained control after HLF released their first quarter results, and the stock was rewarded accordingly as the company surpassed the estimates. Now that this issue managed to break out, then pulled back to test the bulls' resolve, then followed through with confirming gains, any further breakdown beyond the chart support in the $34-35 range would not be quite disconcerting, and would technically be considered a clear sell signal.
C A N S L I M | StockTalk | News | Chart | ![]() DGO | SEC | Zacks Reports
DGO | SEC | Zacks Reports
View all notes | Alert me of new notes | CANSLIM.net Company Profile
Often, when a leading stock is setting up to breakout of a solid base, it is highlighted in CANSLIM.net's Mid-Day Breakouts Report. The most relevant factors are noted in the report which allows prudent CANSLIM oriented investors to place the issue in their watch list. After doing any necessary backup research, the investor is prepared to act if and when the stock triggers a technical buy signal (breaks above its pivot point on more than +50% average turnover). In the event the stock fails to trigger a technical buy signal and its price declines then it will simply be removed from the watch list.
Herbalife Ltd. (HLF +$1.08 or +3.16% to $35.23) gapped up today and closed one penny below its session's high with a considerable gain on more than three times its normal turnover. This stock was first featured on Monday, January 30th, 2006 in the CANSLIM.net Mid Day Breakouts Report (read here) at $33.14. After this issue broke out and triggered its first technical buy signal, it soon thereafter gapped down under its 50-day moving average (DMA) line on February 22nd and spent the next three weeks repairing the violation. Interestingly, HLF reversed from its lows just yesterday, finding prompt support at its 50 DMA line, ultimately rising above the new pivot point of $34.99 (its March 16th high plus $0.10), triggering a new technical buy signal. Very little resistance remains at prior all-time highs. Follow thru gains tomorrow, on above average volumes, would serve as a great confirmation.
C A N S L I M | StockTalk | News | Chart | SEC | Zacks Reports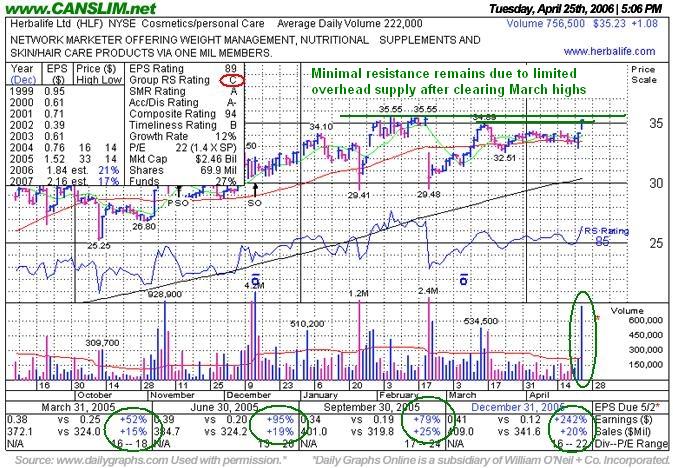
View all notes | Alert me of new notes | CANSLIM.net Company Profile