Fundamental and Technical Deterioration Raised Concerns - Friday, August 01, 2014
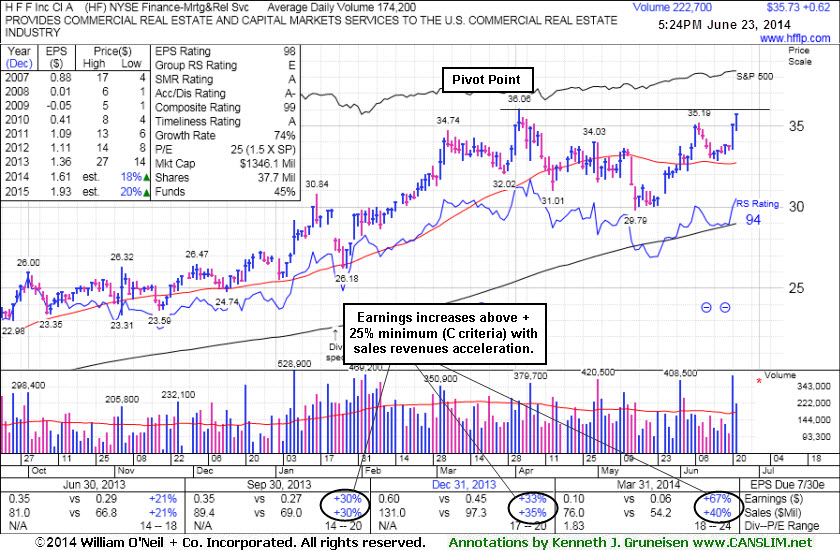
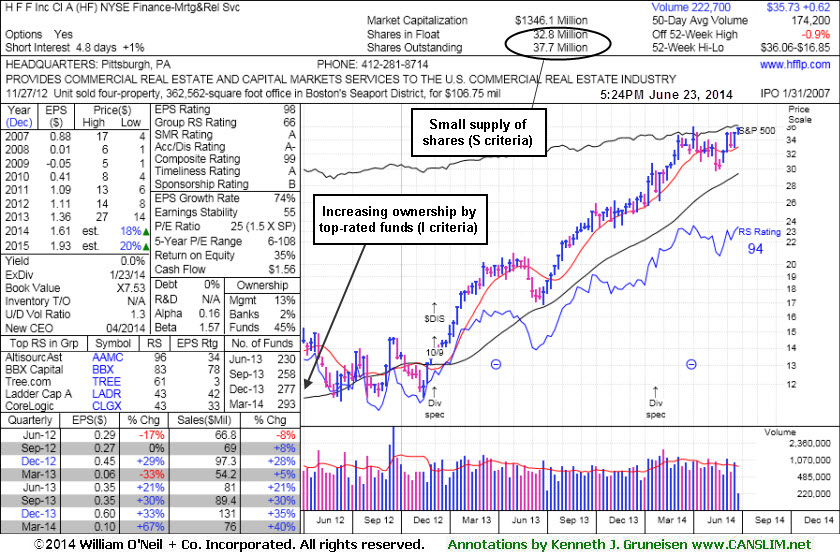
H F F Inc (HF -$3.46 or -10.19% to $30.50) suffered a damaging loss today with heavy volume triggering more worrisome technical sell signals. It reported earnings -6% on +17% sales revenues, well below the +25% minimum earnings guideline (C criteria). Its recent slump below its 50-day moving average (DMA) was noted as it raised concerns. It was last shown in this FSU section on 7/15/14 with annotated graphs under the headline, "Slump Into Prior Base Negated Recent Breakout", when members were reminded - "Disciplined investors limit losses by selling any stock that falls more than -7% from their purchase price." Due to the weak technical action and fundamental deterioration it will be dropped from the Featured Stocks list tonight.It was highlighted in yellow with pivot point cited based on its 4/02/14 high plus 10 cents in the 6/20/14 mid-day report (click here). The 3 prior quarterly comparisons were above the +25% minimum earnings guideline (C criteria). Its annual earnings (A criteria) history improved since a drastic downturn and losses in FY '09. The small supply (S criteria) of only 37.7 million shares outstanding can contribute to price volatility in the event of institutional buying or selling. The number of top-rated funds owning its shares rose from 230 in Jun '13 to 301 in Jun '14, a reassuring sign concerning the I criteria. Its current Up/Down Volume Ratio of 1.5 is an unbiased indication its shares have been under accumulation over the past 50 days.
Slump Into Prior Base Negated Recent Breakout - Tuesday, July 15, 2014
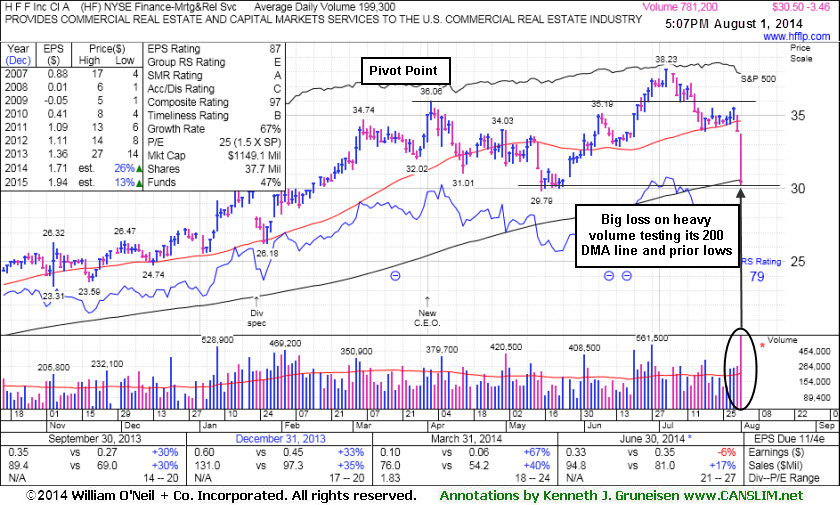
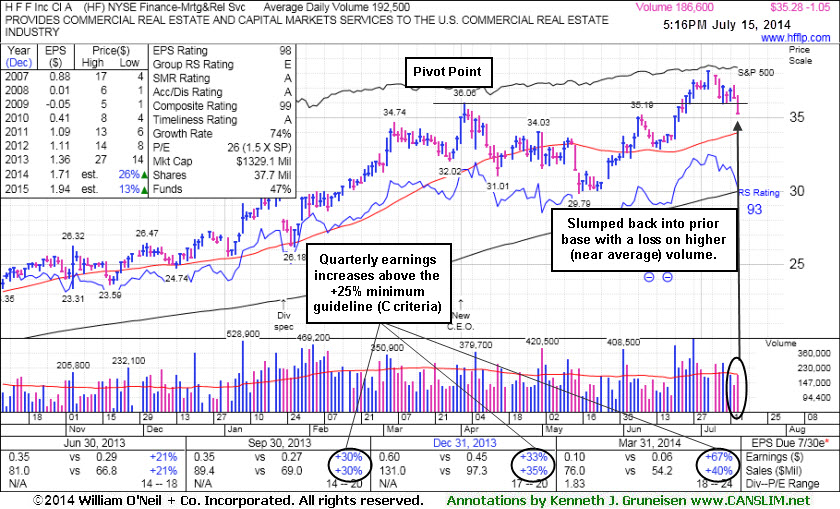
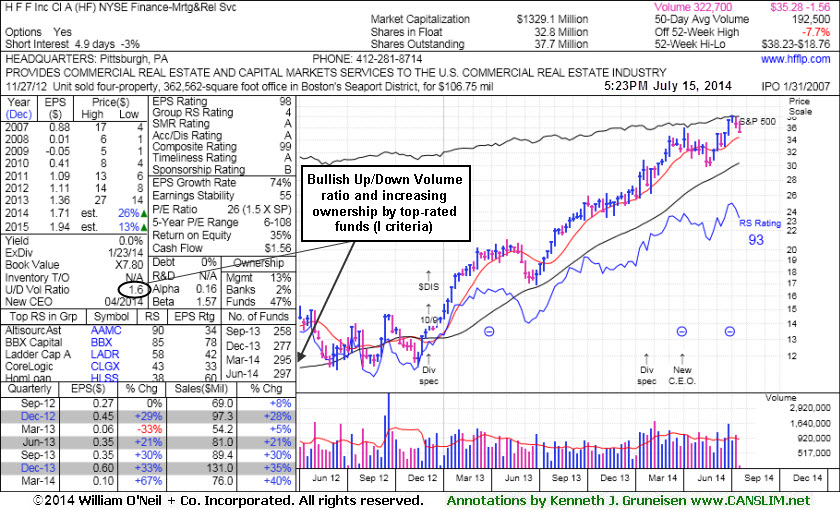
H F F Inc (HF -$1.05 or -2.89% to $35.28) slumped below its pivot point today and fell back into its prior base raising some concerns as it finished near the session low with a loss on below average volume. Disciplined investors limit losses by selling any stock that falls more than -7% from their purchase price. Prior highs in the $35 area define initial support to watch and its 50-day moving average (DMA) line defines the next important support level. It was last shown in this FSU section on 6/23/14 with annotated graphs under the headline, "Approached 52-Week High With Volume-Driven Gain", and subsequent gains above the pivot point backed by above average triggered a proper technical buy signal. It was highlighted in yellow with pivot point cited based on its 4/02/14 high plus 10 cents in the 6/20/14 mid-day report (click here).
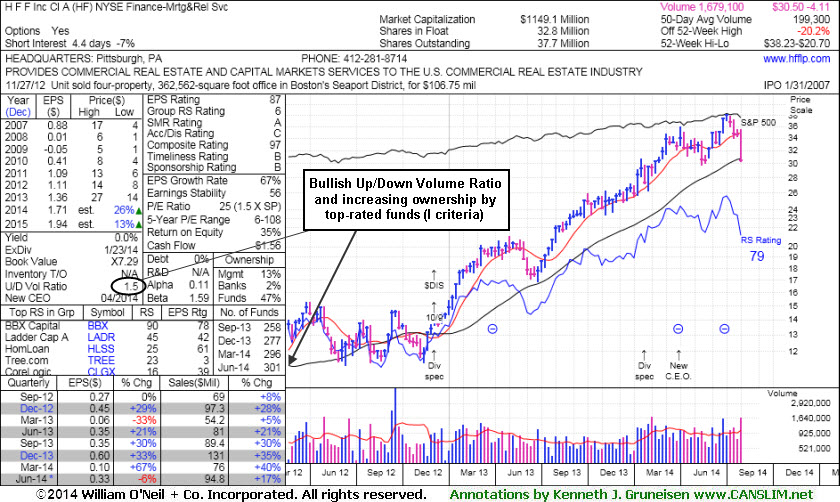
Fundamentals are very strong as it has earned a 98 Earnings Per Share Rating. It reported earnings +67% on +40% sales revenues for the Mar '14 quarter, its 3rd consecutive quarterly comparison above the +25% minimum earnings guideline (C criteria). Its annual earnings (A criteria) history has improved since a drastic downturn and losses in FY '09. The small supply (S criteria) of only 37.7 million shares outstanding can contribute to price volatility in the event of institutional buying or selling. The number of top-rated funds owning its shares rose from 230 in Jun '13 to 297 in Jun '14, a reassuring sign concerning the I criteria. Its current Up/Down Volume Ratio of 1.6 is an unbiased indication its shares have been under accumulation over the past 50 days.
Approached 52-Week High With Volume-Driven Gain - Monday, June 23, 2014
H F F Inc (HF +$0.62 or +1.77% to $35.73) tallied a gain today with +35% above average volume and finished at a best-ever close. It was highlighted in yellow with pivot point cited based on its 4/02/14 high plus 10 cents in the 6/20/14 mid-day report (click here). Subsequent gains above the pivot point backed by at least +40% above average volume are still needed to confirm a proper technical buy signal. It recently found support above its 50-day moving average (DMA) line when consolidating after nearly challenging its 52-week high.
Fundamentals are very strong as it has earned a 98 Earnings Per Share Rating. It reported earnings +67% on +40% sales revenues for the Mar '14 quarter, its 3rd consecutive quarterly comparison above the +25% minimum earnings guideline (C criteria). Its annual earnings (A criteria) history has improved since a drastic downturn and losses in FY '09.
The small supply (S criteria) of only 37.7 million shares outstanding can contribute to price volatility in the event of institutional buying or selling. The number of top-rated funds owning its shares rose from 230 in Jun '13 to 293 in Mar '14, a reassuring sign concerning the I criteria. Its current Up/Down Volume Ratio of 1.3 is an unbiased indication its shares have been under accumulation over the past 50 days.
