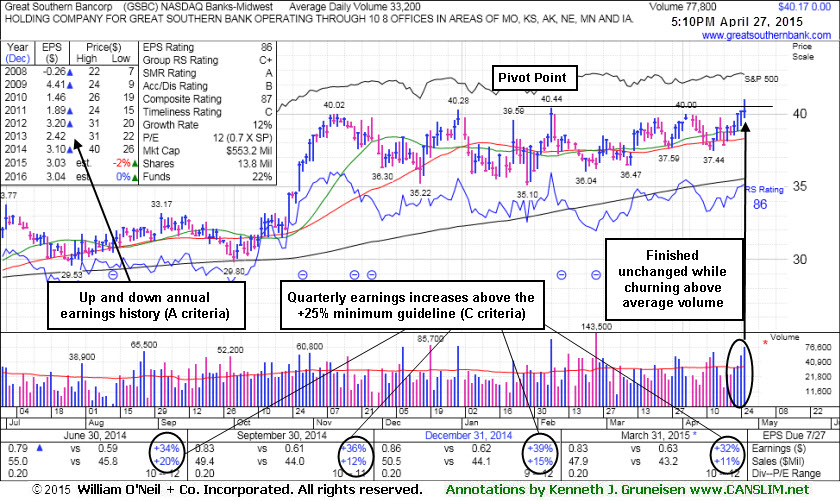
Finding Support While Consolidating After Sub Par Quarter - Thursday, July 30, 2015
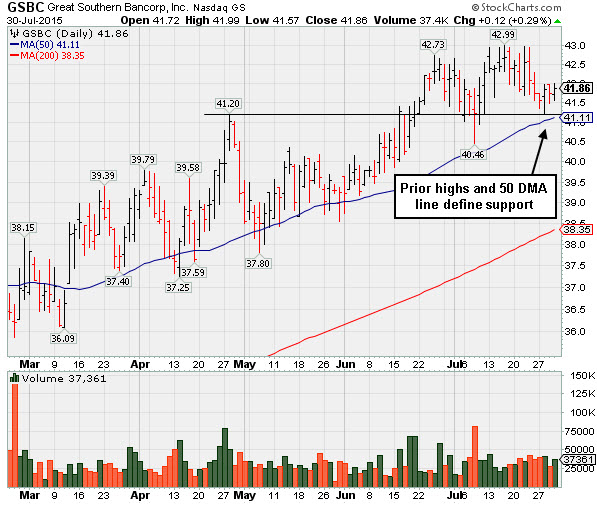
Finding Support Near Prior Highs and 50-Day Moving Average - Thursday, July 9, 2015
Great Southern Bancorp (GSBC +$0.29 or +0.70% to $41.51) is consolidating near prior highs in the $41 area. Its 50-day moving average (DMA) line ($40.41) also defines important support where a violation would trigger a technical sell signal. GSBC was last shown in this FSU section on 6/09/15 with an annotated graph under the headline, "Still Finding Support at 50-Day Moving Average".The number of top-rated funds owning is shares rose from 162 in Jun '14 to 191 in Jun '15, a reassuring sign concerning the I criteria. Its current Up/Down Volume Ratio of 1.1 is an unbiased indication that its shares have been under slight accumulation over the past 50 days.
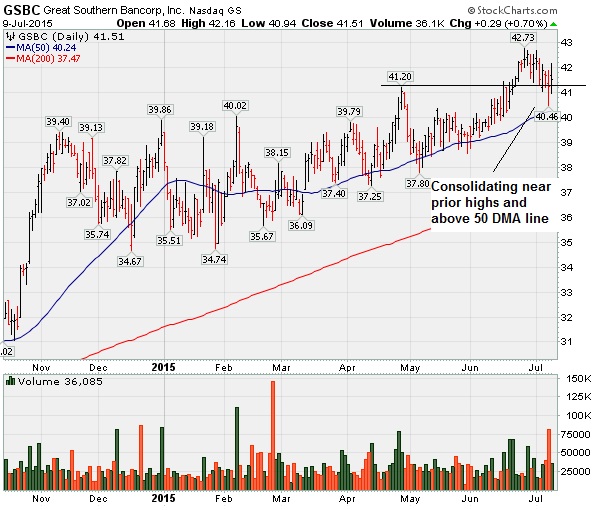
Still Finding Support at 50-Day Moving Average - Tuesday, June 9, 2015
Great Southern Bancorp (GSBC -$0.16 or -0.40% to $39.84) has been finding support above its 50-day moving average (DMA) line ($39.39). Recent lows ($38.00 on 5/06/15) define the next important support below that important short-term average where a violation would trigger a technical sell signal.
GSBC was last shown in this FSU section on 5/14/15 with annotated graphs under the headline, "Found Reassuring Support at 50-Day Moving Average Line". It produced a gain above the pivot point with at least +40% above average volume and triggered a technical buy signal in late April, however, it stalled and encountered distributional pressure right away.
The number of top-rated funds owning is shares rose from 162 in Jun '14 to 189 in Mar '15, a reassuring sign concerning the I criteria. Its current Up/Down Volume Ratio of 1.5 is an unbiased indication that its shares have been under accumulation over the past 50 days.

Found Reassuring Support at 50-Day Moving Average Line - Thursday, May 14, 2015
Great Southern Bancorp (GSBC +0.06 or +0.15% to $40.14) tallied a gain with near average volume while rising from support at its 50-day moving average (DMA) line ($38.88). Recent lows ($38.00 on 5/06/15) define the next important support where any subsequent violations would raise concerns and trigger technical sell signals.
After last shown in this FSU section on 4/27/15 with annotated graphs under the headline, "Distributional Action Today and Annual Earnings History a Concern", it produced a gain above the pivot point with at least +40% above average volume and triggered a technical buy signal, however, it stalled and encountered distributional pressure right away.
The number of top-rated funds owning is shares rose from 162 in Jun '14 to 189 in Mar '15, a reassuring sign concerning the I criteria. Its current Up/Down Volume Ratio of 1.3 is an unbiased indication that its shares have been under accumulation over the past 50 days.

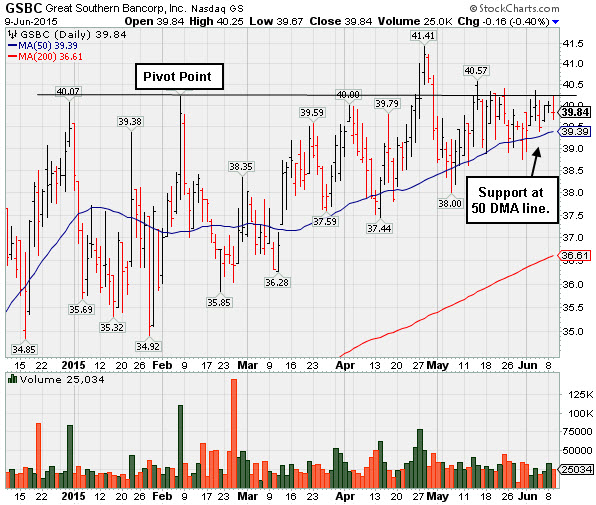
Distributional Action Today and Annual Earnings History a Concerrn - Monday, April 27, 2015
Great Southern Bancorp (GSBC $40.17) churned heavy volume and finished the session unchanged after highlighted in yellow with a pivot point based on its 2/06/15 high plus 10 cents in the earlier mid-day report (read here). The churning action is a sign that it encountered distributional selling pressure today after reaching a new 52-week high. While perched in position to break out, the action was not indicative of heavy buying demand. Therefore, subsequent gains and a more convincing finish above the pivot point with at least +40% above average volume are still needed to trigger a proper technical buy signal.
The number of top-rated funds owning is shares rose from 162 in Jun '14 to 185 in Mar '15, a reassuring sign concerning the I criteria. It found support recently near its 50-day moving average (DMA) line, also an encouraging sign institutional support. However, its current Up/Down Volume Ratio of 0.8 (see red circle on weekly chart) is an unbiased indication that its shares have been under some distributional pressure over the past 50 days.
Earnings increases were above the +25% minimum guideline (C criteria) in the 4 latest quarterly comparisons through Mar '15. Annual earnings (A criteria) have not been strong and steady. Note that the annual earnings results include blue triangles beside the reported earnings figures - the blue triangles are symbols indicating that pre-tax, non-recurring items were included (where possible, such items are normally removed to provide data better suited for comparison).