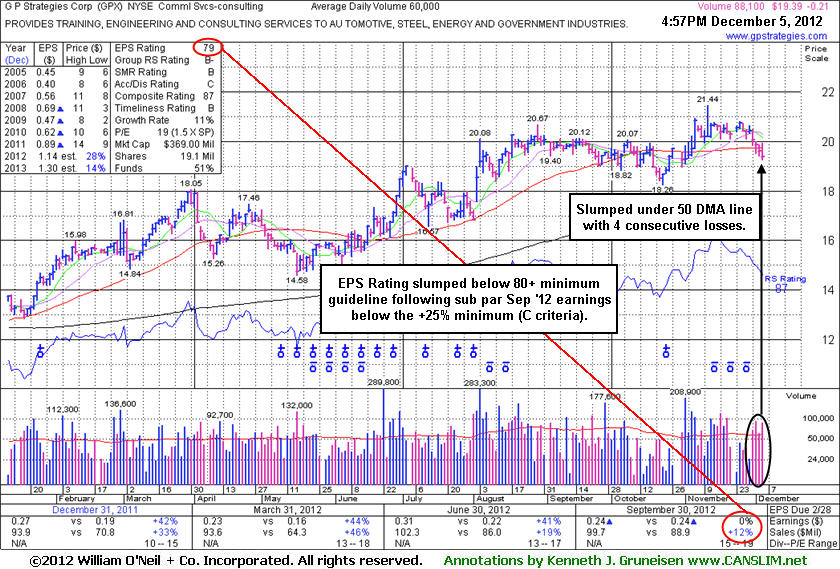
Its last appearance in this FSU section was on 11/15/12 with an annotated graph under the headline, "Strong Despite Earnings Below +25% Guideline Raising Concerns." A downturn in FY '09 earnings was previously noted as a flaw concerning the A criteria, and its mediocre Group Relative Strength Rating was another concern noted with respect to the L criteria. Investors' odd are usually most favorable when choosing a stock with robust leadership in the same industry group. The number of top-rated funds owning its shares rose from 158 in Mar '12 to 173 in Sep '12, a slightly reassuring trend concerning the I criteria. Its current Up/Down Volume Ratio of 1.3 still hints that its shares have been under accumulation during the past 50 days. Company management reportedly owns 25% of its shares, which keeps the directors keenly focused on building and maintaining shareholder value. Its small supply (S criteria) of 14.3 million shares in the public float is a favorable characteristic that was found in most of the market's greatest winners, however that can contribute to greater price volatility in the event of institutional buying or selling. Disciplined investors always limit losses if any stock falls more than -7% from their purchase price.
It made limited headway after the stock was long ago highlighted in yellow in the 6/29/12 mid-day report (read here) and noted - "It cleared a valid base earlier this week with volume-driven gains and no overhead supply remains. Quarterly earnings increases above the +25% guideline in the 8 latest quarterly comparisons through Dec '11 satisfy the C criteria. Recent cluster of Insider buying in May-Jun looks similar to that which was reported in Nov, Dec, and Jan as it rose toward and above prior resistance in the $14 area."
A downturn in FY '09 earnings was previously noted as a flaw concerning the A criteria, and its mediocre Group Relative Strength Rating was another concern noted with respect to the L criteria. Investors' odd are usually most favorable when choosing a stock with robust leadership in the same industry group. The number of top-rated funds owning its shares rose from 158 in Mar '12 to 171 in Sep '12, a slightly reassuring trend concerning the I criteria. Its current Up/Down Volume Ratio of 1.6 hints that its shares have been under accumulation during the past 50 days. Company management reportedly owns 25% of its shares, which keeps the directors keenly focused on building and maintaining shareholder value. Its small supply (S criteria) of 14.2 million shares in the public float is a favorable characteristic that was found in most of the market's greatest winners, however that can contribute to greater price volatility in the event of institutional buying or selling. Disciplined investors always limit losses if any stock falls more than -7% from their purchase price.
It made limited headway after the stock was long ago highlighted in yellow in the 6/29/12 mid-day report (read here) and noted - "It cleared a valid base earlier this week with volume-driven gains and no overhead supply remains. Quarterly earnings increases above the +25% guideline in the 8 latest quarterly comparisons through Dec '11 satisfy the C criteria. Recent cluster of Insider buying in May-Jun looks similar to that which was reported in Nov, Dec, and Jan as it rose toward and above prior resistance in the $14 area."
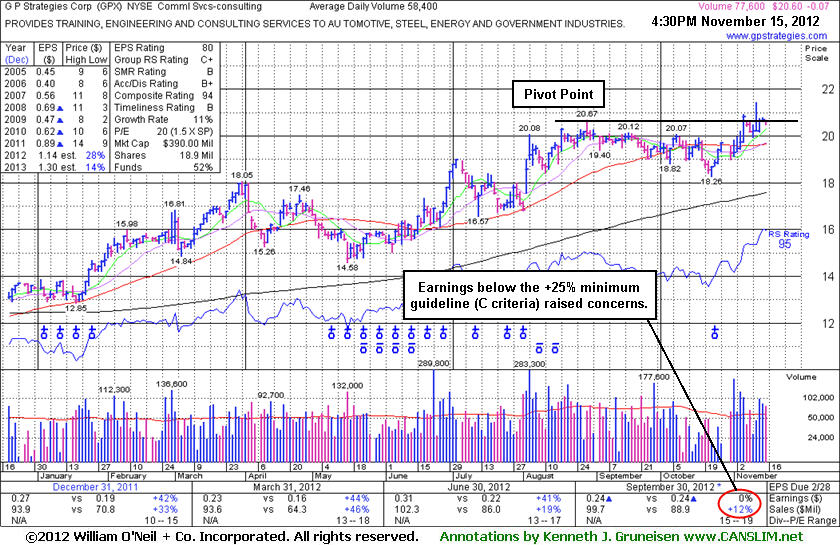
G P Strategies Corp (GPX +$0.05 or +0.26% to $19.56) recently has been consolidating near its 50-day moving average (DMA) line. Volume driven gains above the latest pivot point have not triggered a new (or add-on) technical buy signal. Meanwhile, subsequent losses exceeding the recent low ($18.82 on 10/04/12) would raise more serious concerns and trigger technical sell signals.
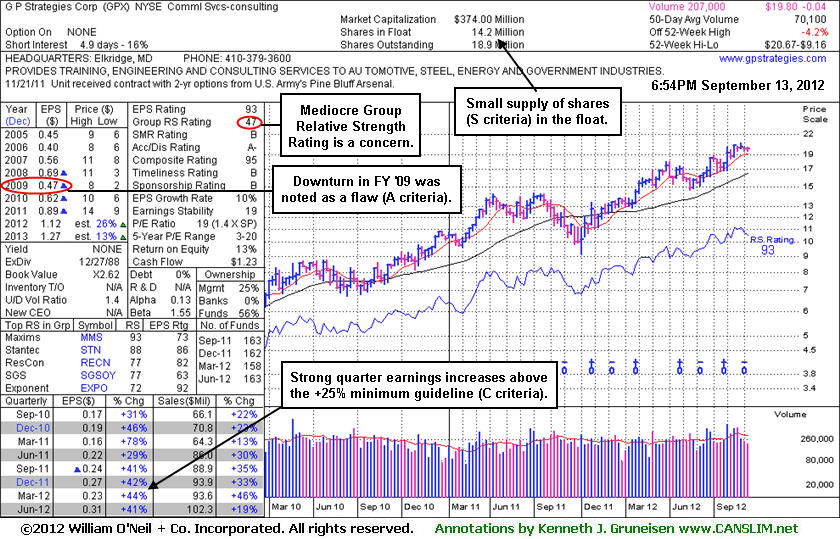
Its last appearance in this FSU section was on 9/13/12 with an annotated graph under the headline, "Consolidating in Tight Range Near 52-Week High". It went on to form a base of sufficient length before the new pivot point was noted. It reported earnings +41% on +19% sales revenues for the Jun '12 quarter. When the stock was highlighted in yellow in the 6/29/12 mid-day report (read here) it was noted - "It cleared a valid base earlier this week with volume-driven gains and no overhead supply remains. Quarterly earnings increases above the +25% guideline in the 8 latest quarterly comparisons through Dec '11 satisfy the C criteria. Recent cluster of Insider buying in May-Jun looks similar to that which was reported in Nov, Dec, and Jan as it rose toward and above prior resistance in the $14 area."
A downturn in FY '09 earnings was previously noted as a flaw concerning the A criteria, and its mediocre Group Relative Strength Rating was another concern noted with respect to the L criteria. Investors' odd are usually most favorable when choosing a stock with robust leadership in the same industry group. The number of top-rated funds owning its shares rose from 158 in Mar '12 to 165 in Sep '12, a slightly reassuring trend concerning the I criteria. Its current Up/Down Volume Ratio of 1.3 hints that its shares have been under accumulation during the past 50 days. Company management reportedly owns 25% of its shares, which keeps the directors keenly focused on building and maintaining shareholder value. Its small supply (S criteria) of 14.2 million shares in the public float is a favorable characteristic that was found in most of the market's greatest winners, however that can contribute to greater price volatility in the event of institutional buying or selling. Disciplined investors always limit losses if any stock falls more than -7% from their purchase price.
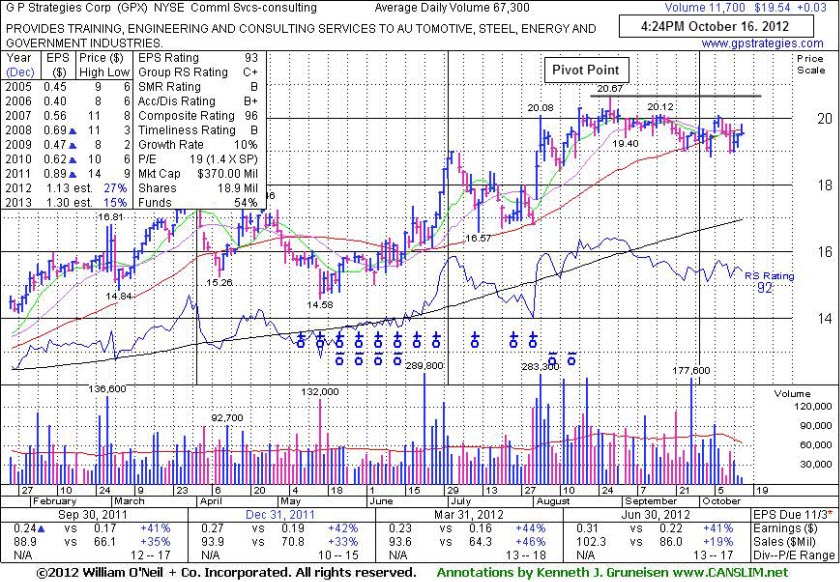
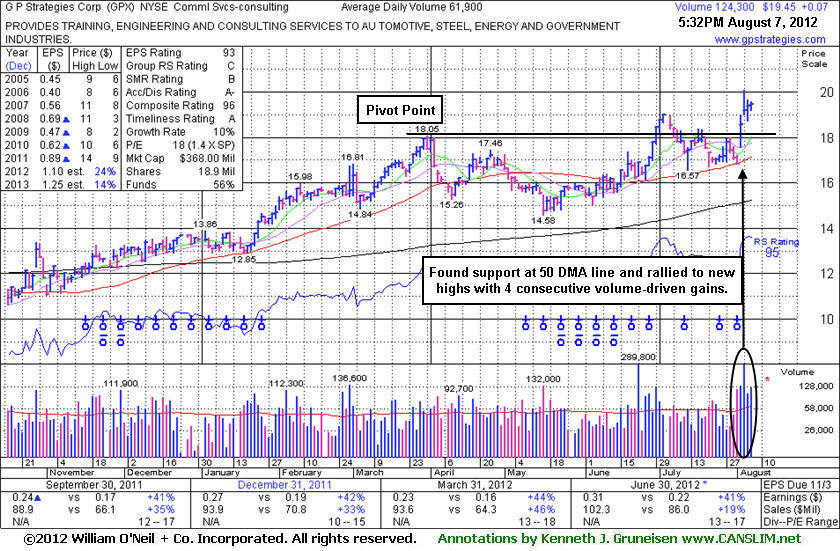
Its last appearance in this FSU section was on 8/07/12 with an annotated graph under the headline, "Four Consecutive Volume-Driven Gains For New Highs", as it rallied to new highs with 4 consecutive volume-driven gains. It reported earnings +41% on +19% sales revenues for the Jun '12 quarter. When the stock was highlighted in yellow in the 6/29/12 mid-day report (read here) it was noted - "It cleared a valid base earlier this week with volume-driven gains and no overhead supply remains. Quarterly earnings increases above the +25% guideline in the 8 latest quarterly comparisons through Dec '11 satisfy the C criteria. Recent cluster of Insider buying in May-Jun looks similar to that which was reported in Nov, Dec, and Jan as it rose toward and above prior resistance in the $14 area."
A downturn in FY '09 earnings was previously noted as a flaw concerning the A criteria, and its mediocre Group Relative Strength Rating is a concern with respect to the L criteria. Investors' odd are usually most favorable when choosing a stock with robust leadership in the same industry group. The number of top-rated funds owning its shares rose from 158 in Mar '12 to 163 in Jun '12, a slightly reassuring trend concerning the I criteria. Its current Up/Down Volume Ratio of 1.4 hints that its shares have been under accumulation during the past 50 days. Company management reportedly owns 25% of its shares, which keeps the directors keenly focused on building and maintaining shareholder value. Its small supply (S criteria) of 14.2 million shares in the public float is a favorable characteristic that was found in most of the market's greatest winners, however that can contribute to greater price volatility in the event of institutional buying or selling. Disciplined investors always limit losses if any stock falls more than -7% from their purchase price.
G P Strategies Corp (GPX +$0.07 or +0.36% to $19.45) found support at its 50-day moving average (DMA) line and rallied to new highs with 4 consecutive volume-driven gains. It reported earnings +41% on +19% sales revenues for the Jun '12 quarter. Its last appearance in this FSU section was on 7/06/12 with an annotated graph under the headline, "Prior Highs Define Initial Support Level Following Breakout". A stock's prior highs usually define an initial support level to watch following a technical breakout, and disciplined investors always limit losses if ever any stock falls more than -7% from its purchase price.
In this case, weak action may have prompted some investors to sell based upon its retreat to its 50 DMA line. A stock that is sold can always be bought back if strength returns, but there is no excuse for leaving a small loss open to potentially become a larger and more damaging loss. In the Certification they teach that a secondary buy point exists following the first successful test of the 10-week moving average line after an initial breakout, and the stock can be purchased anywhere from that point up to +5% above the latest high. In this example, that approach may allow for buying efforts up to +5% above its 7/03/12 high ($18.99 X 1.05 = $19.94). However, the risk clearly increases the further one chases a stock above its pivot point or prior highs that an ordinary pullback may lead to losses which could trigger the investment system's selling rules.
When the stock was highlighted in yellow in the 6/29/12 mid-day report (read here) it was noted - "It cleared a valid base earlier this week with volume-driven gains and no overhead supply remains. Quarterly earnings increases above the +25% guideline in the 8 latest quarterly comparisons through Dec '11 satisfy the C criteria. Recent cluster of Insider buying in May-Jun looks similar to that which was reported in Nov, Dec, and Jan as it rose toward and above prior resistance in the $14 area. Prior reports cautioned - 'Recent quarterly comparisons show improving sales revenues and earnings increases but its annual earnings (A criteria) history falls below the investment system's guidelines.'"
The current Up/Down Volume Ratio of 1.9 hints that its shares have been under accumulation during the past 50 days. Company management reportedly owns 25% of its shares, which keeps the directors keenly focused on building and maintaining shareholder value.
Often, when a leading stock is setting up to breakout of a solid base it is highlighted in CANSLIM.net's Mid-Day Breakouts Report. The most relevant factors are noted in the report which alerts prudent CANSLIM oriented investors to place the issue in their watch list. After doing any necessary backup research, the investor is prepared to act after the stock triggers a technical buy signal (breaks above its pivot point on more than +50% average turnover) but before it gets too extended from a sound base. In the event the stock fails to trigger a technical buy signal and its price declines then it will simply be removed from the watch list. Disciplined investors know to buy as near as possible to the pivot point and avoid chasing stocks after they have rallied more than +5% above their pivot point. It is crucial to always limit losses whenever any stock heads the wrong direction, and disciplined investors sell if a struggling stock ever falls more than -7% from their purchase price.
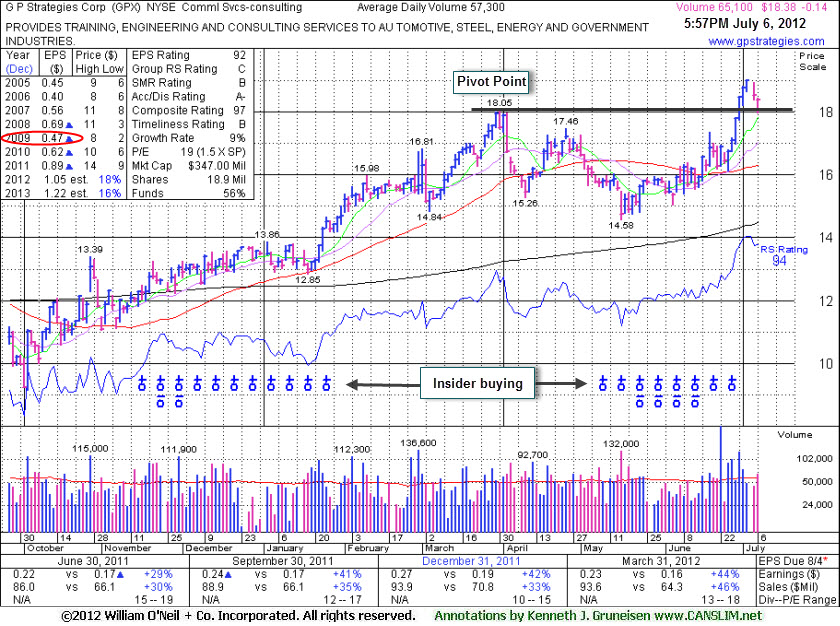
G P Strategies Corp (GPX -$0.14 or -0.76% to $18.38) finished in the upper third of its intra-day range today with a small loss, action which suggests that it was finding support. Prior highs define an initial support level to watch following a technical breakout. Disciplined investors always limit losses if ever any stock falls more than -7% from its purchase price.
There was a 6 session winning streak that lifted it into new high territory. Its 7/02/12 gain above the pivot point with above average volume was noted as it triggered a technical buy signal. The stock was highlighted in yellow in the 6/29/12 mid-day report (read here) and noted - "It cleared a valid base earlier this week with volume-driven gains and no overhead supply remains. Quarterly earnings increases above the +25% guideline in the 8 latest quarterly comparisons through Dec '11 satisfy the C criteria. Recent cluster of Insider buying in May-Jun looks similar to that which was reported in Nov, Dec, and Jan as it rose toward and above prior resistance in the $14 area. Prior reports cautioned - 'Recent quarterly comparisons show improving sales revenues and earnings increases but its annual earnings (A criteria) history falls below the investment system's guidelines.'"
The current Up/Down Volume Ratio of 1.2 hints that its shares have been under accumulation during the past 50 days. Company management reportedly owns 23% of its shares, which keeps the directors keenly focused on building and maintaining shareholder value.