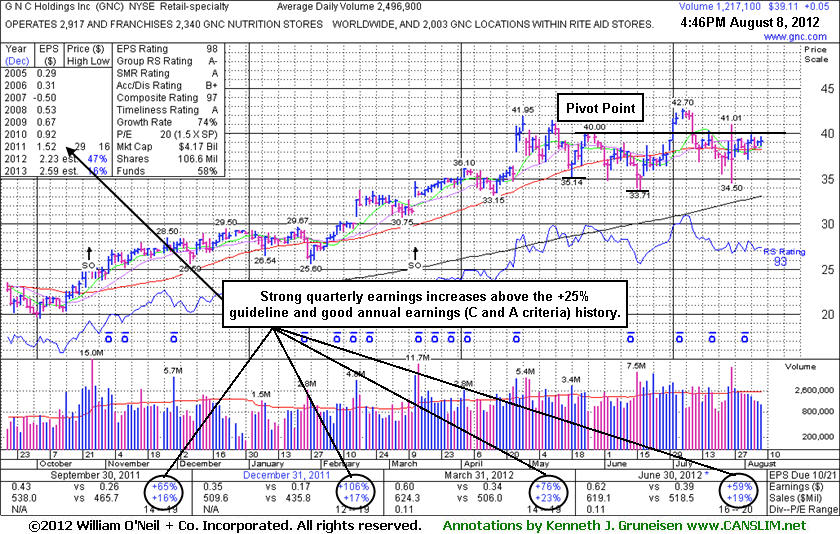
GNC Holdings Inc (GNC +$0.05 or +0.13% to $39.11) has been quietly consolidating just above its 50-day moving average (DMA) line. Recently the high-ranked Retail - Specialty firm reported earnings +59% on +19% sales revenues for the quarter ended June 30, 2012 versus the year ago period, beating expectations, and it also raised guidance for FY '12.
It was last shown in the FSU section with an annotated graph on 7/05/12 under the headline, "Streak of Gains While Rallying From New Double Bottom Base " as it hit new all-time highs with a 7th consecutive gain and rallied from a 10-week "double bottom" type base. Subsequent damaging losses triggered technical sell signals as it slumped below its 50 -day moving average line, yet it stayed above prior lows. Its recent rebound above its 50-day moving average (DMA) line helped its technical stance improve, however its current consolidation does not have the look of a sound base pattern. Patient investors may watch for a new pivot point to be cited in the weeks ahead if healthy action continues. Meanwhile, below its recent lows in the $33-34 area its 200 DMA line comes into play as the next important chart support level to watch.
GNC completed Secondary Offerings on 10/25/11 and 3/13/12 after making steady progress following its 4/01/11 IPO. As prior analysis noted, new institutional owners are often attracted when a company has the help of underwriters in placing shares during offerings. The number of top-rated funds owning its shares rose from 147 in Jun '11 to 419 in Jun '12, a reassuring sign concerning the I criteria. Its strong quarterly earnings increases with accelerating sales growth and a great annual earnings history satisfies the C and A criteria and helped it earn stellar ranks.
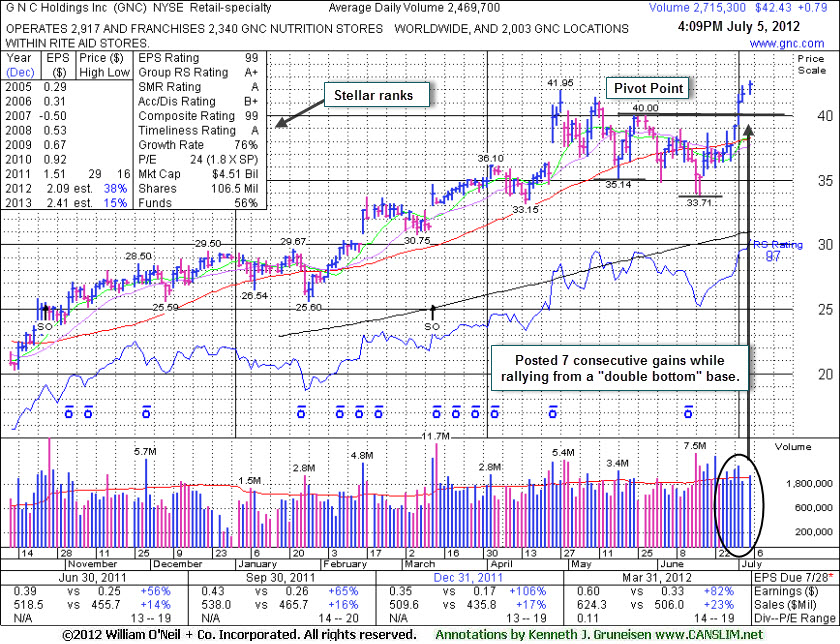
GNC Holdings Inc (GNC +$0.79 or +1.90% to $42.43) hit new 52-week and all-time highs today with its 7th consecutive gain. Its color code was changed to green after getting extended from its prior base. A new pivot point was cited on 6/29/12 and its subsequent gain on 7/02/12 with above average volume confirmed a new (or add-on) technical buy signal as it rallied from a 10-week "double bottom" type base. Volume-driven gains into new high territory are recognized as very reassuring signs of institutional accumulation.
It was last shown in the FSU section with an annotated graph on 6/06/12 under the headline, "Consolidating Just Above 50-Day Moving Average Line", but subsequent damaging losses triggered technical sell signals as it slumped further below its 50 -day moving average line and prior lows. Its recent rebound above its 50-day moving average (DMA) line helped its technical stance improve.
It reported earnings +82% on +23% sales revenues for the quarter ended March 31, 2012 versus the year ago period. GNC completed Secondary Offerings on 10/25/11 and 3/13/12 after making steady progress following its 4/01/11 IPO.New institutional owners are often attracted when a company has the help of underwriters in placing shares during offerings. The number of top-rated funds owning its shares rose from 147 in Jun '11 to 385 in Mar '12, a reassuring sign concerning the I criteria. Its strong quarterly earnings increases with accelerating sales growth and a great annual earnings history satisfies the C and A criteria and helped it earn stellar ranks.
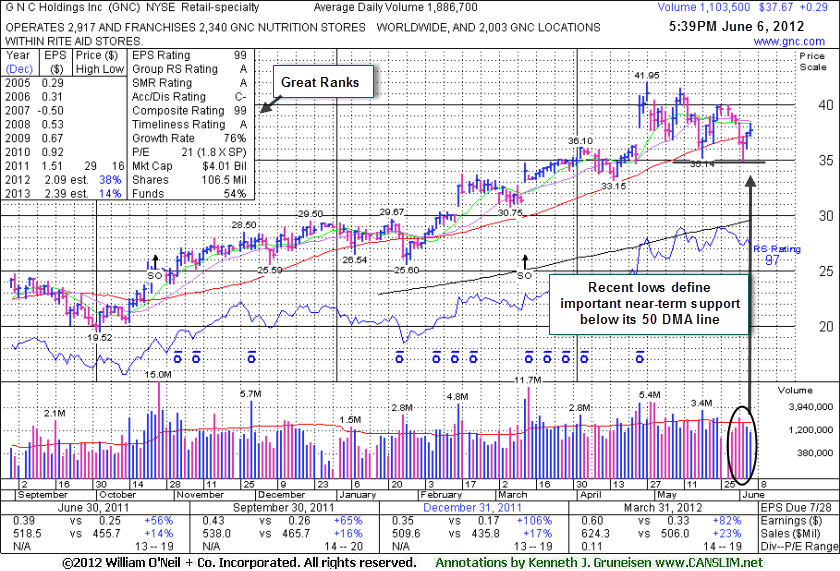
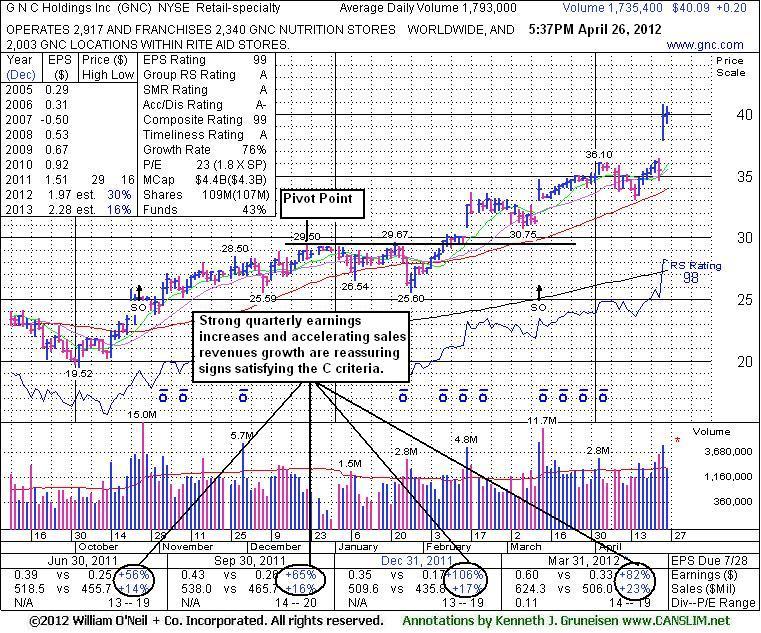
GNC Holdings Inc (GNC +$0.29 or +0.78% to $37.67) posted a small gain on lighter volume today. The prior session's gain on below average volume helped it rebound to a close above its 50-day moving average (DMA) line, helping its technical stance improve slightly following a streak of 6 consecutive losses. It could be forming a "double bottom" base, but it is in the 7th week of its consolidation from its high. That basic base pattern should be a minimum of 8-weeks in duration to be considered valid. Meanwhile, more damaging losses below recent lows could raise serious concerns.
It was last shown in the FSU section with an annotated graph on 4/26/12 under the headline, "Gap Up Followed Another Strong Earnings Report", following a considerable gap up and volume-driven gain for a new all-time high. It reported earnings +82% on +23% sales revenues for the quarter ended March 31, 2012 versus the year ago period. Volume-driven gains into new high territory, especially gaps up, were recognized as very reassuring signs of institutional accumulation.
GNC completed Secondary Offerings on 10/25/11 and 3/13/12 after making steady progress following its 4/01/11 IPO.New institutional owners are often attracted when a company has the help of underwriters in placing shares during offerings. The number of top-rated funds owning its shares rose from 147 in Jun '11 to 354 in Mar '12, a reassuring sign concerning the I criteria. Its strong quarterly earnings increases with accelerating sales growth and a great annual earnings history satisfies the C and A criteria and helped it earn stellar ranks.
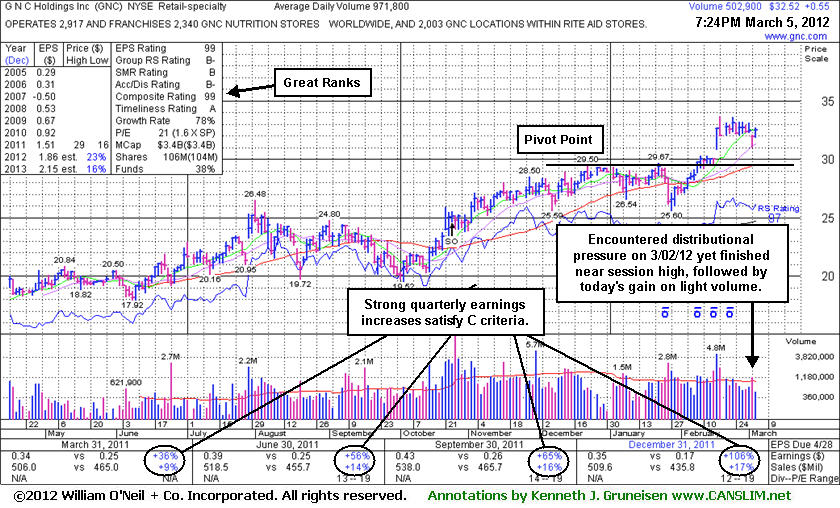
GNC completed Secondary Offerings on 10/25/11 and 3/13/12 after making steady progress following its 4/01/11 IPO. Its last appearance in this FSU section was on 3/05/12 with an annotated graph under the headline, "Encouraging Action Following Powerful Gap Up". As mentioned in prior analysis, new institutional owners are often attracted when a company has the help of underwriters in placing shares during offerings. The number of top-rated funds owning its shares rose from 148 in June to 291 in Mar '12, a reassuring sign concerning the I criteria. Its strong quarterly earnings increases with accelerating sales growth and a great annual earnings history satisfies the C and A criteria and helped it earn stellar ranks.
It completed a Secondary Offering on 10/25/11. New institutional owners are often attracted when a company has the help of underwriters in placing shares during offerings. The number of top-rated funds owning its shares rose from 148 in June to 267 in December '11, a reassuring sign concerning the I criteria. Its strong quarterly earnings increases with accelerating sales growth and a great annual earnings history satisfies the C and A criteria and helped it earn stellar ranks.
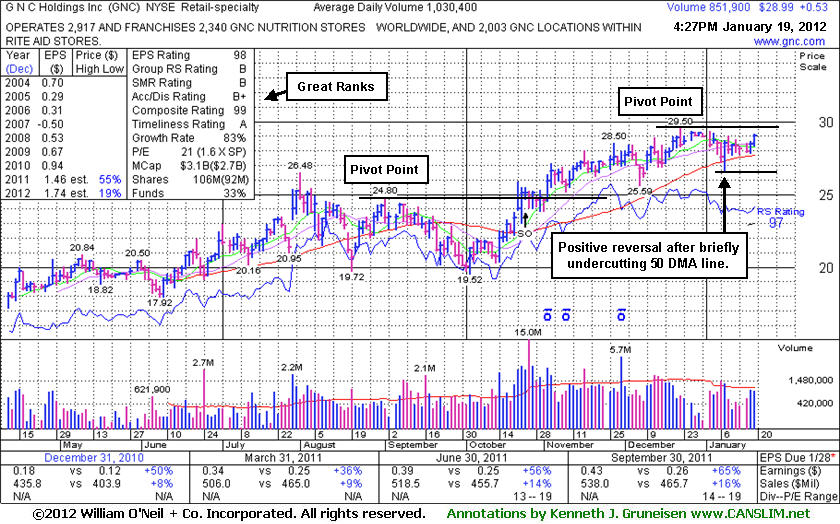
GNC Holdings Inc's (GNC +$0.53 or +1.86% to $28.99) volume totals have been cooling in recent weeks while holding its ground perched within close striking distance of a new high (N criteria). It briefly undercut its 50-day moving average (DMA) line on 1/09/12 yet found prompt support and managed a "positive reversal" on that session. Subsequent losses below its 50 DMA and recent chart low (1/09/12 low of $26.54) would raise more serious concerns and trigger more worrisome technical sell signals.
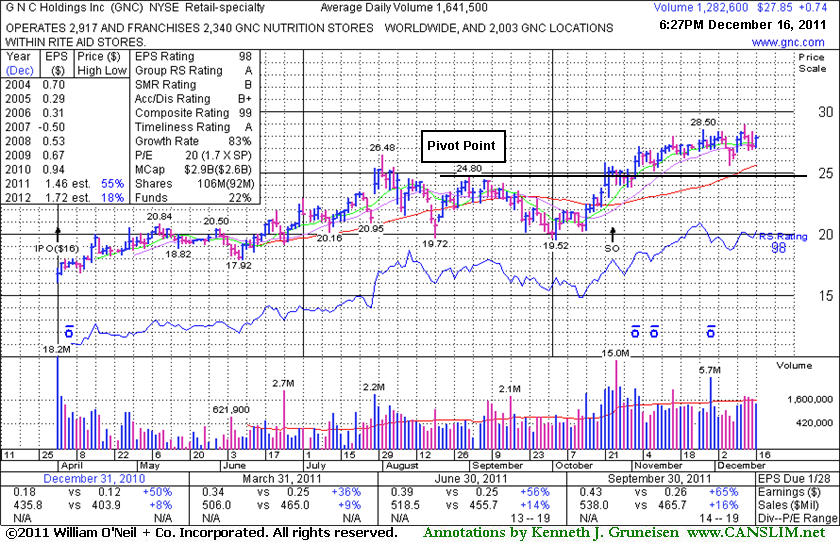
GNC's last appearance in this FSU section was on 12/16/11 with an annotated graph under the headline, "Hovering Near Highs Extended From Prior Base." Since then it wedged to new highs without great volume conviction behind its gains. No resistance remains due to overhead supply, so it could produce more climactic gains. Disciplined investors would watch for a fresh sign of institutional buying demand before considering new (or add-on) buying efforts. Its color code was changed to yellow with a new pivot point cited based on its 12/22/11 high plus 10 cents while currently building on an orderly flat base pattern. Volume-driven gains into new high territory would be a reassuring sign of institutional accumulation.
It completed a Secondary Offering on 10/25/11. New institutional owners are often attracted when a company has the help of underwriters in placing shares during offerings. The number of top-rated funds owning its shares rose from 148 in June to 226 in December '11, a reassuring sign concerning the I criteria. Although the Retail - Specialty industry group has seen its Relative Strength Rating slump to a mediocre 63 (down from 84 when last shown in this FSU section) there are still several strong stocks in the group providing leadership which is good news concerning the L criteria. Its strong quarterly earnings increases with accelerating sales growth and a great annual earnings history satisfies the C and A criteria and helped it earn stellar ranks. Keep in mind that an earnings announcement for the latest quarter is expected soon, and volume and volatility often increase near earnings news.
G N C Holdings Inc (GNC +$0.74 or +2.73% to $27.85) is still hovering near its all-time high today, extended from its prior base pattern. Disciplined investors do not chase extended stocks. No resistance remains due to overhead supply so it could produce more climactic gains. Prior chart highs and its 50-day moving average (DMA) line coincide in the $25 area defining important support to watch on pullbacks. Its last appearance in this FSU section was on 11/21/11 with an annotated graph under the headline, "Negative Reversal Marked Recent High Yet No Resistance Remains."
It completed a Secondary Offering on 10/15/11 and it had followed that with some volume-driven gains. It was perched near its 52-week high within striking distance of new highs (N criteria), holding its ground after volume-driven gains helped it rally from a "double bottom" base pattern formed over the prior 3 months. Its pivot point was based on its 9/01/11 high. The 10/24/11 gain with more than 4 times average volume had triggered a technical buy signal.
New institutional owners are often attracted when a company has the help of underwriters in placing shares during offerings. The number of top-rated funds owning its shares rose from 148 in June to 193 in September '11, a reassuring sign concerning the I criteria. The Retail - Specialty industry group has a Relative Strength Rating of 84, which is good news concerning the L criteria. Its strong quarterly earnings increases with accelerating sales growth and a great annual earnings history satisfies the C and A criteria and helped it earn stellar ranks.
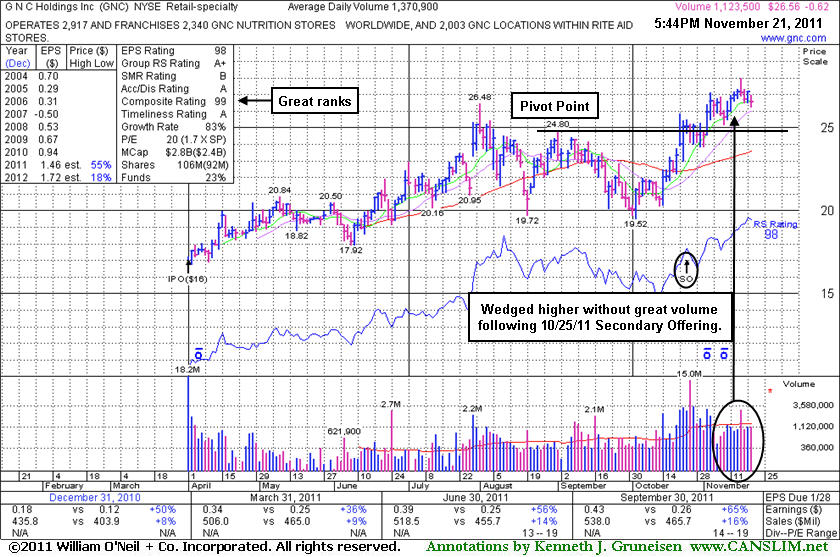
G N C Holdings Inc (GNC -$0.62 or -2.28% to $26.56) lost ground today on near average volume. No resistance remains due to overhead supply so it could produce more climactic gains. There was a negative reversal for a loss on more than 2 times average volume on 11/16/11 after touching a new all-time high. It completed a Secondary Offering on 10/15/11 and it had followed that with some volume driven gains, but more recently it had wedged to new highs without great volume conviction behind its gains.
Recent chart lows (near $23.80) define near term support to watch along with its 50-day moving average (DMA) line. Its last appearance in this FSU section was on 10/26/11 with an annotated graph under the headline, "Secondary Offering Priced While High-Ranked Leader Near High." It was perched near its 52-week high within striking distance of new highs (N criteria), holding its ground after volume-driven gains helped it rally from a "double bottom" base pattern formed over the prior 3 months. Its pivot point was based on its 9/01/11 high. The 10/24/11 gain with more than 4 times average volume had triggered a technical buy signal.
New institutional owners are often attracted when a company has the help of underwriters in placing shares during offerings. The number of top-rated funds owning its shares rose from 147 in June to 181 in September '11, a reassuring sign concerning the I criteria. The Retail - Specialty industry group has a Relative Strength Rating of 95, which is good news concerning the L criteria. Its strong quarterly earnings increases with accelerating sales growth and a great annual earnings history satisfies the C and A criteria and helped it earn stellar ranks.
Often, when a leading stock is setting up to breakout of a solid base it is highlighted in CANSLIM.net's Mid-Day Breakouts Report. The most relevant factors are noted in the report which allows prudent CANSLIM oriented investors to place the issue in their watch list. After doing any necessary backup research, the investor is prepared to act if and when the stock triggers a technical buy signal (breaks above its pivot point on more than +50% average turnover). In the event the stock fails to trigger a technical buy signal and its price declines then it will simply be removed from the watch list. In other cases, stocks may be featured in CANSLIM.net's Mid-Day Breakouts Report.after recent action already triggered technical buy signal. Disciplined investors know to buy as near as possible to the pivot point and avoid chasing stocks after they have rallied more than +5% above their pivot point. It is crucial to always limit losses whenever any stock heads the wrong direction, and disciplined investors sell if a struggling stock ever falls more than -7% from their purchase price.
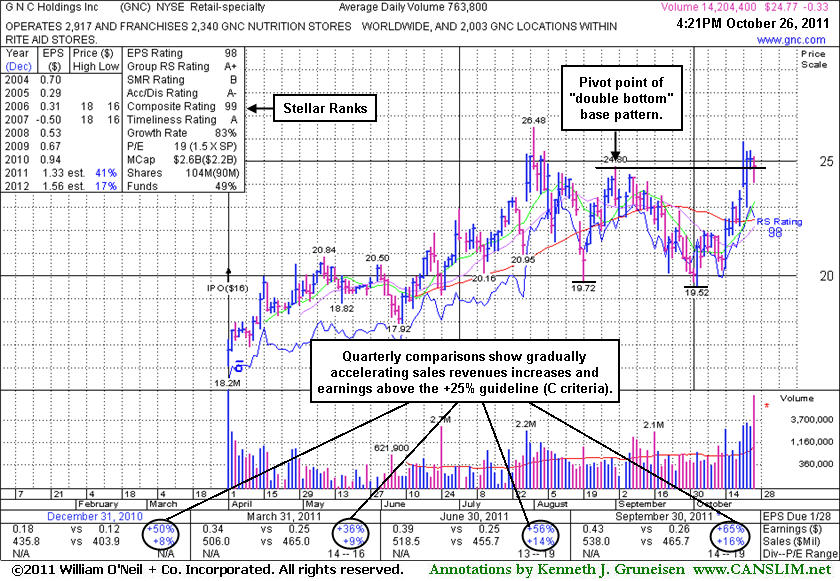
G N C Holdings Inc (GNC -$0.35 or -1.39% to $24.75) is perched near its 52-week high within striking distance of new highs (N criteria), holding its ground after volume-driven gains helped it rally from a "double bottom" base pattern formed over the prior 3 months. Its color code was changed to yellow with pivot point based on its 9/01/11 high. The 10/24/11 gain with more than 4 times average volume triggered a technical buy signal. Almost no resistance remains due to overhead supply. Its strong quarterly earnings increases with accelerating sales growth and a great annual earnings history satisfies the C and A criteria and has earned it stellar ranks. Following the close on 10/25/11 it priced a Secondary Offering. The nutrition store will receive no funds from the share sale by existing holders. However, new institutional owners are often attracted when a company has the help of underwriters in placing shares during such an offering. The number of top-rated funds owning its shares rose from 147 in June to 169 in September '11, a reassuring sign concerning the I criteria. The Retail - Specialty industry group has a Relative Strength Rating of 97, which is good news concerning the L criteria.