Quietly Sputtering Below Important Moving Averages - Tuesday, November 27, 2018
Globus Medical Inc Cl A (GMED -$0.08 or -0.16% to $50.73) has seen volume totals cooling while it has failed to rebound and it has met resistance at its 200-day moving average (DMA) line. It remains only -12.3% off its all-time high, but more damaging losses below the recent low ($49.03 on 11/20/18) would raise serious concerns. The longer it lingers below its 200 DMA line ($51.91) and its 50 DMA line ($52.87) the worse its outlook gets.
A rebound above those moving average lines and subsequent gains above the pivot point backed by more than +40% above average volume are needed to trigger a technical buy signal. Additionally, any new buying efforts are discouraged until a follow-through day confirms a new market rally (M criteria).
GMED was last shown in this FSU section on 11/05/18 with an annotated graph under the headline, "Consolidating -5.2% Off 52-Week High Ahead of Earnings News". Afterward it reported earnings +30% on +12% sales revenues for the Sep '18 quarter. its 3rd strong quarterly comparison above the +25% minimum guideline (C criteria). Annual earnings (A criteria) growth has been steady.
The Medical - Products firm has technology to treat patients with spine disorders. It was first highlighted in yellow with pivot point cited based on its 6/06/18 high plus 10 cents in the 9/26/18 mid-day report (read here).
It has 98.5 million shares outstanding (S criteria). The number of top rated funds owning its shares rose from 451 in Sep '17 to 526 in Sep '18, a reassuring sign concerning the I criteria. Its current Up/Down Volume Ratio of 0.9 is an unbiased indication its shares have been under slight distributional pressure over the past 50 days.
Charts courtesy of www.stockcharts.com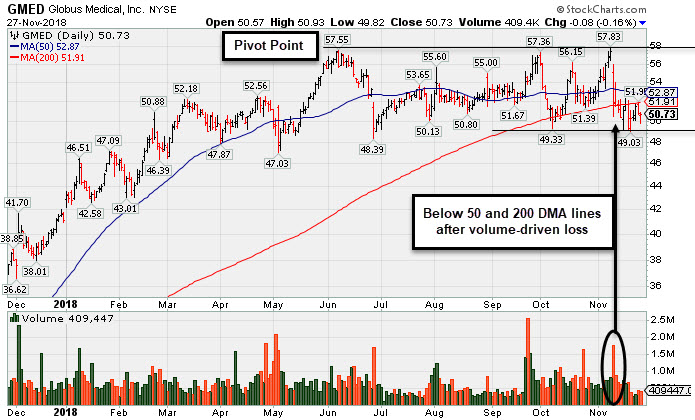
Consolidating -5.2% Off 52-Week High Ahead of Earnings News - Monday, November 5, 2018
Globus Medical Inc Cl A (GMED -$0.09 or -0.16% to $54.58) is consolidating above its 50-day moving average (DMA) line ($53.10). Recent volume-driven losses have been noted as signs of distributional pressure hurting its outlook, however it has found support near its 200 DMA line. Subsequent gains above the pivot point backed by more than +40% above average volume are needed to trigger a technical buy signal. Additionally, any new buying efforts are discouraged until a follow-through day confirms a new market rally (M criteria).
Keep in mind that after the close on Thursday, on 11/08/18 it is due to report earnings news for the Sep '18 quarter. Volume and volatility often increase near earnings news. Earnings rose +38% on +14% sales revenues for the Jun '18 quarter, its 2nd strong quarterly comparison above the +25% minimum guideline (C criteria). Annual earnings (A criteria) growth has been steady.
The Medical - Products firm has technology to treat patients with spine disorders. GMED was last shown in this FSU section on 10/22/18 with an annotated graph under the headline, "Consolidating After Rally at 200-Day Moving Average Line". It was first highlighted in yellow with pivot point cited based on its 6/06/18 high plus 10 cents in the earlier mid-day report (read here).
It has 98.3 million shares outstanding (S criteria). The number of top rated funds owning its shares rose from 451 in Sep '17 to 515 in Sep '18, a reassuring sign concerning the I criteria. Its current Up/Down Volume Ratio of 1.1 is an unbiased indication its shares have been under slight accumulation over the past 50 days.
Charts courtesy of www.stockcharts.com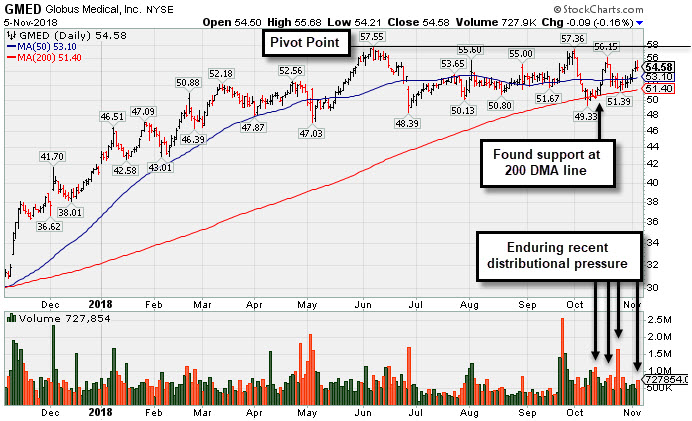
Consolidating After Rally at 200-Day Moving Average Line - Monday, October 22, 2018
Globus Medical Inc Cl A (GMED +$0.70 or +1.33% to $53.24) is consolidating near its 50-day moving average (DMA) line ($52.89). Recent volume-driven losses have been noted as signs of distributional pressure hurting its outlook, however it has found support near its 200 DMA line. . A rebound and subsequent gains above the pivot point backed by more than +40% above average volume are needed to trigger a proper technical buy signal.
GMED was last shown in this FSU section on 9/26/18 with an annotated graph under the headline, "Rallying Near Pivot Point With Volume-Driven Gains". highlighted in yellow with pivot point cited based on its 6/06/18 high plus 10 cents in the earlier mid-day report (read here). It has been rallying from support at its 50-day moving average (DMA) line and challenging its all-time high with volume-driven gains. Subsequent gains above the pivot point backed by more than +40% above average volume may trigger a technical buy signal.
The Medical - Products firm has technology to treat patients with spine disorders. Reported earnings +38% on +14% sales revenues for the Jun '18 quarter, its 2nd strong quarterly comparison above the +25% minimum guideline (C criteria). Annual earnings (A criteria) growth has been steady.
It has 98.3 million shares outstanding (S criteria). The number of top rated funds owning its shares rose from 451 in Sep '17 to 514 in Sep '18, a reassuring sign concerning the I criteria. Its current Up/Down Volume Ratio of 1.1 is an unbiased indication its shares have been under slight accumulation over the past 50 days.
Charts courtesy of www.stockcharts.com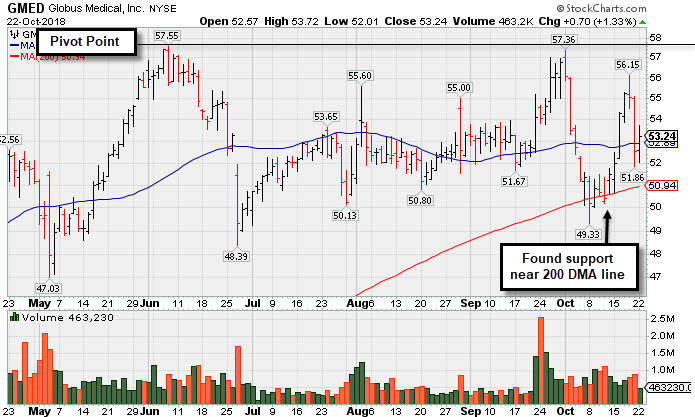
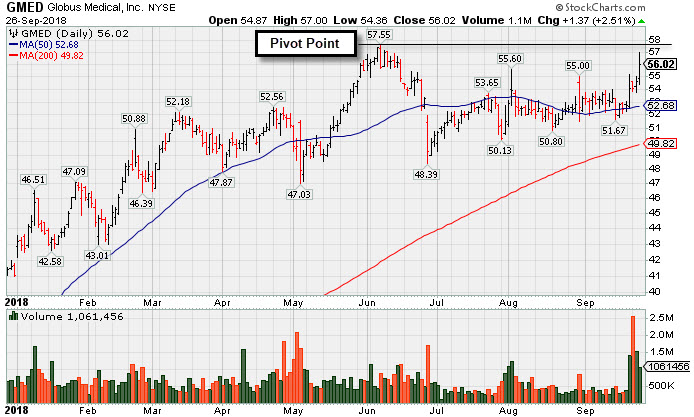
Rallying Near Pivot Point With Volume-Driven Gains - Wednesday, September 26, 2018
Globus Medical Inc Cl A (GMED +$1.37 or +2.51% to $56.02) was highlighted in yellow with pivot point cited based on its 6/06/18 high plus 10 cents in the earlier mid-day report (read here). It has been rallying from support at its 50-day moving average (DMA) line and challenging its all-time high with volume-driven gains. Subsequent gains above the pivot point backed by more than +40% above average volume may trigger a technical buy signal.
The Medical - Products firm has technology to treat patients with spine disorders. Reported earnings +38% on +14% sales revenues for the Jun '18 quarter, its 2nd strong quarterly comparison above the +25% minimum guideline (C criteria). Annual earnings (A criteria) growth has been steady.
It has 98.3 million shares outstanding (S criteria). The number of top rated funds owning its shares rose from 451 in Sep '17 to 502 in Jun '18, a reassuring sign concerning the I criteria. Its current Up/Down Volume Ratio of 1.2 is an unbiased indication its shares have been under slight accumulation over the past 50 days.
Charts courtesy of www.stockcharts.com