When the number of stocks included on the Featured Stocks page is low, and those currently listed have all received recent analysis in this FSU section, we occasionally go back to revisit a previously featured stock that was dropped. Today we will have another look at a stock that was dropped from the Featured Stocks list on August 5, 2011.
Fossil Inc (FOSL) was last noted 8/5/2011 6:23:44 PM - "Down again today with above average volume, finishing in the middle of its intra-day range after slumping near the $107 area previously noted as the next important support level to watch. Damaging losses this week with above average volume violated its 50 DMA line and triggered a technical sell signal. It will be dropped from the Featured Stocks list tonight." It also was included in the FSU section that evening with an annotated graph under the headline, "Sell Signals Prompt Profit Taking."
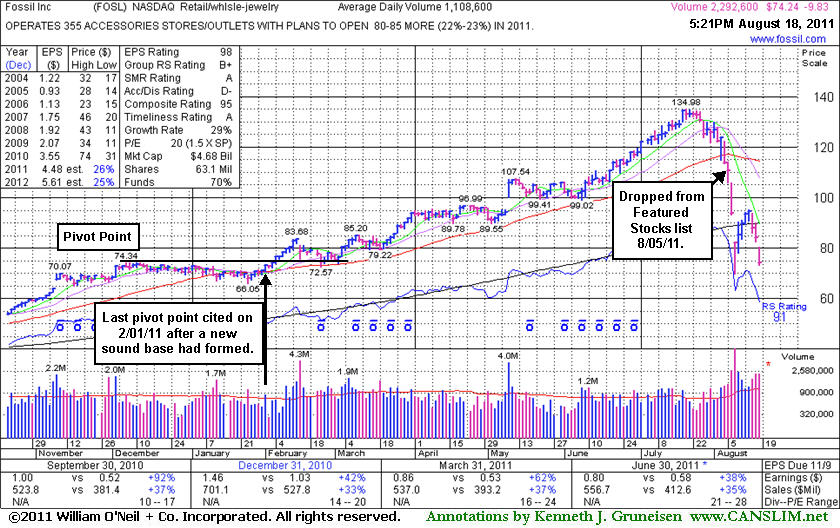
After months of trading at higher levels there is now a large amount of overhead supply that will act as resistance whenever it tries to rebound. Its apparently strong fundamentals failed to prevent a slide from $110.56 to today's close at $74.24, a -32.8% decline from when it was dropped less than 2 weeks ago! This serves as a vivid reminder to all members that recognizing technical sell signals is very important and can prevent large gains from slipping away and becoming damaging losses!
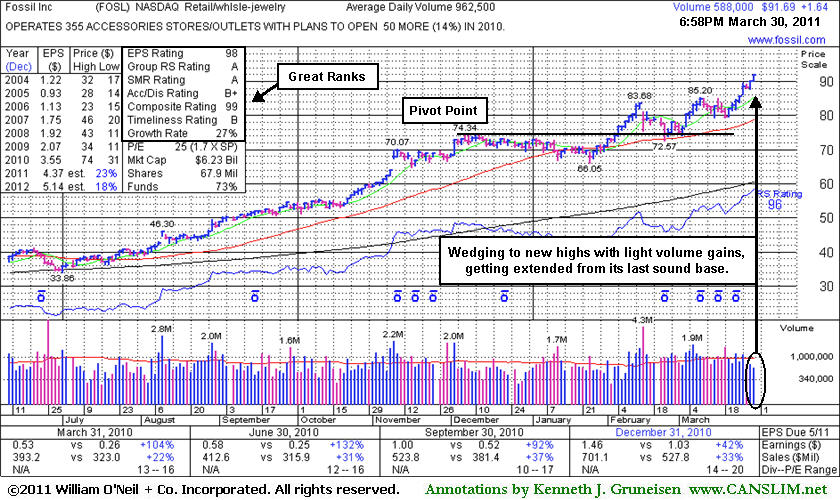
From the stock's Company Profile page members can review all prior notes and analysis, in this case going back to when this Retail/Wholesale - Jewelry firm was first featured at $45.54 highlighted in yellow in the 8/10/10 mid-day report (read here). On 2/01/11 the last pivot point was cited after a sound base. Following a subsequent breakout it later re-tested prior resistance and found support near prior highs and its 50 DMA line. Approximately 40% of successful breakouts pull back and test support like FOSL did before continuing higher for substantial gains.
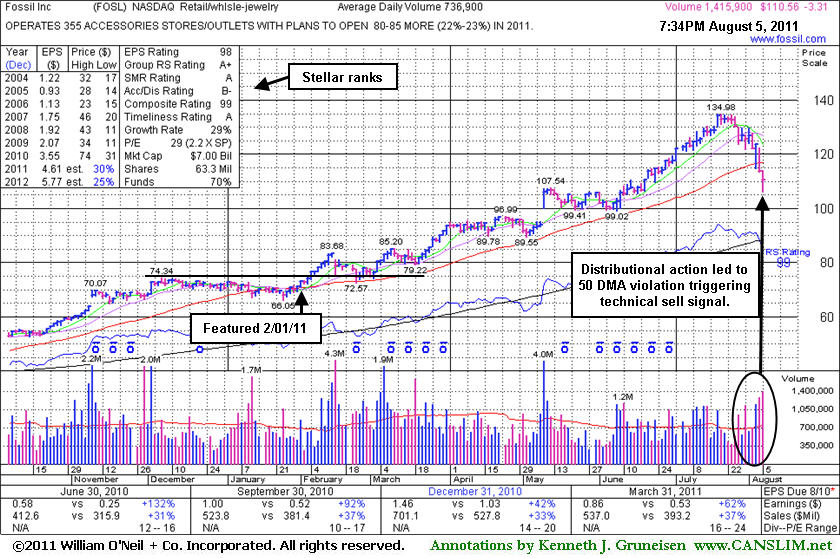
Fossil Inc (FOSL -$3.31 or -2.91% to $110.56) was down again today with above average volume, finishing in the middle of its intra-day range after slumping near the $107 area previously noted as the next important support level to watch. Damaging losses this week with above average volume violated its 50-day moving average (DMA) line and triggered a technical sell signal. It will be dropped from the Featured Stocks list tonight. Since last shown in this FSU section on 7/21/11 with an annotated graph under the headline, "Extended From Any Sound Base After Steady Climb ", it has been hit with several distribution days.
The number of top-rated funds owning its shares rose from 523 in Sep '10 to 614 in Jun '11 a reassuring sign concerning the I criteria of the investment system. It reported strong earnings +62% on +37% sales revenues for the quarter ended March 31, 2011 versus the year ago period. Its strong earnings history satisfies the C and A criteria. Much earlier, FOSL appeared in this section near $44 on 8/11/10 under the headline, "Breakaway Gap On More Than Triple Average Volume". It was featured in yellow in the 8/10/10 mid-day report (read here) and has subsequently traded as much as +200% higher.
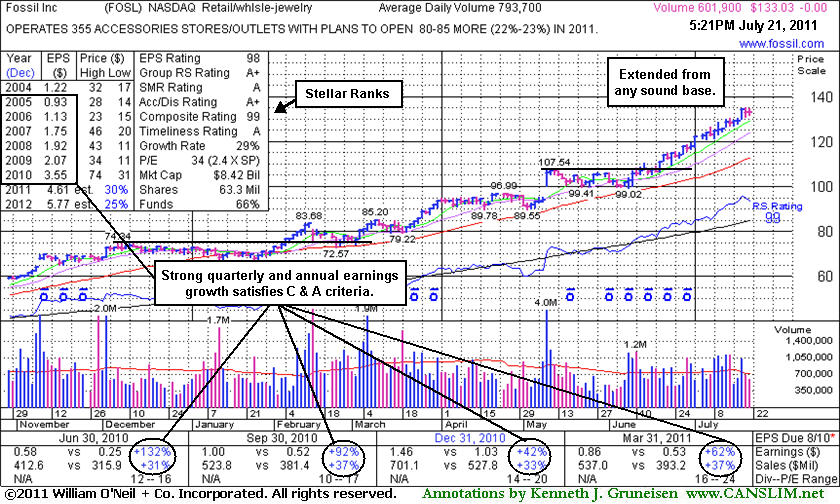
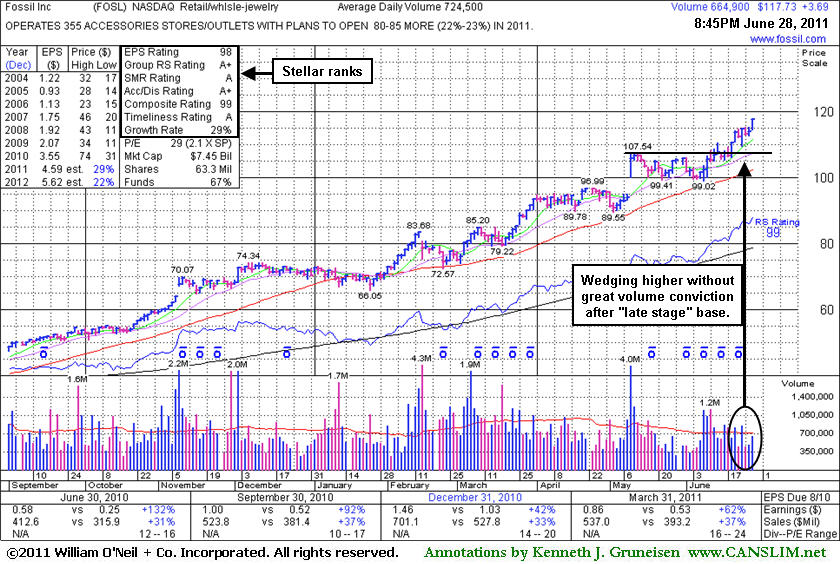
Fossil Inc (FOSL $133.03) finished unchanged today, perched at its all-time high. Its 50-day moving average (DMA) line and prior highs in the $107 area now define support to watch. Since last shown in this FSU section on 6/28/11 with an annotated graph under the headline, "Wedging Higher After Late Stage Base", it added more gains on lighter than average volume, then continued rallying with a spurt of gains in recent weeks backed by above average volume. It may go on to produce more climactic gains, however disciplined investors avoid chasing extended stocks. Success might be more likely with a fresh breakout, rather than one which has run up considerably after multiple bases.
The number of top-rated funds owning its shares rose from 523 in Sep '10 to 614 in Jun '11 a reassuring sign concerning the I criteria of the investment system. It reported strong earnings +62% on +37% sales revenues for the quarter ended March 31, 2011 versus the year ago period. Its strong earnings history satisfies the C and A criteria. Much earlier, FOSL appeared in this section near $44 on 8/11/10 under the headline, "Breakaway Gap On More Than Triple Average Volume". It was featured in yellow in the 8/10/10 mid-day report (read here) and has subsequently traded as much as +200% higher.
The number of top-rated funds owning its shares rose from 512 in Mar '10 to 616 in Mar '11 a reassuring sign concerning the I criteria of the investment system. It reported strong earnings +62% on +37% sales revenues for the quarter ended March 31, 2011 versus the year ago period. Its strong earnings history satisfies the C and A criteria. Much earlier, FOSL appeared in this section near $44 on 8/11/10 under the headline, "Breakaway Gap On More Than Triple Average Volume". It was featured in yellow in the 8/10/10 mid-day report (read here) and has subsequently traded as much as +165% higher. It may go on to produce more climactic gains, however disciplined investors avoid chasing extended stocks. Success might be more likely with a fresh breakout, rather than one which has run up considerably after multiple bases.
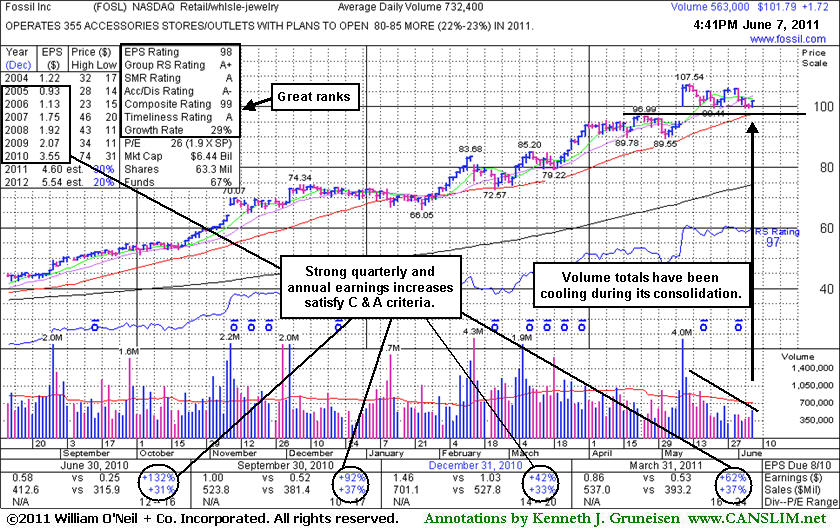
Fossil Inc (FOSL +$1.72 or +1.72% to $101.79) has been consolidating in a tight range since its considerable gap up gain on 5/10/11 for a new all-time high, building on a new flat base pattern just under the minimum 5-week length. Prior highs near $96 define initial support to watch nearly coinciding with its 50-day moving average (DMA) line. Since last shown in this FSU section on 5/02/11 with an annotated graph under the headline, "Consolidating After Later Gains Lacked Volume", it reported strong earnings +62% on +37% sales revenues for the quarter ended March 31, 2011 versus the year ago period.
Much earlier, FOSL appeared in this section near $44 on 8/11/10 under the headline, "Breakaway Gap On More Than Triple Average Volume". It was featured in yellow in the 8/10/10 mid-day report (read here) and has subsequently traded as much as +136% higher. The number of top-rated funds owning its shares rose from 512 in Mar '10 to 613 in Mar '11 a reassuring sign concerning the I criteria of the investment system.
It is scheduled to release earnings news on May 10th. Sales revenues and earnings increases showed impressive acceleration in the 5 latest quarters (Dec '09, Mar, Jun, Sep, Dec '10) following a streak of 4 negative comparisons versus the year ago period. Much earlier, FOSL appeared in this section near $44 on 8/11/10 under the headline, "Breakaway Gap On More Than Triple Average Volume". It was featured in yellow in the 8/10/10 mid-day report (read here) and has subsequently traded as much as +113% higher. The number of top-rated funds owning its shares rose from 512 in Mar '10 to 582 in Mar '11 a reassuring sign concerning the I criteria of the investment system.
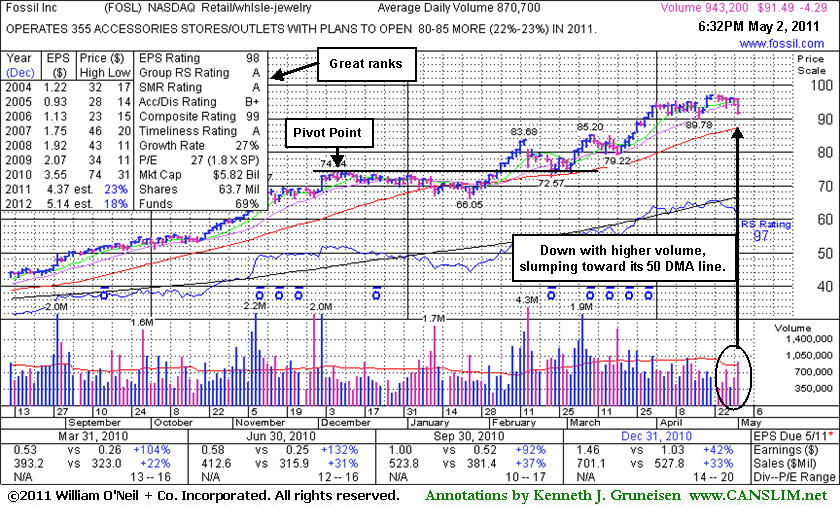
Fossil Inc (FOSL +$1.64 or +1.82% to $91.69 has been wedging higher without great volume conviction, getting more extended from its prior base. It was last shown in this FSU section on 2/24/11 with an annotated graph under the headline "Prior Highs And 50-Day Average Define Important Support", after its damaging gap down on 2/15/11 and additional losses pressured it near prior resistance in the $74 area. It found support near the old resistance level but did not form a sound new base. patience may allow for a new base to form, but disciplined investors avoid chasing extended stocks.
the number of top-rated funds owning its shares rose from 512 in Mar '10 to 550 in Dec '10 a reassuring sign concerning the I criteria of the investment system. Sales revenues and earnings increases showed impressive acceleration in the 5 latest quarters (Dec '09, Mar, Jun, Sep, Dec '10) following a streak of 4 negative comparisons versus the year ago period. Much earlier, FOSL appeared in this section near $44 on 8/11/10 under the headline, "Breakaway Gap On More Than Triple Average Volume". It was featured in yellow in the 8/10/10 mid-day report (read here) and has subsequently traded as much as +101.9% higher.
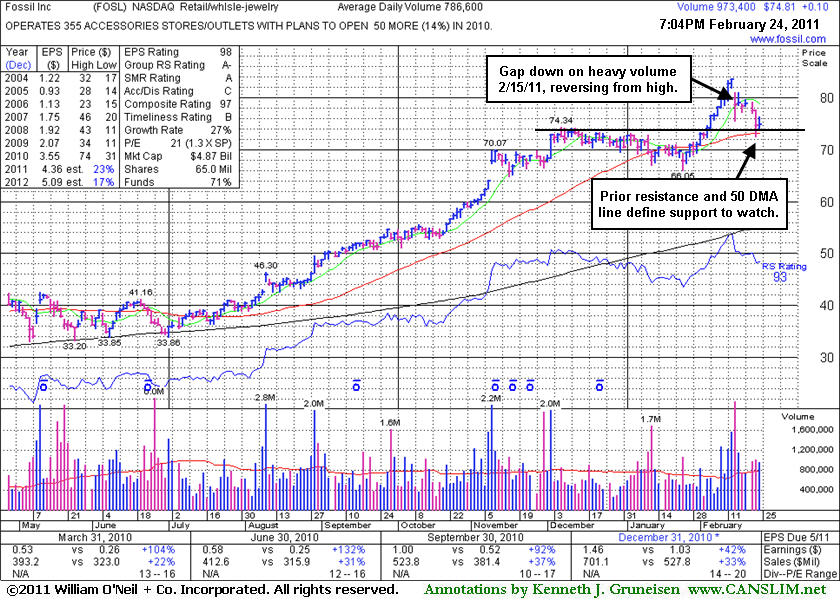
Fossil Inc (FOSL +$0.10 or +0.14% to $74.81) is consolidating after testing support this week with losses after its damaging gap down on 2/15/11 with heavy volume broke a streak of 8 consecutive gains into new high territory. Support is defined by its 50-day moving average (DMA) line and prior resistance in the $74 area. More damaging losses could trigger technical sell signals. It was last shown in the FSU section with an annotated graph on 1/12/11 under the headline "Violation Of 50-Day Average On High Volume Triggers Sell Signal" when it was down on volume more than twice its average daily trading total, violating its 50-day moving average (DMA) line with a damaging loss and triggering a technical sell signal.
Its color code was changed to yellow on 2/01/11 when noted while approaching its 52-week high, yet by the time gains above its new pivot point came with heavy volume it was getting extended beyond the riskier "late-stage" base that was identified. Sales revenues and earnings increases showed impressive acceleration in the 5 latest quarters (Dec '09, Mar, Jun, Sep, Dec '10) following a streak of 4 negative comparisons versus the year ago period. Much earlier, FOSL appeared in this section near $44 on 8/11/10 under the headline, "Breakaway Gap On More Than Triple Average Volume". It was featured in yellow in the 8/10/10 mid-day report (read here) and has subsequently traded as much as +83.75% higher.
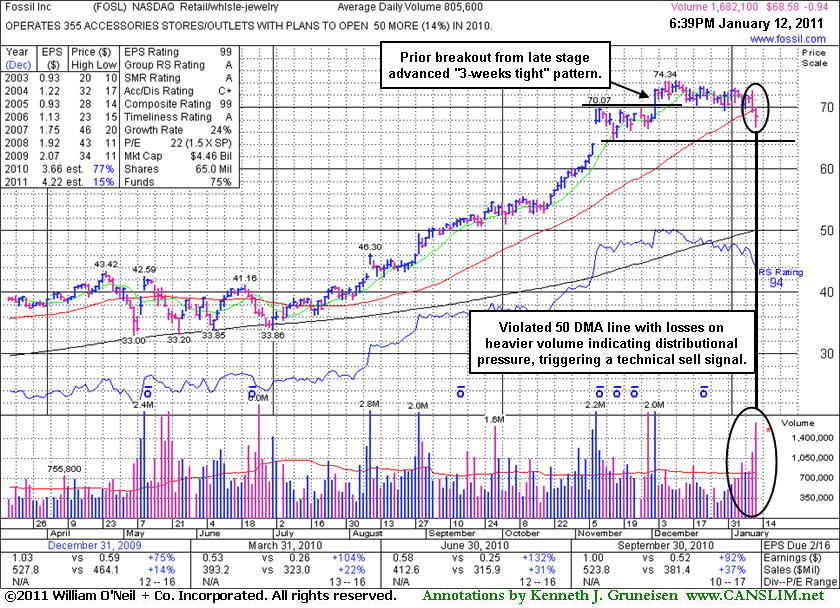
Fossil Inc (FOSL -$0.93 or -1.34% to $68.58) was down today with higher volume more than twice its average daily trading total, violating its 50-day moving average (DMA) line with a damaging loss and triggering a technical sell signal. Its color code was recently changed to green due to its deterioration and general lack of progress since its 12/02/10 breakout from a "3-weeks tight" pattern. It finished near the middle of its intra-day range and near a previously noted upward trendline (not shown) connecting its July - October lows which also defines a support level to watch near its short-term average. Subsequent deterioration may trigger a more worrisome technical sell signal. It was last shown in the FSU section with an annotated graph on 11/29/10 while trading near $54 under the headline "Advanced 3-Weeks Tight Pattern May Be A Late Stage Base". That breakout has been completely negated, and now it faces resistance due to overhead supply that was created in recent months while trading at slightly higher prices.
Sales revenues and earnings increases showed impressive acceleration in the 4 latest quarters (Dec '09, Mar, Jun, and Sep '10) following a streak of 4 negative comparisons versus the year ago period. Much earlier, FOSL appeared in this section near $44 on 8/11/10 under the headline, "Breakaway Gap On More Than Triple Average Volume". It was featured in yellow in the 8/10/10 mid-day report (read here) and has subsequently traded as much as +63% higher.
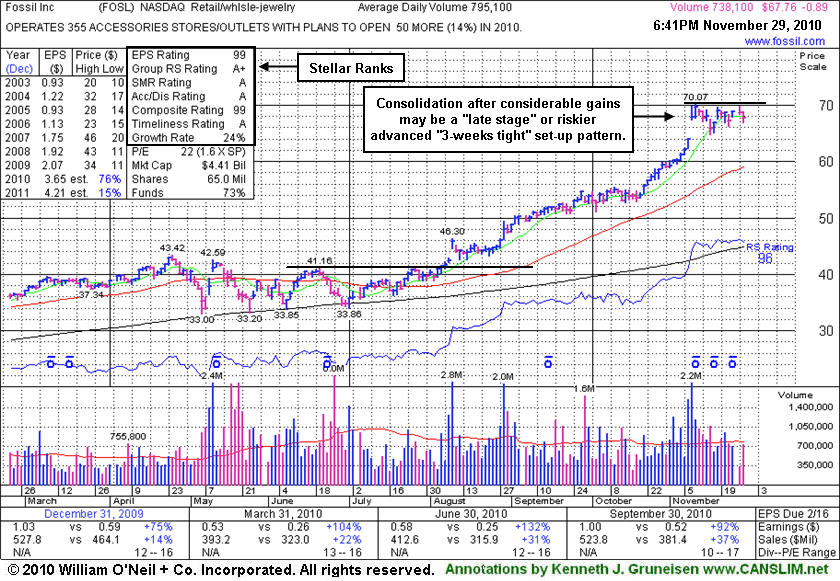
Fossil Inc (FOSL -$0.89 or -1.30% to $67.76) was most recently noted as its color code was changed to yellow after an advanced "3-weeks tight" pattern has formed following a considerable rally from its prior base. Disciplined investors will resist the temptation to get in "early" while watching for a convincing subsequent breakout above its new pivot point of $70.17 with great volume conviction. A follow-through day (FTD) is also needed from at least one of the major averages (M criteria) as critical reassurance before new (or add-on) buying efforts in any stocks are justified under the investment system guidelines. The M criteria argues that 3 out of 4 stocks will follow the direction of the major averages. An upward trendline connecting its July-October lows (not shown) defines support to watch above its 50-day moving average (DMA) line.
It faces no resistance due to overhead supply. Sales revenues and earnings increases showed impressive acceleration in the 4 latest quarters (Dec '09, Mar, Jun, and Sep '10) following a streak of 4 negative comparisons versus the year ago period. In recent weeks there has been improving leadership in the Retail/Wholesale - Jewelry group (L criteria), which is a reassuring sign. FOSL was last shown in the FSU section with an annotated graph on 10/05/10 while trading near $54 under the headline" Action Following Breakaway Gap Has Been Strong", and earlier it appeared in this section near $44 on 8/11/10 under the headline, "Breakaway Gap On More Than Triple Average Volume", right after it was featured in yellow in the 8/10/10 mid-day report (read here).
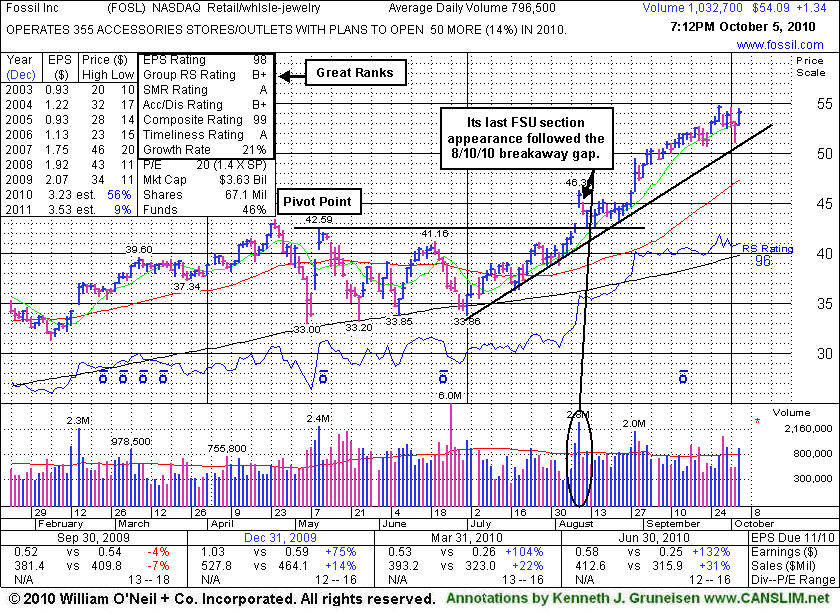
Fossil Inc (FOSL +$1.39 or +2.64% to $54.148) rallied for a solid gain today with above average volume for its second best close after recent signs of distribution. An upward trendline defines initial support to watch after it has been repeatedly noted as "extended from any sound base." It was last shown in the FSU section with an annotated graph on 8/11/10 under the headline, "Breakaway Gap On More Than Triple Average Volume", right after it was featured in yellow in the 8/10/10 mid-day report (read here).
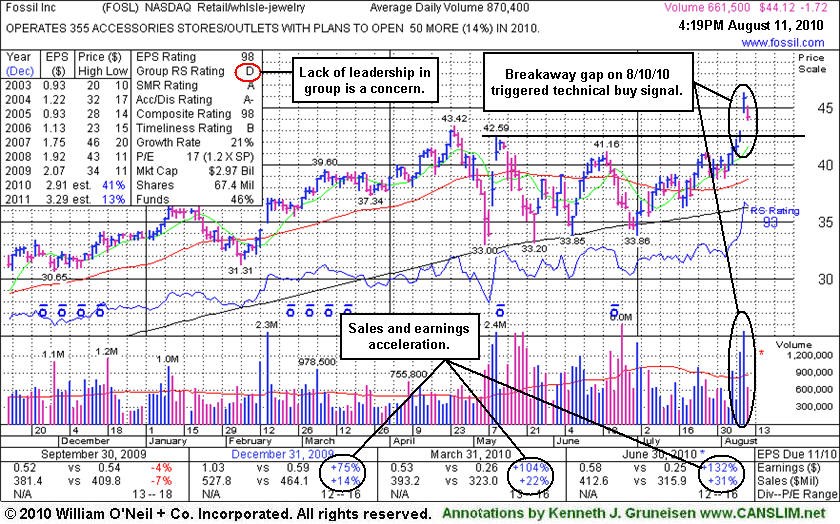
The M criteria argues that 3 out of 4 stocks will follow the direction of the major averages, so widespread leadership helps its chances to continue rallying. As before, it faces no resistance due to overhead supply. Sales revenues and earnings increases showed impressive acceleration in the 3 latest quarters (Dec '09, Mar and Jun '10) following a streak of 4 negative comparisons versus the year ago period. It is a promising looking outlier while a lack of leadership in the Retail/Wholesale - Jewelry group (L criteria) has been noted.
Fossil Inc (FOSL -$1.66 or -3.62% to $44.18) pulled back today and closed below its "max buy" level amid broad-based market weakness following a considerable "breakaway gap" for a new 52-week high and all-time high. It faces no resistance due to overhead supply after triggering a technical buy signal. FOSL was featured in yellow in the 8/10/10 mid-day report (read here). Sales revenues and earnings increases showed impressive acceleration in the 3 latest quarters (Dec '09, Mar and Jun '10) following a streak of 4 negative comparisons versus the year ago period. It is a promising looking outlier while a lack of leadership in the Retail/Wholesale - Jewelry group (L criteria) has been noted as a concern along with recent distributional action noted in the major averages. The M criteria argues that 3 out of 4 stocks will follow the direction of the major averages, so any additional technical weakness in the market would hurt its chances and might raise greater concerns.