Negative Reversal After Touching a New High - Monday, December 7, 2015
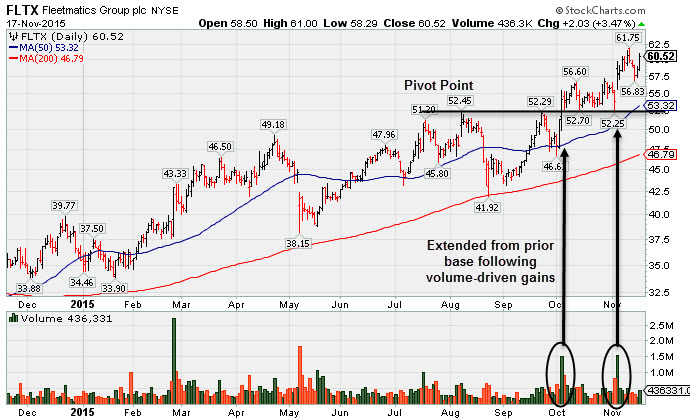
Extended From Prior Base and Perched Near High - Tuesday, November 17, 2015
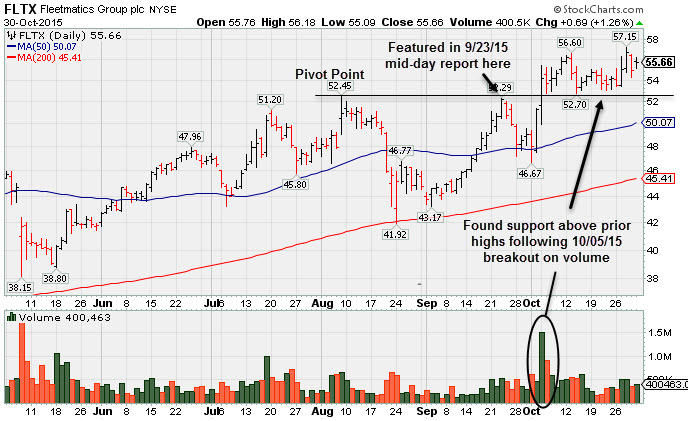
Earnings News Due May Contribute to Volatility Next Week - Friday, October 30, 2015
Found Support Above Prior Highs Following Breakout - Monday, October 19, 2015
Holding Ground Following Volume-Driven Breakout - Thursday, October 8, 2015
Perched New Prior High After Big Streak Of Gains - Wednesday, September 23, 2015
Negative Reversal After Touching a New High - Monday, December 7, 2015
Fleetmatics Group Plc (FLTX -$0.67or -1.09% to $61.00) churned above average volume today but ended with a loss after touching a new 52-week high. It has been showing signs of distributional pressure after wedging into new high territory with gains lacking great volume conviction. The recent consolidation was also too short to be recognized as a valid base.
Prior highs in the $56 area define important near-term support coinciding with its 50-day moving average (DMA) line ($56.30). FLTX was last shown in this FSU section on 11/17/15 with an annotated graph under the headline, Extended From Prior Base and Perched Near High".
The high-ranked Ireland-based Computer Software - Enterprise firm reported earnings +41% on +22% sales revenues for the Sep '15 quarter, continuing its strong earnings track record with increases above the +25% minimum guideline (C criteria).
In the 9/23/15 mid-day report (read here) it was highlighted at $51.26 in yellow with pivot point cited based on its 8/07/15 high plus 10 cents. A volume-driven gain on 10/05/15 triggered a technical buy signal.
The number of top-rated funds owning its share rose from 280 in Dec '14 to 339 in Sep '15, a reassuring sign concerning the I criteria. Its current Up/Down Volume Ratio of 147 is an unbiased indication its shares have been under accumulation over the past 50 days. Its small supply of only 38.6 million shares outstanding (S criteria) can contribute to volatility in the event of any institutional buying or selling.
Extended From Prior Base and Perched Near High - Tuesday, November 17, 2015
Fleetmatics Group Plc (FLTX +$2.03 or +3.47% to $60.52) rallied for its second-best close with today's gain. Disciplined investors avoid chasing stocks that are extended more than +5% above prior highs from a sound base. Prior highs in the $56 area acted as support during its brief consolidation while it stayed well above its 50-day moving average (DMA) line ($53.32).
It was last shown in this FSU section on 10/30/15 with an annotated graph under the headline, "Earnings News Due May Contribute to Volatility Next Week". Bullish action followed on 11/04/15 after it reported earnings +41% on +22% sales revenues for the Sep '15 quarter, continuing its strong earnings track record with increases above the +25% minimum guideline (C criteria).
The high-ranked Ireland-based Computer Software - Enterprise found support near the 50-day moving average (DMA) line during its earlier consolidation. In the 9/23/15 mid-day report (read here) it was highlighted at $51.26 in yellow with pivot point cited based on its 8/07/15 high plus 10 cents. A volume-driven gain on 10/05/15 triggered a technical buy signal.
The number of top-rated funds owning its share rose from 280 in Dec '14 to 3344 in Sep '15, a reassuring sign concerning the I criteria. Its current Up/Down Volume Ratio of 1.7 is an unbiased indication its shares have been under accumulation over the past 50 days. Its small supply of only 38.6 million shares outstanding (S criteria) can contribute to volatility in the event of any institutional buying or selling.
Earnings News Due May Contribute to Volatility Next Week - Friday, October 30, 2015
Fleetmatics Group Plc (FLTX +$0.69 or +1.26% to $55.66) posted a small gain on Friday to rise back above its "max buy" level and its color code is changed to green. Prior highs in the $52 area acted as support during its consolidation. It is perched near its 52-week high. A volume-driven gain on 10/05/15 that triggered a technical buy signal. Keep in mind that it is due to report Sep '15 quarterly earnings on 11/03/15, and volume and volatility often increase near earnings news.
The high-ranked Ireland-based Computer Software - Enterprise found support near the 50-day moving average (DMA) line during its earlier consolidation. In the 9/23/15 mid-day report (read here) it was highlighted at $51.26 in yellow with pivot point cited based on its 8/07/15 high plus 10 cents.
The number of top-rated funds owning its share rose from 280 in Dec '14 to 322 in Sep '15, a reassuring sign concerning the I criteria. Its current Up/Down Volume Ratio of 1.3 is an unbiased indication its shares have been under accumulation over the past 50 days. Its small supply of only 38.5 million shares outstanding (S criteria) can contribute to volatility in the event of any institutional buying or selling.
It found support at its 200 DMA line during its consolidation since noted with caution at its 52-week high in the 8/07/15 mid-day report "Reported earnings +83% on +24% sales revenues for the Jun '15 quarter, its 3rd consecutive quarterly earnings comparison above the +25% minimum guideline (C criteria). That helps it better match the fact-based investment system's guidelines however sequential quarterly comparisons have shown deceleration in its growth rate. Gapped up today hitting a new 52-week high, and no resistance remains due to overhead supply. Encountered distributional pressure following a technical breakout on 7/27/15, then found support above its 50 DMA line during its recent consolidation."
Found Support Above Prior Highs Following Breakout - Monday, October 19, 2015
Fleetmatics Group Plc (FLTX +$0.33 or +0.61% to $54.69) is perched near its 52-week high. Prior highs acted as support when consolidating after a volume-driven gain on 10/05/15 that triggered a technical buy signal. The high-ranked Ireland-based Computer Software - Enterprise found support near the 50-day moving average (DMA) line during its earlier consolidation.
FLTX was last shown in this FSU section on 10/08/15 with an annotated graph under the headline, "Holding Ground Following Volume-Driven Breakout". In the 9/23/15 mid-day report (read here) at $51.26 it was highlighted in yellow with pivot point cited based on its 8/07/15 high plus 10 cents.
The number of top-rated funds owning its share rose from 280 in Dec '14 to 322 in Sep '15, a reassuring sign concerning the I criteria. Its current Up/Down Volume Ratio of 1.4 is an unbiased indication its shares have been under accumulation over the past 50 days.
It found support at its 200 DMA line during its consolidation since noted with caution at its 52-week high in the 8/07/15 mid-day report "Reported earnings +83% on +24% sales revenues for the Jun '15 quarter, its 3rd consecutive quarterly earnings comparison above the +25% minimum guideline (C criteria). That helps it better match the fact-based investment system's guidelines however sequential quarterly comparisons have shown deceleration in its growth rate. Gapped up today hitting a new 52-week high, and no resistance remains due to overhead supply. Encountered distributional pressure following a technical breakout on 7/27/15, then found support above its 50 DMA line during its recent consolidation."
Holding Ground Following Volume-Driven Breakout - Thursday, October 8, 2015
Fleetmatics Group Plc (FLTX +$0.51 or +0.94% to $54.64) is perched at its 52-week high following a considerable volume-driven gain on 10/05/15 that triggered a technical buy signal. The high-ranked Ireland-based Computer Software - Enterprise found support near the 50-day moving average (DMA) line during its recentr consolidation. It was last shown in this FSU section on 9/23/15 with an annotated graph under the headline, "Perched New Prior High After Big Streak Of Gains", was highlighted in yellow with pivot point cited based on its 8/07/15 high plus 10 cents.
The number of top-rated funds owning its share rose from 280 in Dec '14 to 322 in Jun '15, a reassuring sign concerning the I criteria. Its current Up/Down Volume Ratio of 1.2 is an unbiased indication its shares have been under accumulation over the past 50 days.
The high-ranked Ireland-based Computer Software - Enterprise firm found support at its 200 DMA line during its consolidation since last noted with caution at its 52-week high in the 8/07/15 mid-day report "Reported earnings +83% on +24% sales revenues for the Jun '15 quarter, its 3rd consecutive quarterly earnings comparison above the +25% minimum guideline (C criteria). That helps it better match the fact-based investment system's guidelines however sequential quarterly comparisons have shown deceleration in its growth rate. Gapped up today hitting a new 52-week high, and no resistance remains due to overhead supply. Encountered distributional pressure following a technical breakout on 7/27/15, then found support above its 50 DMA line during its recent consolidation."
Perched New Prior High After Big Streak Of Gains - Wednesday, September 23, 2015
Fleetmatics Group Plc (FLTX +$1.59 or +3.14% to $52.19) was highlighted in yellow with pivot point cited based on its 8/07/15 high plus 10 cents in the earlier mid-day report (read here). It finished within close striking distance of its 52-week high with today's 10th consecutive gain. Subsequent volume-driven gains for new highs may trigger a technical buy signal. Disciplined investors will watch for convincing proof of fresh institutional buying demand before considering taking any action on this candidate.
The number of top-rated funds owning its share rose from 145 in Sep '14 to 157 in Jun '15, a reassuring sign concerning the I criteria. However, its current Up/Down Volume Ratio of 0.7 is an unbiased indication its shares have been under some distributional pressure over the past 50 days.
The high-ranked Ireland-based Computer Software - Enterprise firm found support at its 200 DMA line during its consolidation since last noted with caution at its 52-week high in the 8/07/15 mid-day report "Reported earnings +83% on +24% sales revenues for the Jun '15 quarter, its 3rd consecutive quarterly earnings comparison above the +25% minimum guideline (C criteria). That helps it better match the fact-based investment system's guidelines however sequential quarterly comparisons have shown deceleration in its growth rate. Gapped up today hitting a new 52-week high, and no resistance remains due to overhead supply. Encountered distributional pressure following a technical breakout on 7/27/15, then found support above its 50 DMA line during its recent consolidation."