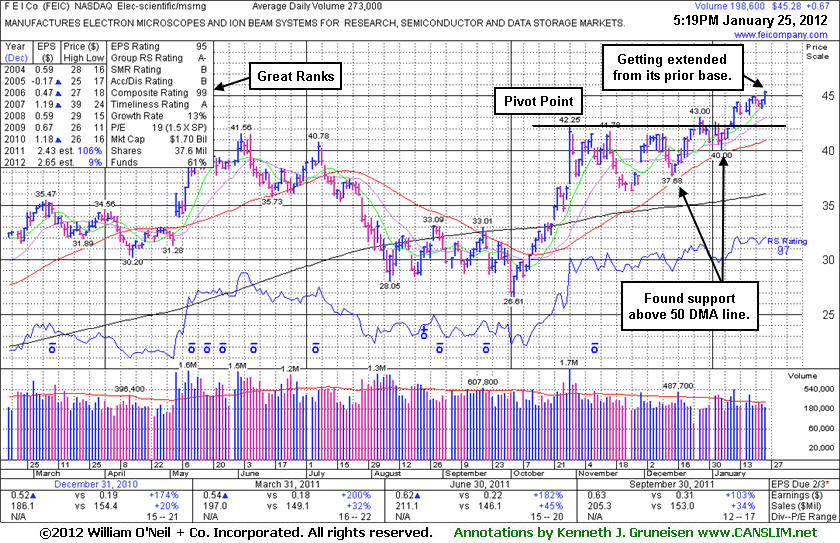
Its last appearance in this FSU section was on 1/25/12 with an annotated daily graph under the headline, "Group Leadership Improved While Rallying to New Highs " as it rallied above its "max buy" level. Leadership provided by other companies in the Electronics - Scientific Measuring industry group was noted as a reassuring sign concerning the L criteria. The number of top-rated funds owning its shares rose from 283 in Dec '10 to 391 in Dec '11, a reassuring sign concerning the I criteria. Its small supply of only 37.1 million shares outstanding is a favorable characteristic concerning the S criteria.
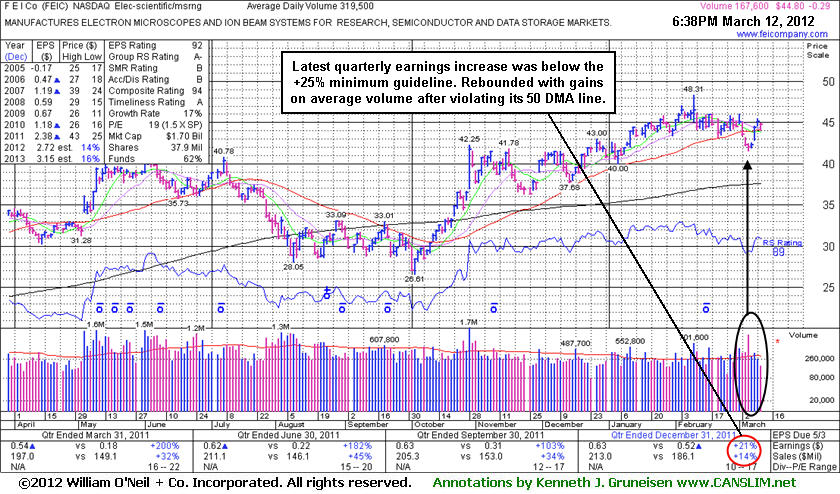
Its Group RS Rating has improved to 83 from a mediocre 47 when it was last analyzed in this FSU section. Leadership provided by other companies in the Electronics - Scientific Measuring industry group was noted as a reassuring sign concerning the L criteria. The number of top-rated funds owning its shares rose from 283 in Dec '10 to 352 in Dec '11, a reassuring sign concerning the I criteria. Its small supply of only 37.6 million shares outstanding is a favorable characteristic concerning the S criteria.
It reported earnings +103% on +34% sales revenues for the quarter ended September 30, 2011 versus the year ago period. Sales revenues and earnings increases (C criteria) have been strong in recent quarterly comparisons. Concern was previously noted because its annual earnings (A criteria) history was up and down, yet recent fundamental and technical action has been a better match for winning models of the fact-based investment system.
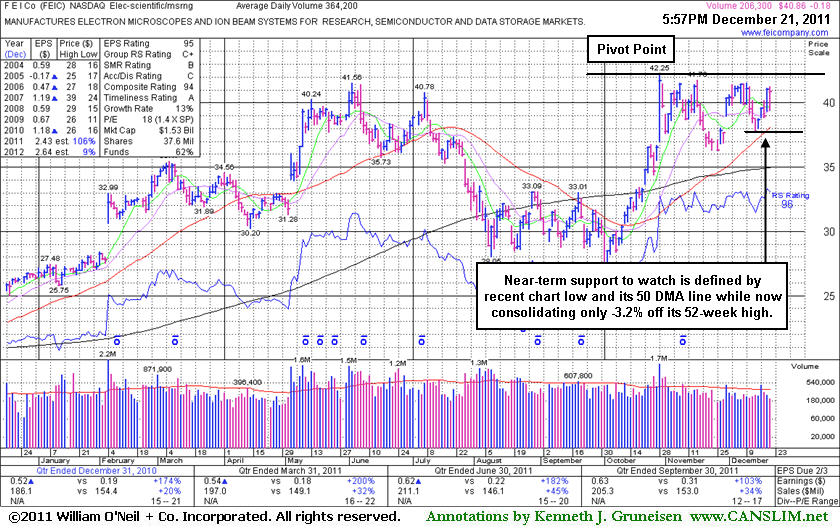
F E I Co (FEIC -$0.18 or -0.44% to $40.86) is still perched within close striking distance of its all-time high while consolidating above its 50-day moving average (DMA) line and recent lows defining near-term chart support. Disciplined investors would watch for a volume-driven gain above the pivot point to trigger a proper technical buy signal. Its last appearance in this FSU section was on 11/25/11 with an annotated daily graph under the headline, "Stalled After Rallying to a New High." Disciplined investors limit losses if a stock falls more than -7% from their purchase, so any who may have accumulated shares in recent weeks have likely been prompted to sell by its subsequent weakness.
Recently, strong action came after reporting earnings +103% on +34% sales revenues for the quarter ended September 30, 2011 versus the year ago period. Sales revenues and earnings increases (C criteria) have been strong in recent quarterly comparisons. Concern was previously noted because its annual earnings (A criteria) history was up and down, yet recent fundamental and technical action has been a better match for winning models of the fact-based investment system.
The number of top-rated funds owning its shares rose from 283 in Dec '10 to 346 in Sep '11, a reassuring sign concerning the I criteria. Its Group RS Rating is only a mediocre 47 now, however leadership provided by other companies in the Electronics - Scientific Measuring industry group has been a reassuring sign concerning the L criteria. Its small supply of only 37.6 million shares outstanding is a favorable characteristic concerning the S criteria. Disciplined investors avoid chasing stocks more than +5% above a prior chart high, and they always limit losses at -7% by selling if a stock falls that much from their purchase price.
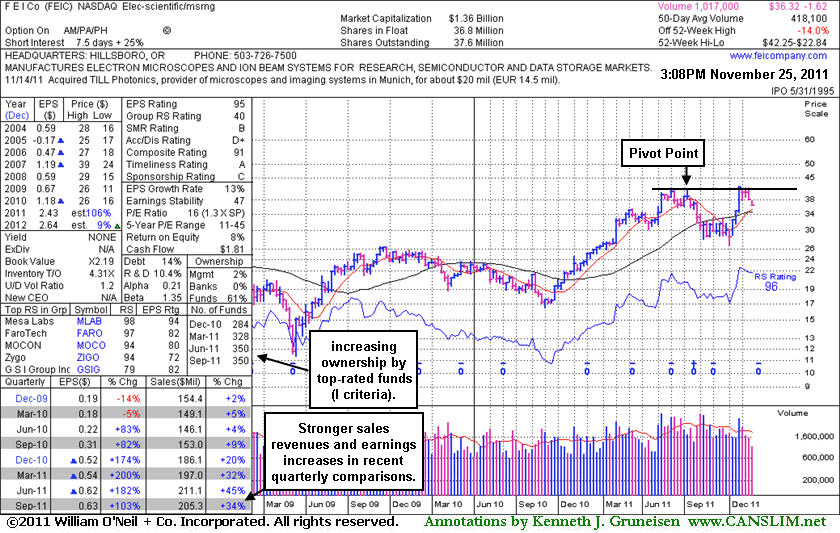
F E I Co (FEIC -$0.58 or -1.57% to $36.32) color code was recently changed to green after it slumped well below its pivot point. Disciplined investors limit losses if a stock falls more than -7% from their purchase, so any who may have accumulated shares in recent weeks have likely been prompted to sell by its subsequent weakness. It finished -14.0% off its 52-week high today and it may be forming a new base pattern, but it needs to show some technical strength for its outlook to improve. Its last appearance in this FSU section was on 10/28/11 with an annotated daily graph under the headline, "Sprinting Straight Up From Bottom of 16-Week Cup Shaped Base." It had been highlighted in yellow that day in the mid-day report with a pivot point based on its 7/07/11 high plus 10 cents. It finished strong after a considerable gap up gain, rallying straight up from the bottom of a 16-week cup shaped base and triggering a technical buy signal while hitting a new all-time high with volume four times average behind the gain. However, it stalled after reaching the new high ground, rather than continuing on upward to make any meaningful progress.
The strong action came after reporting earnings +103% on +34% sales revenues for the quarter ended September 30, 2011 versus the year ago period. Sales revenues and earnings increases (C criteria) have been strong in recent quarterly comparisons. Concern was previously noted because its annual earnings (A criteria) history was up and down, yet recent fundamental and technical action has been a better match for winning models of the fact-based investment system.
The weekly graph below shows that number of top-rated funds owning its shares rose from 284 in Dec '10 to 350 in Sep '11, a reassuring sign concerning the I criteria. Its Group RS Rating is only a mediocre 40 now, however leadership provided by other companies in the Electronics - Scientific Measuring industry group has been a reassuring sign concerning the L criteria. Its small supply of only 37.6 million shares outstanding is a favorable characteristic concerning the S criteria. Disciplined investors avoid chasing stocks more than +5% above a prior chart high, and they always limit losses at -7% by selling if a stock falls that much from their purchase price.
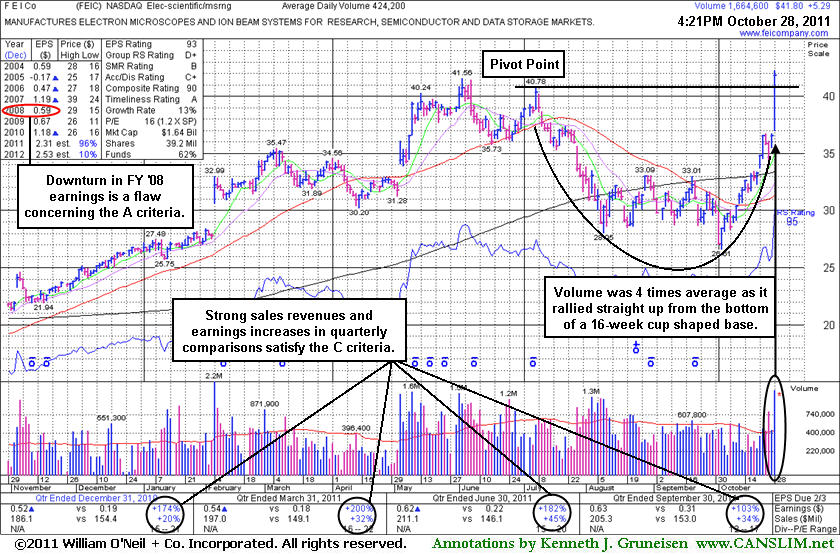
F E I Co (FEIC +$5.20 or +14.24% to $41.71) was highlighted in yellow in the mid-day report with a pivot point based on its 7/07/11 high plus 10 cents. It finished strong after a considerable gap up gain, rallying straight up from the bottom of a 16-week cup shaped base and triggering a technical buy signal. It hit a new all-time high while volume was four times average behind the gain. The strong action came after reporting earnings +103% on +34% sales revenues for the quarter ended September 30, 2011 versus the year ago period. Sales revenues and earnings increases (C criteria) have been strong in recent quarterly comparisons. Concern was previously noted because its annual earnings (A criteria) history was up and down, yet recent fundamental and technical action has been a better match for winning models of the fact-based investment system.
The number of top-rated funds owning its shares rose from 327 in Dec '10 to 385 in Sep '11, a reassuring sign concerning the I criteria. Although its Group RS Rating is only a D+ leadership provided by other companies in the Electronics - Scientific Measuring industry group has been a reassuring sign concerning the L criteria. Its small supply of only 39.2 million shares outstanding is a favorable characteristic concerning the S criteria. Disciplined investors avoid chasing stocks more than +5% above a prior chart high, and they always limit losses at -7% by selling if a stock falls that much from their purchase price.