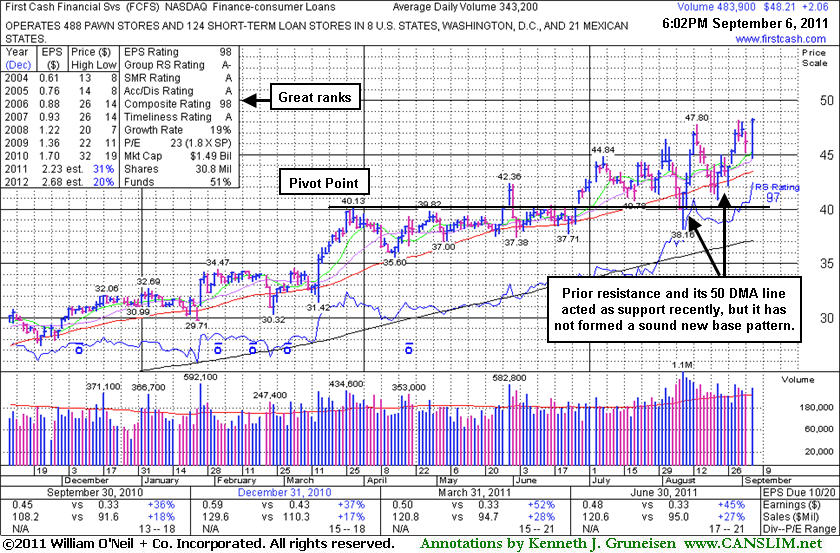
Finance Firm Has Been a Strong Outlier in Tough Market - Tuesday, September 06, 2011
First Cash Financial Services Inc. (FCFS +$2.06 or +4.46% to $48.21) posted a considerable gain today with above average volume, closing near the session high after reaching a new all-time high. It has not formed a sound new base pattern. Its 50-day moving average (DMA) line and old resistance level recently defined support during its choppy ascent. Its last appearance in this FSU section was on 8/22/11 with an annotated graph under the headline, "Consolidating Near 50-Day Average Following Reversal at New High". Since then, it managed to find support and then impressively sprint to another new high with volume-driven gains.
It reported earnings +45% on +27% sales revenues for the quarter ended June 30, 2011 versus the year ago period and its annual earnings (A criteria) history has been steady and strong. The number of top-rated funds owning its shares rose from 340 in Sep '10 to 349 in Jun '11, and the ownership from institutional investors (I criteria) has been fairly reassuring. The M criteria (market direction) largely determines whether stocks produce great gains, and while FCFS has fared well since featured in yellow in the 5/31/11 mid-day report (read here), investors should keep in mind that 3 out of 4 stocks tend to follow along with the broader market averages' direction.
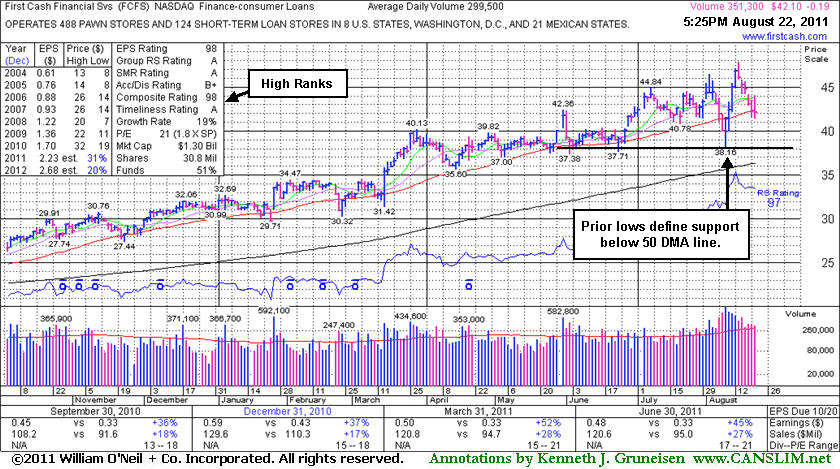
Consolidating Near 50-Day Average Following Reversal at New High - Monday, August 22, 2011
First Cash Financial Services Inc. (FCFS +$1.46 or +3.65% to $41.44) slumped just under its 50-day moving average (DMA) line today with its 6th consecutive loss since its 52-week high marked by a negative reversal. Prior chart lows near $37-38 define support to watch above its 200 DMA line. After its last appearance in this FSU section on 8/09/11 with an annotated graph under the headline, "Rallying Back Near Important Support at 50-Day Average", it managed to impressively sprint to another new high with a streak of volume-driven gains, but the broader market environment (M criteria) has weighed on it of late.FCFS reported earnings +47% on +27% sales revenues for the quarter ended June 30, 2011 versus the year ago period. Its annual earnings (A criteria) history has been steady and strong. The number of top-rated funds owning its shares rose from 340 in Sep '10 to 351 in Jun '11, and the ownership from institutional investors (I criteria) had been fairly reassuring. The M criteria (market direction) is an overriding concern arguing against all buying efforts until the latest rally attempt is confirmed with a follow-through day of solid gains from one or more of the major averages on higher volume coupled with an expansion in leadership (new 52-week highs). Remember that 3 out of 4 stocks tend to follow along with the broader market averages' direction, so even if a stock has solid fundamentals there is no excuse to hold it if it falls more than -7% from your buy point.
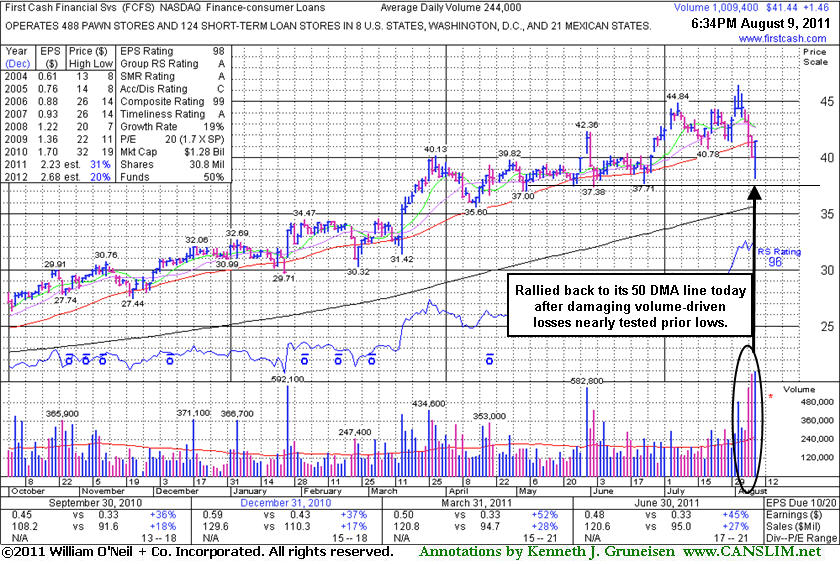
Rallying Back Near Important Support at 50-Day Average - Tuesday, August 09, 2011
First Cash Financial Services Inc. (FCFS +$1.46 or +3.65% to $41.44) finished near the session high today with a volume-driven gain as it rallied back promptly to a close near its 50-day moving average (DMA) line after 2 damaging losses. The session low and prior chart lows near $37-38 define important support to watch above its 200 DMA line now. After its last appearance in this FSU section on 7/18/11 with an annotated graph under the headline, "Financial Services Firm Consolidating in Healthy Manner", it managed to reach a new high, but the broader market environment (M criteria) has weighed on it of late.
FCFS reported earnings +47% on +27% sales revenues for the quarter ended June 30, 2011 versus the year ago period. Its annual earnings (A criteria) history has been steady and strong. The number of top-rated funds owning its shares fell slightly from 352 in Mar '11 to 348 in Jun '11, whereas prior to that the ownership from institutional investors (I criteria) had been increasing. The M criteria (market direction) is an overriding concern arguing against all buying efforts until the nascent rally attempt is confirmed with a follow-through day of solid gains from one or more of the major averages on higher volume coupled with an expansion in leadership (new 52-week highs). Remember that 3 out of 4 stocks tend to follow along with the broader market averages' direction, so even if a stock has solid fundamentals there is no excuse to hold it if it falls more than -7% from your buy point.
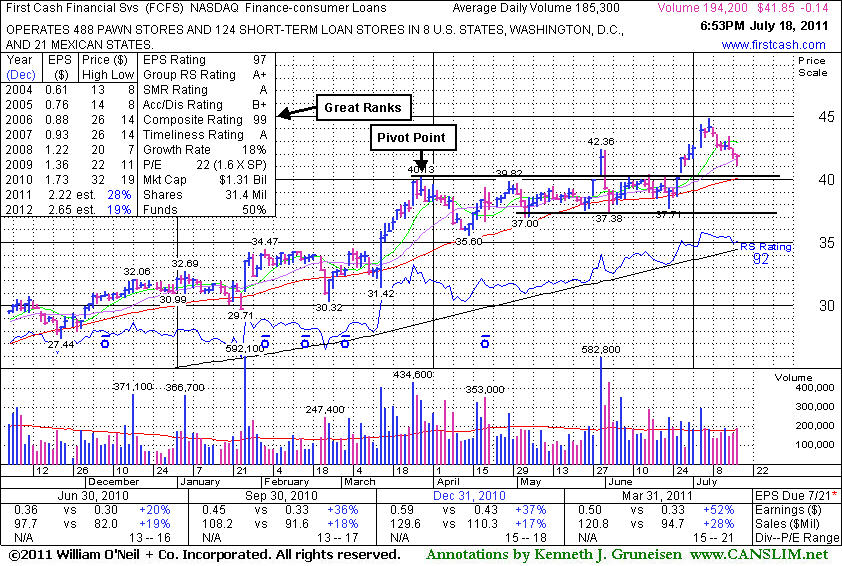
Financial Services Firm Consolidating in Healthy Manner - Monday, July 18, 2011
First Cash Financial Services Inc. (FCFS -$0.14 or -0.33% to $41.85) is consolidating -6.7 off its all-time high today. It is not very extended from its last base identified in earlier CANSLIM.net reports following its normal consolidation. Its color code is changed to yellow again. Prior highs in the $40-42 area define initial support areas to watch along with its 50-day moving average (DMA) line. After its last appearance in this FSU section was on 6/22/11 with an annotated graph under the headline, "Faltering After Breakout Yet Finding Support", its prior lows in the $37 area defined support. A new pivot point was not cited, however some may have considered its latest consolidation a new "square box" type base pattern. Its color code was changed to yellow based on resilience after negating its prior breakout yet finding great support, while we stuck with our earlier analysis' pivot point and "max buy" levels.
The Finance - Consumer Loans group has several other strong leaders (L criteria) in it including EZCorp Inc (EZPW) and Credit Acceptance Corp (CACC), both of which are also currently included on the Featured Stocks list.
FCFS reported earnings +52% on +28% sales revenues for the quarter ended March 31, 2011 versus the year ago period. Its annual earnings (A criteria) history has been steady. The number of top-rated funds owning its shares rose slightly from 336 in Jun '10 to 351 in Mar '11. Recent signs of improvement in the M criteria (market direction) have been followed by questionable action at best. Remember that 3 out of 4 stocks tend to follow along with the broader market averages' direction, so even if a stock has solid fundamentals there is no excuse to hold it if it falls more than -7% from your buy point.
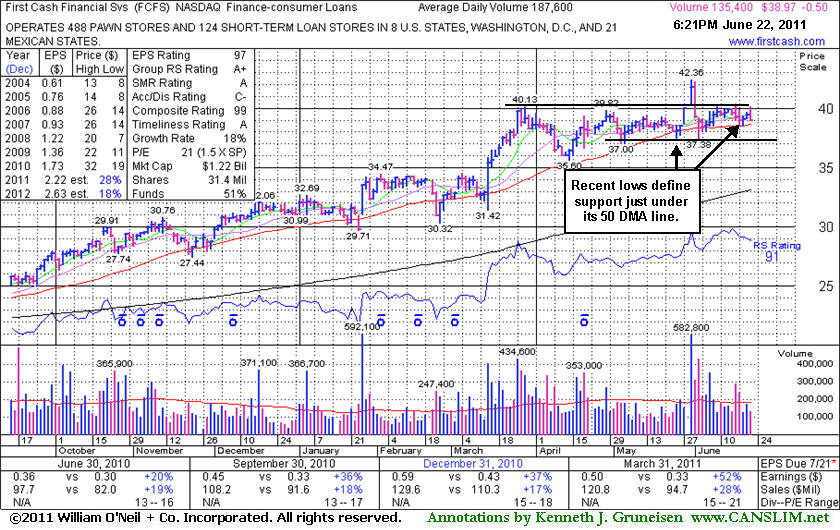
Faltering After Breakout Yet Finding Support - Wednesday, June 22, 2011
First Cash Financial Services Inc. (FCFS -$0.51 or -1.29% to $38.96) lost ground today on lighter than average volume. Its 50-day moving average (DMA) line defines initial support to watch while its recent lows in the $37 area also define nearby support. Its color code was changed to green after damaging losses on higher volume negated its latest breakout. Its last appearance in this FSU section was on 5/31/11 with an annotated graph under the headline, "Fresh Technical Breakout From Firm in Finance - Consumer Loans Industry", as it gapped up today and hit a new 52-week high, rising from an orderly flat base pattern with 3 times average volume triggering a technical buy signal.
It was color coded yellow with pivot point cited based on its 52-week high plus ten cents when featured in the 5/31/11 mid-day report (read here). It reported earnings +52% on +28% sales revenues for the quarter ended March 31, 2011 versus the year ago period. Its annual earnings (A criteria) history has been steady. The number of top-rated funds owning its shares rose slightly from 336 in Jun '10 to 349 in Mar '11.
The major averages' recent gains were coupled with higher volume totals on the major exchanges and an expansion in the number of stocks hitting new 52-week highs. While the action signaled accumulation, a more convincing follow-through day (FTD) of gains from at least one of the major averages is still needed to confirm a substantial improvement in the M criteria (market direction).
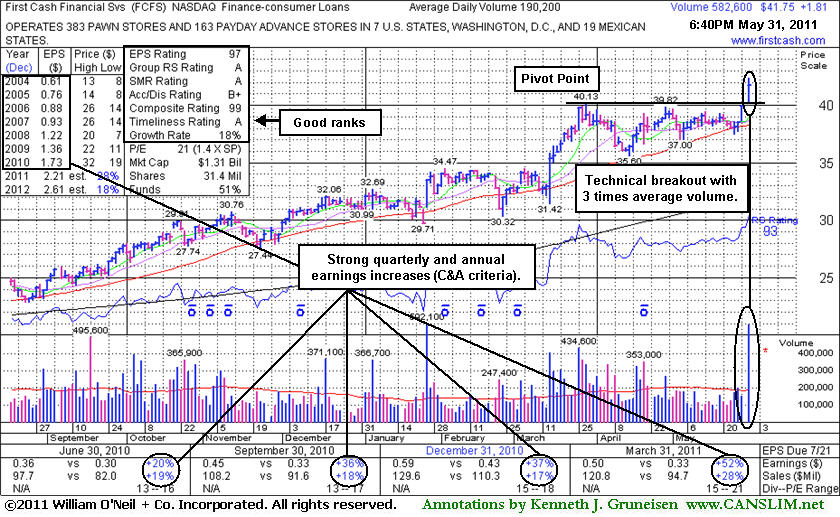
Fresh Technical Breakout From Firm in Finance - Consumer Loans Industry - Tuesday, May 31, 2011
A very important technical tool that savvy investors have learned to incorporate in their technical analysis is the 50-day moving average (DMA) line. The 50 DMA line plays a pivotal role relative to a stock's price. If the price of a stock is above its 50 DMA then odds are that its 50 DMA will act as formidable support. Conversely, if the price is below its 50 DMA then the moving average acts as resistance. Healthy stocks sometimes trade under their 50 DMA lines briefly, but usually a strong candidate will promptly bounce and repair a 50 DMA violation. When a stock has violated its 50 DMA line and then lingers beneath it, the stock's outlook gets worse and worse as it spends a greater period of time trading under that important short-term average line. Once the 50 DMA line starts sloping downward it should also be acknowledged that the stock has been struggling for a while, and it might be time to reduce exposure and look for places to put that money to work in stronger buy candidates.First Cash Financial Services Inc. (FCFS +$1.81 or +4.53% to $41.75) gapped up today and hit a new 52-week high, rising from an orderly flat base pattern with 3 times average volume triggering a technical buy signal. Its color code was changed to yellow with pivot point cited based on its 52-week high plus ten cents when featured in the mid-day report (read here). Its 50 DMA line defines near-term support. It reported earnings +52% on +28% sales revenues for the quarter ended March 31, 2011 versus the year ago period. Its annual earnings (A criteria) history has been steady. It may be considered a "late-stage" and risky buy candidate. The number of top-rated funds owning its shares rose slightly from 336 in Jun '10 to 347 in Mar '11.
The major averages' gains today coupled with higher volume totals on the major exchanges and an expansion in the number of stocks hitting new 52-week highs signaled an improvement in the M criteria (market direction). Long ago, FCFS was included on the Featured Stocks list, and it has returned to the list based upon its strong fundamental and technical characteristics today.
Leader Above Support at 50 DMA Line and Prior Chart Highs - Wednesday, January 31, 2007
A very important technical tool that savvy investors have learned to incorporate in their technical analysis is the 50-day moving average (DMA) line. The 50 DMA line plays a pivotal role relative to a stock's price. If the price of a stock is above its 50 DMA then odds are that its 50 DMA will act as formidable support. Conversely, if the price is below its 50 DMA then the moving average acts as resistance. Healthy stocks sometimes trade under their 50 DMA lines briefly, but usually a strong candidate will promptly bounce and repair a 50 DMA violation. When a stock has violated its 50 DMA line and then lingers beneath it, the stock's outlook gets worse and worse as it spends a greater period of time trading under that important short-term average line. Once the 50 DMA line starts sloping downward it should also be acknowledged that the stock has been struggling for a while, and it might be time to reduce exposure and look for places to put that money to work in stronger buy candidates.
First Cash Financial Services Inc. (FCFS +$0.26 or +1.10% to $23.48) continued bouncing after recently testing its 50 DMA line, although its three most recent gains have lacked volume conviction. This stock was featured on Friday, December 23, 2005 in the CANSLIM.net Mid Day Breakouts Report (read here) with a $15.01 (split adjusted) pivot point. The recent action was covered in Thursday December 28, 2006 edition of the CANSLIM.net After-Market Update (read here) as it was gapping to new highs. However, it encountered heavy distributional action immediately thereafter, and recently it has found support at its 50 DMA line while also avoiding any closes back under its October-November chart highs which are also a key chart support level. Keep in mind that it is very normal for leading stocks to pull back and test support near their 50 DMA lines and old chart highs as they march higher. As long as this issue continues trading above these important levels, the bulls remain in control. However, if either level is breached then lower prices are more follow.
C A N S L I M | StockTalk | News | Chart | ![]() DGO | SEC | Zacks Reports
DGO | SEC | Zacks Reports

View all notes | Alert me of new notes | CANSLIM.net Company Profile
FCFS Tests Support - Wednesday, October 04, 2006
A very important technical tool that savvy investors have learned to incorporate in their technical analysis is the 50-day moving average (DMA) line. The 50 DMA line plays a pivotal role relative to a stock's price. If the price of a stock is above its 50 DMA then odds are that its 50 DMA will act as formidable support. Conversely, if the price is below its 50 DMA then the moving average acts as resistance. Healthy stocks sometimes trade under their 50 DMA lines briefly, but usually a strong candidate will promptly bounce and repair a 50 DMA violation. When a stock has violated its 50 DMA line and then lingers beneath it, the stock's outlook gets worse and worse as it spends a greater period of time trading under that important short-term average line. Once the 50 DMA line starts sloping downward it should also be acknowledged that the stock has been struggling for a while, and it might be time to reduce exposure and look for places to put that money to work in stronger buy candidates.
First Cash Financial Services Inc. (FCFS +$0.52 or +2.51% to $20.18) positively reversed off its 50 day moving average line on above average volume. This stock was featured on Friday, December 23, 2005 in the CANSLIM.net Mid Day Breakouts Report (read here) at $14.28 (split adjusted). More recently, FCFS appeared in the August 30th, 2006 CANSLIM.net After-Market Report which covered many details of its recent action (read here). Since then, this stock has failed to make any significant progress. On September 26, 2006 it placed a near term high ($21.96) and it has been steadily pulling back towards its 50 DMA. This issue continues to sport healthy fundamentals and is fighting to stay above its 50 DMA line. Its group rating has slipped to a "B" or 67th out of 197 industry groups which is less than par, since CAN SLIM(R) guidelines suggest picking stocks from groups in the top quartile of groups. In addition, technical chart resistance is likely to appear near prior chart highs near in the $22-23 area. Until it proves capable of clearing those important earlier highs it remains among what might be considered the less worthy buy candidates.
C A N S L I M | StockTalk | News | Chart | SEC | Zacks Reports

View all notes | Alert me of new notes | CANSLIM.net Company Profile
Repairing Chart Damage But Not Yet Challenging Prior Highs - Wednesday, August 30, 2006
Volume is a vital component of technical analysis. Prudent investors that incorporate volume into their stock analysis have often benefited several fold. Ideally, healthy stocks will more often tend to rise on higher volume and pullback on lighter volume. Volume is a great proxy for institutional sponsorship. Conversely, high volume declines can be an ominous, as this usually signals distribution and further price deterioration are more likely to follow.
First Cash Financial Services Inc. (FCFS +$0.59 or +2.77% to $20.71) rallied for its third consecutive day after gapping up above its 50 & 200 DMA lines. This stock was featured on Friday, December 23, 2005 in the CANSLIM.net Mid Day Breakouts Report (read here) at $14.28 (split adjusted). More recently, FCFS appeared in the August 4th, 2006 CANSLIM.net After-Market Report which covered many details of its recent action (read here). It traded as much as -13.74% lower in the next 4 trading days as it sliced beneath its longer term 200 DMA line. On August 10, 2006 it put in a near term low ($16.20) and it has been steadily rallying since. On Monday August 28th, 2006 it gapped higher for gains on above average volume, closing above both its 50 & 200 DMA lines. This issue continues to sport healthy fundamentals and is quickly repairing its technical condition. However, its group rating has slipped to a "C+" or 98th out of 197 industry groups which is less than par, since CAN SLIM(R) guidelines suggest picking stocks from groups in the top quartile of groups. In addition, technical chart resistance is likely to appear near prior chart highs near in the $22-23 area. Until it proves capable of clearing those important earlier highs it remains among what might be considered the less worthy buy candidates.
C A N S L I M | StockTalk | News | Chart | SEC | Zacks Reports

View all notes | Alert me of new notes | CANSLIM.net Company Profile
50 DMA is Resistance - Friday, August 04, 2006
A very important technical tool that savvy investors have learned to incorporate in their technical analysis is the 50-day moving average (DMA) line. The 50 DMA line plays a pivotal role relative to a stock's price. If the price of a stock is above its 50 DMA then odds are that its 50 DMA will act as formidable support. Conversely, if the price is below its 50 DMA then the moving average acts as resistance. Healthy stocks sometimes trade under their 50 DMA lines briefly, but usually a strong candidate will promptly bounce and repair a 50 DMA violation. When a stock has violated its 50 DMA line and then lingers beneath it, the stock's outlook gets worse and worse as it spends a greater period of time trading under that important short-term average line. Once the 50 DMA line starts sloping downward it should also be acknowledged that the stock has been struggling for a while, and it might be time to reduce exposure and look for places to put that money to work in stronger buy candidates.
First Cash Financial Services Inc. (FCFS -$0.32 or -1.68% to $18.78) failed to break above resistance at its 50 DMA today. This stock was first featured on Friday, December 23rd, 2005 in the CANSLIM.net Mid Day Breakouts Report (read here) at $14.28 (split adjusted) as it was setting up to potentially emerge out of a multi-month base.
More recently, on July 10, 2006 this stock was featured in the CANSLIM.net After-Market Report (read here) as it was running into resistance at its 50 DMA. Since then, a brief rally above the 50 DMA promptly failed, and the stock continues to hover below that important short-term average, which may be considered a worrisome sign. Until this candidate trades above its 50 DMA caution is definitely advised. Meanwhile, any violation and close under the prior chart lows or the 200 DMA line would be considered additional technical sell signals.
C A N S L I M | StockTalk | News | Chart | SEC | Zacks Reports

View all notes | Alert me of new notes | CANSLIM.net Company Profile
50 DMA Acting As Resistance - Monday, July 10, 2006
A very important technical tool that savvy investors have learned to incorporate in their technical analysis is the 50-day moving average (DMA) line. The 50 DMA line plays a pivotal role relative to a stock's price. If the price of a stock is above its 50 DMA then odds are that its 50 DMA will act as formidable support. Conversely, if the price is below its 50 DMA then the moving average acts as resistance. Healthy stocks sometimes trade under their 50 DMA lines briefly, but usually a strong candidate will promptly bounce and repair a 50 DMA violation. When a stock has violated its 50 DMA line and then lingers beneath it, the stock's outlook gets worse and worse as it spends a greater period of time trading under that important short-term average line. Once the 50 DMA line starts sloping downward it should also be acknowledged that the stock has been struggling for a while, and it might be time to reduce exposure and look for places to put that money to work in stronger buy candidates.
First Cash Financial Services Inc. (FCFS +$0.17 or +0.85% to $19.74) edged higher on about average volume on Monday. This stock was first featured on Friday, December 23rd, 2005 in the CANSLIM.net Mid Day Breakouts Report (read here) at $14.28 (split adjusted) as it was setting up to potentially emerge out of a multi-month base. A few short weeks after being featured, this stock blasted above its $15.02 (split adjusted) pivot point on massive volume, triggering a technical buy signal. This strong leader managed to rally an impressive +40% above its featured price while the major averages had nothing near such meaningful headway in the same time frame. The major averages showed clear distibution at the time, when on May 12th, 2006 it tested and traded below its 50 DMA, then made a positive reversal to close the session with a slight gain. It lingered near its 50 DMA line with no more losses on high volume, then rallied toward prior highs but fell short. In June in broke down under its 50 DMA and there were at least 5 down sessions on above average volume before the stock reversed from a low of $17.60 on June 21st. In recent weeks it has hovered below that important 50 DMA level, which is a worrisome sign. Until this candidate trades above its 50 DMA caution is definitely advised, and any violation and close under the recent chart lows would be considered a clear technical sell signal.
C A N S L I M | StockTalk | News | Chart | SEC | Zacks Reports

View all notes | Alert me of new notes | CANSLIM.net Company Profile
Winning Example For Study +40% - Friday, June 09, 2006

Impressive Action - Wednesday, May 31, 2006
A classic example of the success enjoyed by many CANSLIM.net readers usually starts when an investor reads a CANSLIM.net report and buys a featured stock before it has risen above the pivot point by greater than 5%. After a stock breaks out above its pivot point, there is only a +5% window that investors have to purchase the stock under the proper guidelines. Once a stock rises above the "maximum buy price" the risk of a shake out balloons, meaning that even a normal retracement in the stock might force you to employ the 7-8% loss cutting rule. Much can be told by the stock's daily action in the weeks and months that follow a breakout. Typically, a light volume and orderly pullback suggests that the bulls remain in control. However, high volume pullbacks that violate support paint a totally different picture.
First Cash Financial Services Inc. (FCFS 0.83 or 3.72% to $21.46) closed higher on above average volume on Wednesday. Last Tuesday on May 23, 2006 FCFS was covered in this report as it was tracing out the left side of its base. We wrote "This is exactly the type of action one would like to see when a stock builds a new base pattern. This stock actually traded up as much as +60.99% since it was featured on Friday, December 23rd, 2005 in the CANSLIM.net Mid Day Breakouts Report (read here) at $14.28 (split adjusted) as it was setting up. On January 13th, 2006 it blasted out with gains on heavy volume, rising out of the orderly base that had formed above its 50-day moving average (DMA) line. FCFS has enjoyed hefty gains since it was last featured largely due to its healthy fundamentals and strong group action. During its ascent, this issue has traced out a rather well-defined upward trendline whose lower boundary has recently been tested while it hasn't quite closed in clear violation of it. Note how the top was marked by an ugly negative reversal on April 19th, when early gains turned into a steep loss on heavy volume. The positive reversal on May 12th also stands out as a sign of support being found. Over the past few weeks, this issue has found support and is currently building a new base pattern. It is encouraging to see volume dry up in recent weeks while this issue is tracing out its new base. The first challenge is to get above and stay above its 50 DMA. After that, the prior highs near $22 are the next important hurdle it must clear to again become a compelling buy candidate." This is a great example of how a healthy stock performs when the major averages move lower.
C A N S L I M | StockTalk | News | Chart | ![]() DGO | SEC | Zacks Reports
DGO | SEC | Zacks Reports

View all notes | Alert me of new notes | CANSLIM.net Company Profile
Strong Stock in a Leading Group Testing Support At Upward Trendline - Tuesday, May 23, 2006
An upward trendline, by definition, develops as a stock steadily appreciates over an extended period of time. During that period the stock vacillates between the lower and upper boundaries of trendlines which can be drawn connecting a series of recent highs or lows. In order to ensure the overall health of the stock, the lower boundary should not be violated. Technically, if the lower boundary is violated, this signals that the trend is deteriorating and bears are gaining control, making the odds start to favor the possibility of further downside testing.
First Cash Financial Services Inc. (FCFS +$0.35 or +1.70% to $20.23) closed higher on below average volume on Tuesday. This is exactly the type of action one would like to see when a stock builds a new base pattern. This stock actually traded up as much as +60.99% since it was featured on Friday, December 23rd, 2005 in the CANSLIM.net Mid Day Breakouts Report (read here) at $14.28 (split adjusted) as it was setting up. On January 13th, 2006 it blasted out with gains on heavy volume, rising out of the orderly base that had formed above its 50-day moving average (DMA) line. FCFS has enjoyed hefty gains since it was last featured largely due to its healthy fundamentals and strong group action. During its ascent, this issue has traced out a rather well-defined upward trendline whose lower boundary has recently been tested while it hasn't quite closed in clear violation of it. Note how the top was marked by an ugly negative reversal on April 19th, when early gains turned into a steep loss on heavy volume. The positive reversal on May 12th also stands out as a sign of support being found. Over the past few weeks, this issue has found support and is currently building a new base pattern. It is encouraging to see volume dry up in recent weeks while this issue is tracing out its new base. The first challenge is to get above and stay above its 50 DMA. After that, the prior highs near $22 are the next important hurdle it must clear to again become a compelling buy candidate.
C A N S L I M | StockTalk | News | Chart | SEC | Zacks Reports | ![]() DGO
DGO

View all notes | Alert me of new notes | CANSLIM.net Company Profile
Impressive Reversal at Support of 50 DMA - Wednesday, March 22, 2006
A very important technical tool that savvy investors have learned to incorporate in their technical analysis is the 50-day moving average (DMA) line. The 50 DMA line plays a pivotal role relative to a stock's price. If the price of a stock is above its 50 DMA then odds are that its 50 DMA will act as formidable support. Conversely, if the price is below its 50 DMA then the moving average acts as resistance.
First Cash Financial Services Inc. (FCFS +0.04 or +0.20% to $19.79) put up an impressive fight on Wednesday. FCFS was featured on Friday, December 23rd, 2005 in the CANSLIM.net Mid Day Breakouts Report (read here) at $14.28 (split adjusted) as it was setting up to potentially emerge out of a multi-month base. A few short weeks after being featured, this stock blasted above its $15.02 (split adjusted) pivot point on massive volume, triggering a technical buy signal. This strong leader has spent the past several weeks rallying an impressive +35% above its featured price while the major averages have not made any meaningful headway in the same time frame. It abruptly pulled back and then found prompt support at its 50 DMA today. Normally, a stock pulls back and finds support near its 50 DMA, then spends some time regaining what was lost. It didn't take much time after testing the 50 DMA today for the buying to quickly show up in FCFS, which allowed this stock to erase a considerable early loss and actually close higher. This is a great example of the type of action one would typically expect to see in a healthy stock. It is considered a reassuring sign of institutional buying support.

Fresh Breakout's Volume Questionable - Friday, January 13, 2006
Often, when a leading stock is setting up to breakout of a solid base it is highlighted in CANSLIM.net's Mid-Day Breakouts Report. The most relevant factors are noted in the report which allows prudent CANSLIM oriented investors to place the issue in their watch list. After doing any necessary backup research, the investor is prepared to act if and when the stock triggers a technical buy signal (breaks above its pivot point on more than +50% above average turnover). In the event the stock fails to trigger a proper technical buy signal and its price declines then it will simply be removed from the watch list.
First Cash Financial Services Inc. (FCFS +$1.38 or +4.34% to $30.42) was first featured on December 23rd, 2005 in the CANSLIM.net Mid-Day Breakouts Report as this issue was setting up to potentially break out of its three month base (read here). After a few short weeks, the bulls have managed to send this issue out of its base and into new high territory. It was encouraging to see volume increase as this issue broke out on Friday, however it should be noted that the volume failed to meet the minimum guideline for a proper technical buy signal. The strong finish is likely to grab attention from investors as they conduct research over the weekend. To have confidence that a sustainable rally is at hand, watch for volume to provide confirmation that institutional demand is driving the gains. Great market winners do not usually tiptoe into new high ground, they blast off to new highs on very heavy volume, often several times the trading total for that issue an average day.
