50-Day Moving Average Line Acted as Resistance - Tuesday, April 13, 2021
Flagstar Bancorp Inc (FBC -$0.85 or -1.89% to $44.10) is still sputtering below its 50-day moving average (DMA) line ($45.63) which has acted as resistance in recent weeks. Near-term support to watch is prior lows. Its current Relative Strength Rating is 75, below the 80+ minimum guideline.
FBC produced a spurt of gains that triggered a technical buy signal after it was highlighted in yellow with pivot point cited based on its 1/26/21 high plus 10 cents in the 3/04/21 mid-day report (read here). It was last shown in this FSU section on 3/22/21 with an annotated graph under the headline, "Slumping Into Prior Base Following Breakout".
The high-ranked BANKING - Savings and Loans firm reported very strong quarterly earnings results through Dec '20 well above the +25% minimum (C criteria). Annual earnings history has been good. The number of top-rated funds that own its shares rose from 395 in Mar '20 to 442 in Dec '20, a reassuring sign concerning the I criteria. However, its current Up/Down Volume Ratio of 0.8 is an unbiased indication its shares have been under distributional pressure over the past 50 days.

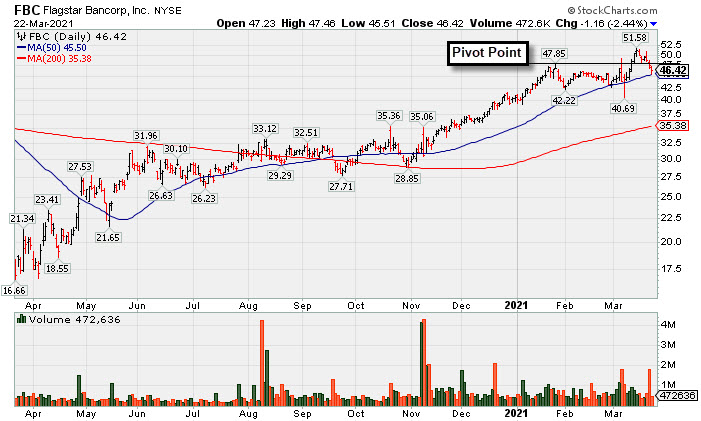
Slumping Into Prior Base Following Breakout - Monday, March 22, 2021
Flagstar Bancorp Inc (FBC $46.42 -$1.16 -2.44%) suffered a 3rd consecutive loss today, slumping below its pivot point and falling back further into the prior base, raising concerns. Its 50-day moving average (DMA) line ($45.54) define important near-term support to watch above prior lows on pullbacks.
FBC produced a spurt of gains that triggered a technical buy signal after it was highlighted in yellow with pivot point cited based on its 1/26/21 high plus 10 cents in the 3/04/21 mid-day report (read here). The FSU section included an annotated graph under the headline, "Negative Reversal When Poised For Technical Breakout".
The high-ranked BANKING - Savings and Loans firm reported very strong quarterly earnings results through Dec '20 well above the +25% minimum (C criteria). Annual earnings history has been good. The number of top-rated funds that own its shares rose from 395 in Mar '20 to 440 in Dec '20, a reassuring sign concerning the I criteria. Its current Up/Down Volume Ratio of 1.1 is an unbiased indication its shares have been under slight accumulation over the past 50 days.
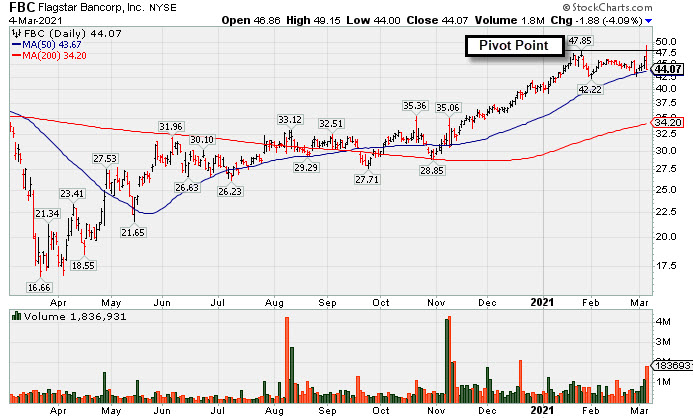
Negative Reversal When Poised For Technical Breakout - Thursday, March 4, 2021
Flagstar Bancorp Inc (FBC -$1.88 or -4.09% to $44.07) had a "negative reversal" today after highlighted in yellow with pivot point cited based on its 1/26/21 high plus 10 cents in the earlier mid-day report (read here). It recently found support at its 50-day moving average (DMA) line and rallied to hit a new 52-week high with today's early gain. It was noted - "A gain and strong close above the pivot point backed by at least +40% above average volume is needed to trigger a proper technical buy signal." However, the negative reversal was action indicative of distributional pressure, not institutional accumulation. Confirming gains are needed to clinch a convincing technical buy signal.
The high-ranked BANKING - Savings and Loans firm was noted in the 2/16/21 mid-day report - "Reported very strong quarterly earnings results through Dec '20 well above the +25% minimum (C criteria). Annual earnings history has been good." The number of top-rated funds that own its shares rose from 395 in Mar '20 to 440 in Dec '20, a reassuring sign concerning the I criteria. Its current Up/Down Volume Ratio of 1.2 is an unbiased indication its shares have been under accumulation over the past 50 days.
"