Rebounded Above "Max Buy" Level After Pullback Near 50 Day Average - Tuesday, April 21, 2015
Facebook Inc (FB +$0.53 or +0.64% to $83.62) has rebounded back above its "max buy" level after consolidating near support at its 50-day moving average (DMA) line ($80.25). Its Relative Strength rating is right at the 80+ minimum guideline for buy candidates. It was last shown in this FSU section on 3/31/15 with annotated graphs under the headline, "Pullback Near Previously Stubborn Resistance". It found support near previously stubborn resistance in the $81-82 area. A subsequent violation would raise concerns an trigger a technical sell signal.
It was highlighted in yellow while perched within close striking distance of its 52-week high in the 2/20/15 mid-day report (read here). With no resistance due to overhead supply it was noted - "Convincing volume-driven gains into new all-time high territory could mark the beginning of another meaningful leg up for this high-ranked Internet - Content firm."
Waning leadership (L criteria) in the Internet - Content industry group was noted as a concern and the group has a C- rating. Bullish action from at least one other company in the group provides some reassurance. The company reported earnings +69% on +49% sales revenues for the Dec '14 quarter. That marked its 7th consecutive quarterly comparison with earnings increasing well above the +25% minimum (C criteria).
Is current Up/Down Volume Ratio of 1.3 is an unbiased indication its shares have been under accumulation over the past 50 days. The high-ranked Internet - Content group leader has seen the number of top-rated funds owning its shares rise from 2,085 in Mar '14 to 2,584 in Mar '15, a reassuring sign concerning the I criteria. Keep in mind that its large supply of 2.21 billion shares in the public float makes it an unlikely sprinter, especially as it is already well known by the institutional crowd and the general public.


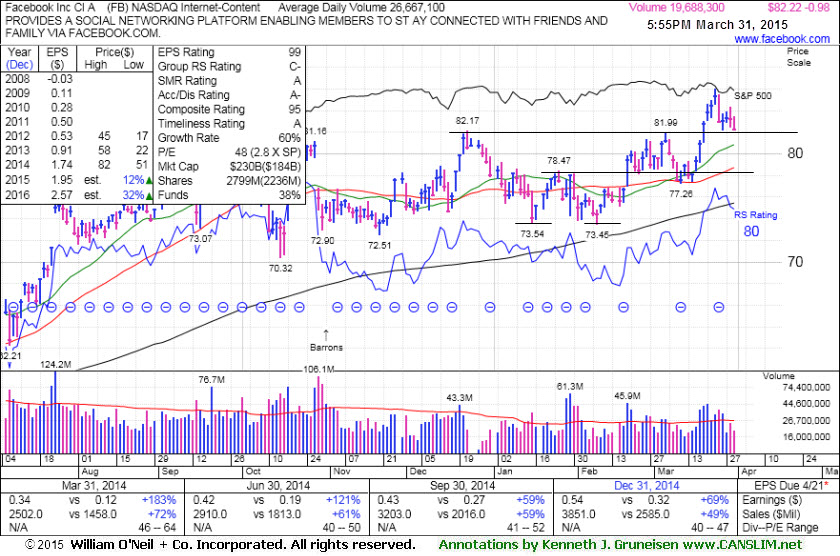
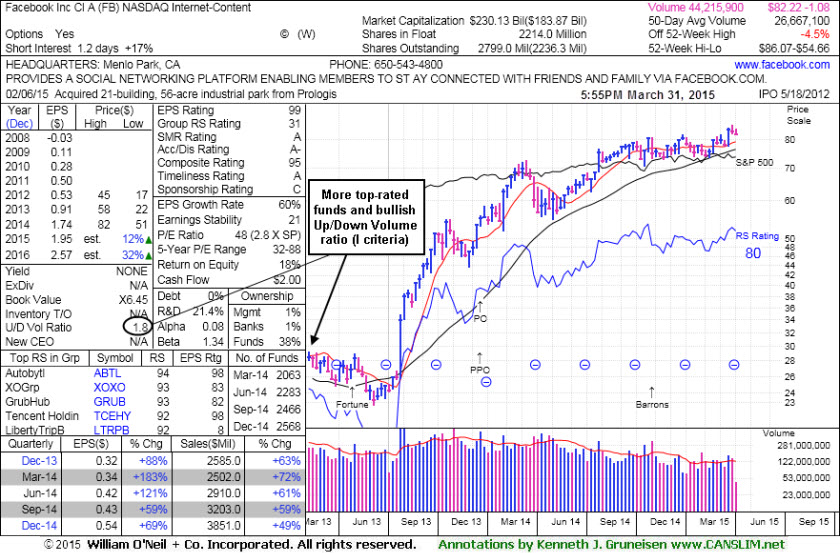
Pullback Near Previously Stubborn Resistance - Tuesday, March 31, 2015
Facebook Inc (FB -$0.98 or -1.18% to $82.22) is consolidating above previously stubborn resistance in the $81-82 area. It rallied to new 52 week highs with a streak of volume-driven gains since last shown in this FSU section on 3/11/15 with annotated graphs under the headline, "Relative Strength Rating Fell While Encountering Resistance". Its Relative Strength rating, at 80 now, is right at the 80+ minimum guideline for new buy candidates. Its Relative Strength line (blue jagged line) was plotted much higher in October of last year.
It was highlighted in yellow while perched within close striking distance of its 52-week high in the 2/20/15 mid-day report (read here). With no resistance due to overhead supply it was noted - "Convincing volume-driven gains into new all-time high territory could mark the beginning of another meaningful leg up for this high-ranked Internet - Content firm."
Waning leadership (L criteria) in the Internet - Content industry group was noted as a concern and the group has a C- rating. Bullish action from at least one other company in the group provides some reassurance. The company reported earnings +69% on +49% sales revenues for the Dec '14 quarter. That marked its 7th consecutive quarterly comparison with earnings increasing well above the +25% minimum (C criteria).
Is current Up/Down Volume Ratio of 1.8 is an unbiased indication its shares have been under accumulation over the past 50 days. The high-ranked Internet - Content group leader has seen the number of top-rated funds owning its shares rise from 2,085 in Mar '14 to 2,568 in Dec '14, a reassuring sign concerning the I criteria. Keep in mind that its large supply of 2.21 billion shares in the public float makes it an unlikely sprinter, especially as it is already well known by the institutional crowd and the general public.
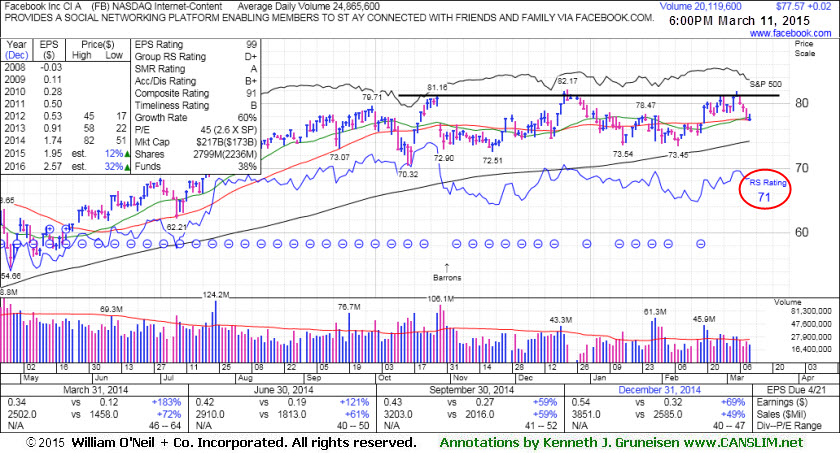
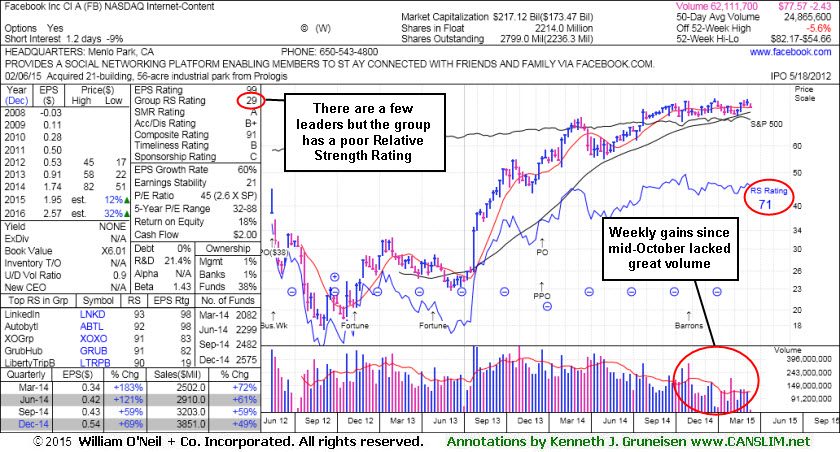
Relative Strength Rating Fell While Encountering Resistance - Wednesday, March 11, 2015
Facebook Inc (FB +$0.02 or +0.03% to $77.57) halted its slide with a very small gain on lighter volume today following 3 consecutive losses. It appears to be finding support near its 50-day moving average (DMA) line. However, it has met stubborn resistance in the $81-82 area, and while consolidating near it 52 week high it has made limited progress. Meanwhile, its Relative Strength rating, at 71 now, is below the 80+ minimum guideline for new buy candidates. Its Relative Strength line (blue jagged line) was also plotted much higher in October of last year.
It was last shown in this FSU section on 2/20/15 with annotated graphs under the headline, "Bullish Action While Tech Leader is Perched Near All-Time High", after highlighted in yellow while perched within close striking distance of its 52-week high in the earlier mid-day report (read here). It faces very little resistance due to overhead supply. Convincing volume-driven gains into new all-time high territory could mark the beginning of another meaningful leg up for this high-ranked Internet - Content firm.
Waning leadership (L criteria) in the Internet - Content industry group was noted as a concern and the group has a D+ rating. Bullish action from at least one other company in the group provides some reassurance. The company reported earnings +69% on +49% sales revenues for the Dec '14 quarter. That marked its 7th consecutive quarterly comparison with earnings increasing well above the +25% minimum (C criteria).
The high-ranked Internet - Content group leader has seen the number of top-rated funds owning its shares rise from 2,085 in Mar '14 to 2,575 in Dec '14, a reassuring sign concerning the I criteria. Keep in mind that its large supply of 2.21 billion shares in the public float makes it an unlikely sprinter, especially as it is already well known by the institutional crowd and the general public.
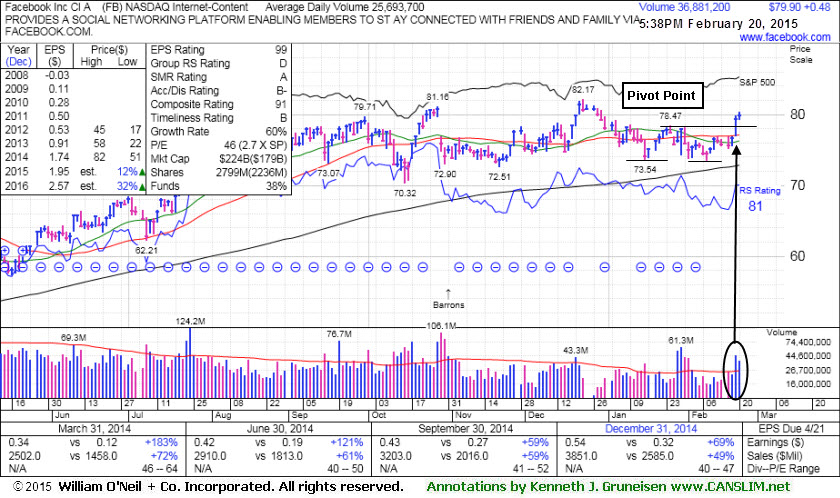
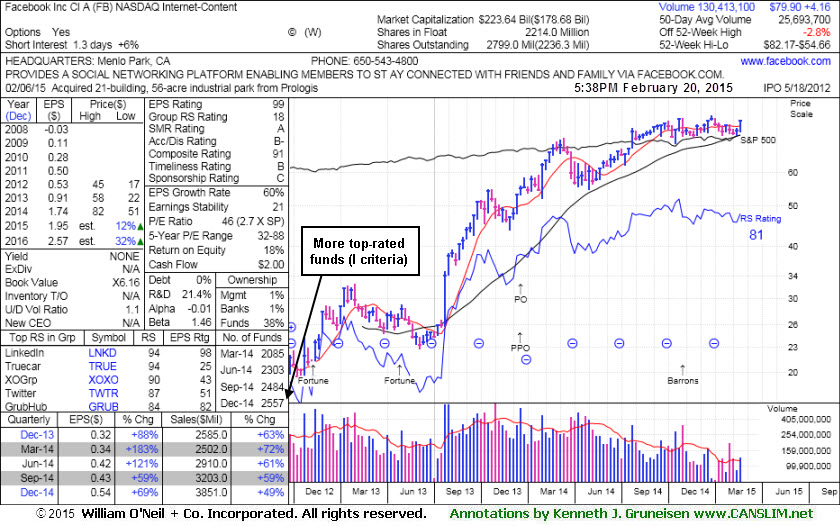
Bullish Action While Tech Leader is Perched Near All-Time High - Friday, February 20, 2015
Facebook Inc (FB +$0.48 or +0.60% to $79.90) was highlighted in yellow while perched within close striking distance of its 52-week high in the earlier mid-day report (read here). It faces very little resistance due to overhead supply up through the $82 level. It rallied well above its 50-day moving average (DMA) line with a big volume-driven gain on the prior session technically clearing a "double bottom" base. Convincing volume-driven gains into new all-time high territory could mark the beginning of another meaningful leg up for this high-ranked Internet - Content firm.
Its Relative Strength rating has improved to 81, just above the 80+ minimum guideline for buy candidates. It showed resilience since last shown in this FSU section on 1/30/15 with annotated graphs under the headline, "Weak Finish Below 50-Day Moving Average Line", while enduring distributional pressure. Waning leadership (L criteria) in the Internet - Content industry group was noted as a concern and the group still has a D rating. Bullish action from at least one other company in the group provides some reassurance.
The company reported earnings +69% on +49% sales revenues for the Dec '14 quarter. That marked its 7th consecutive quarterly comparison with earnings increasing well above the +25% minimum (C criteria). The high-ranked Internet - Content group leader has seen the number of top-rated funds owning its shares rise from 2,085 in Mar '14 to 2,557 in Dec '14, a reassuring sign concerning the I criteria. Keep in mind that its large supply of 2.21 billion shares in the public float makes it an unlikely sprinter, especially as it is already well known by the institutional crowd and the general public.
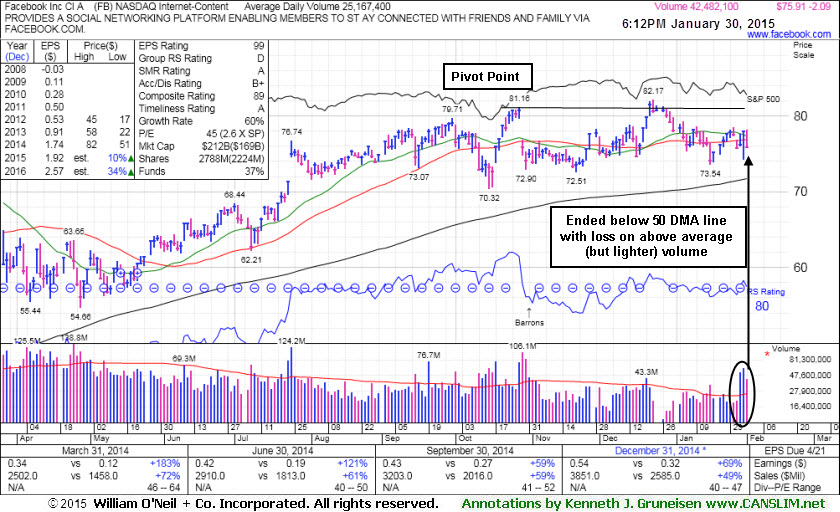
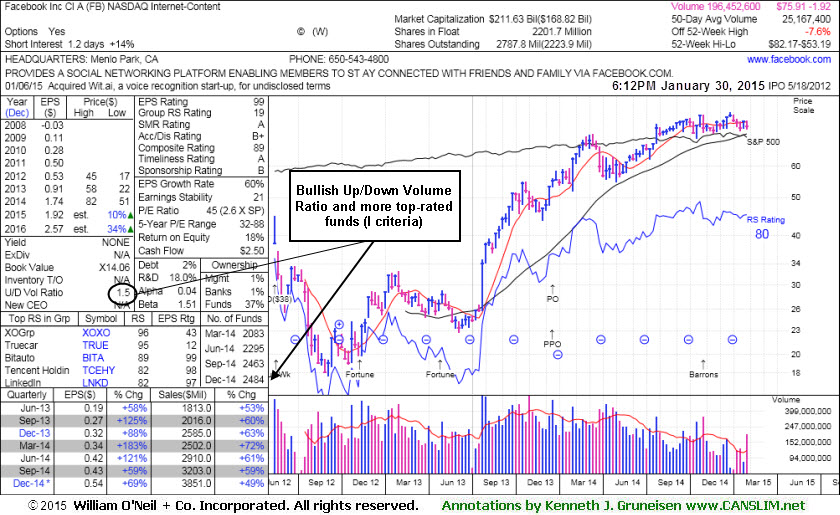
Weak Finish Below 50-Day Moving Average Line - Friday, January 30, 2015
Facebook Inc (FB -$2.09 or -2.68% to $75.91) churned above average volume this week and finished below its 50-day moving average (DMA) line, not making meaningful price progress - a sign of distributional pressure. It faces resistance due to overhead supply up through the $82 level. Waning leadership (L criteria) in the Internet - Content industry group was noted as a concern and the group now has a D rating. firm was last shown in this FSU section on 1/12/15 with annotated graphs under the headline, "Consolidating Near 50-Day Average After Stalling at 52-Week High". And convincing volume-driven gains above the pivot point are still needed to clinch a proper new (or add-on) technical buy signal. The high-ranked Internet - Content firm was last shown in this FSU section on 12/04/14 with annotated graphs under the headline, "Gains for New Highs Backed By Lighter Volume", as it finished at a new all-time high with a gain on lighter volume. Members were then reminded - "Gains above a pivot point should be backed by a minimum of +40% above average volume to trigger a proper technical buy signal. A new pivot point was cited based on its 10/28/14 high plus 10 cents. No resistance remains due to overhead supply." Disciplined investors wait for fresh proof of heavy institutional buying demand, then buy stocks that are breaking out before they have risen more than +5% above their pivot point.The company reported earnings +59% on +59% sales revenues for the Sep '14 quarter but warned of rising costs. That marked its 6th consecutive quarterly comparison with earnings increasing well above the +25% minimum (C criteria). Its Up/Down Volume ration of 1.5 is an unbiased indication its shares have been under accumulation over the past 50 days. The high-ranked Internet - Content group leader has seen the number of top-rated funds owning its shares rise from 1,116 in Dec '12 to 2,484 in Dec '14, a reassuring sign concerning the I criteria. Members were previously warned - "Keep in mind that its large supply of 2.54 billion shares in the public float makes it an unlikely sprinter, especially as it is already well known by the institutional crowd and the general public."
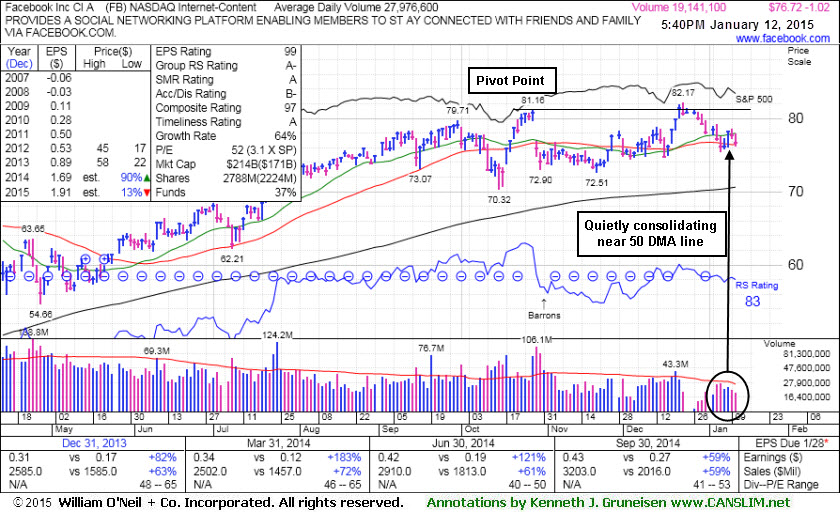
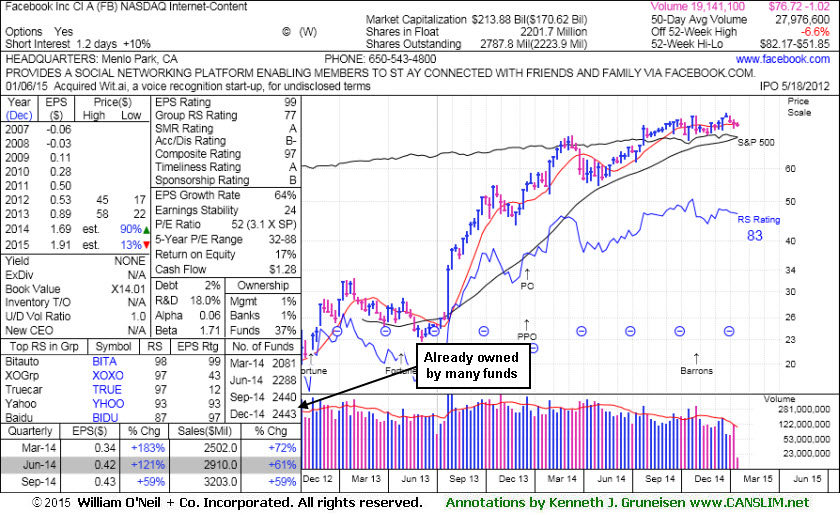
Consolidating Near 50-Day Average After Stalling at 52-Week High - Monday, January 12, 2015
Facebook Inc (FB -$1.02 or -1.31% to $76.72) halted its slide after quietly retreating near its 50-day moving average (DMA) line. Now resistance remains due to overhead supply up through the $82 level. And convincing volume-driven gains above the pivot point are still needed to clinch a proper new (or add-on) technical buy signal. The high-ranked Internet - Content firm was last shown in this FSU section on 12/04/14 with annotated graphs under the headline, "Gains for New Highs Backed By Lighter Volume", as it finished at a new all-time high with a gain on lighter volume. Members were then reminded - "Gains above a pivot point should be backed by a minimum of +40% above average volume to trigger a proper technical buy signal. A new pivot point was cited based on its 10/28/14 high plus 10 cents. No resistance remains due to overhead supply." Disciplined investors wait for fresh proof of heavy institutional buying demand, then buy stocks that are breaking out before they have risen more than +5% above their pivot point.The company reported earnings +59% on +59% sales revenues for the Sep '14 quarter but warned of rising costs. That marked its 6th consecutive quarterly comparison with earnings increasing well above the +25% minimum (C criteria). The high-ranked Internet - Content group leader has seen the number of top-rated funds owning its shares rise from 1,116 in Dec '12 to 2,443 in Dec '14, a reassuring sign concerning the I criteria. Members were previously warned - "Keep in mind that its large supply of 2.54 billion shares in the public float makes it an unlikely sprinter, especially as it is already well known by the institutional crowd and the general public."
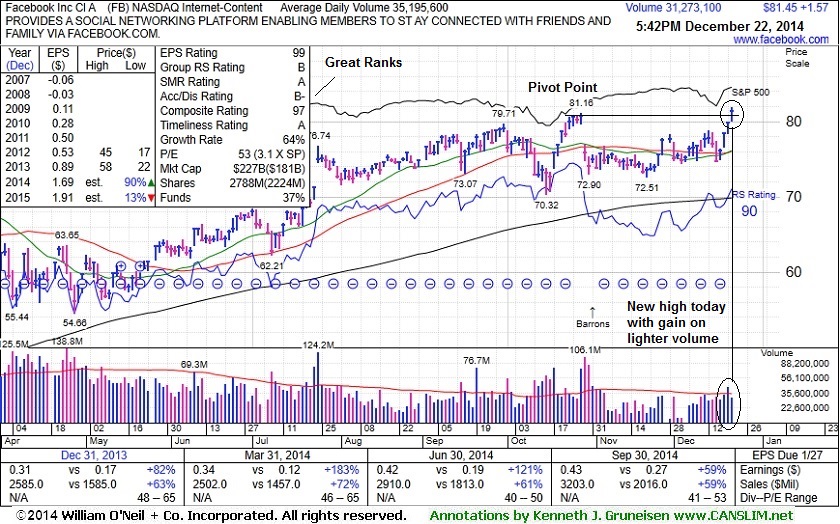
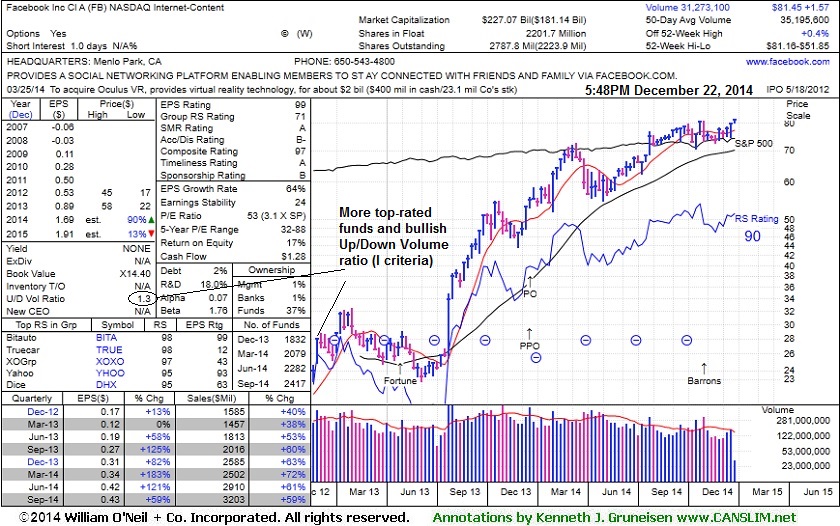
Gains for New Highs Backed By Lighter Volume - Monday, December 22, 2014
Facebook Inc (FB +$1.57 or +1.97% to $81.45) finished at a new all-time high with today's gain on lighter volume. Gains above a pivot point should be backed by a minimum of +40% above average volume to trigger a proper technical buy signal. A new pivot point was cited based on its 10/28/14 high plus 10 cents. No resistance remains due to overhead supply. The broader market averages (M criteria) also hit new highs on Monday helping to confirm that the major averages are in a confirmed uptrend. Disciplined investors avoid chasing stocks more than +5% above their pivot point and always limit losses by selling any stock that falls more than -7% from their purchase price.
The high-ranked Internet - Content firm was last shown in this FSU section on 12/04/14 with annotated graphs under the headline, "Gains Above 50-Day Moving Average Needed for Outlook to Improve". The company reported earnings +59% on +59% sales revenues for the Sep '14 quarter but warned of rising costs. That marked its 6th consecutive quarterly comparison with earnings increasing well above the +25% minimum (C criteria). Its current Up/Down Volume Ratio of 1.3 is still an unbiased indication its shares have been under some accumulation over the past 50 days. The high-ranked Internet - Content group leader has seen the number of top-rated funds owning its shares rise from 1,116 in Dec '12 to 2,417 in Sep '14, a reassuring sign concerning the I criteria. Members were previously warned - "Keep in mind that its large supply of 2.54 billion shares in the public float makes it an unlikely sprinter, especially as it is already well known by the institutional crowd and the general public."
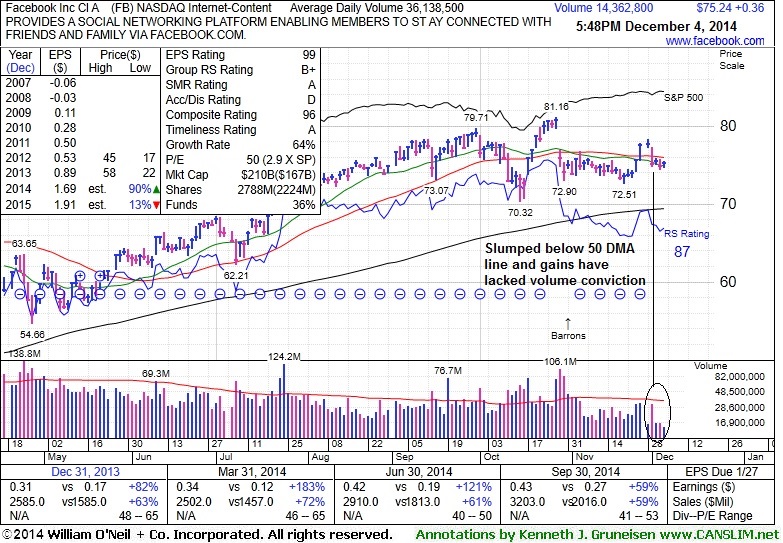
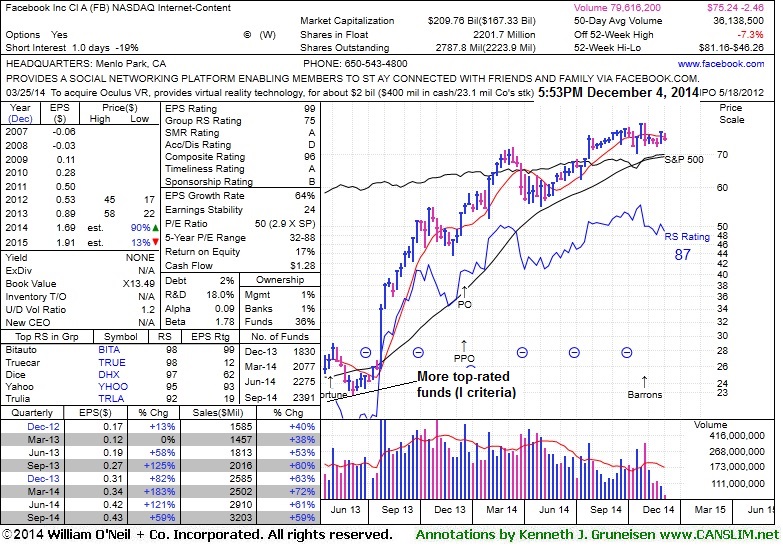
Gains Above 50-Day Moving Average Needed for Outlook to Improve - Thursday, December 04, 2014
Facebook Inc (FB +$0.36 or +0.48% to $75.24) has recently been slumping back below its 50-day moving average (DMA) line, hurting its technical stance and near-term outlook. Recent gains have lacked volume conviction. A rebound above the 50 DMA line is needed for its outlook to improve. The high-ranked Internet - Content firm was last shown in this FSU section on 11/14/14 with annotated graphs under the headline, "Following Violation 50-Day Average Acted as Resistance". A violation on 3 times average volume on 10/29/14 raised concerns and triggered a technical sell signal. Disciplined investors avoid chasing stocks more than +5% above their pivot point and always limit losses by selling any stock that falls more than -7% from their purchase price.
The company reported earnings +59% on +59% sales revenues for the Sep '14 quarter but warned of rising costs. That marked its 6th consecutive quarterly comparison with earnings increasing well above the +25% minimum (C criteria). Its current Up/Down Volume Ratio of 1.2 is still an unbiased indication its shares have been under some accumulation over the past 50 days. The high-ranked Internet - Content group leader has seen the number of top-rated funds owning its shares rise from 1,116 in Dec '12 to 2,391 in Sep '14, a reassuring sign concerning the I criteria. Members were previously warned - "Keep in mind that its large supply of 2.54 billion shares in the public float makes it an unlikely sprinter, especially as it is already well known by the institutional crowd and the general public."
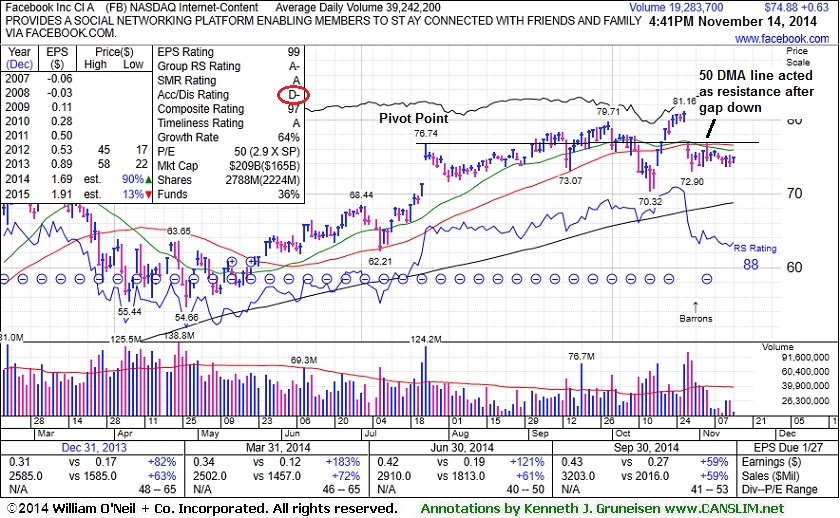
Following Violation 50-Day Average Acted as Resistance - Friday, November 14, 2014
Facebook Inc (FB +$0.63 or +0.85% to $74.88) encountered resistance at its 50-day moving average (DMA) line following a violation on 3 times average volume on 10/29/14 that raised concerns and triggered a technical sell signal. Recent gains have lacked volume conviction. A rebound above the 50 DMA line is needed for its outlook to improve.
The high-ranked Internet - Content firm was last shown in this FSU section on 10/29/14 with annotated graphs under the headline, "Gapped Down Following Latest Strong Earnings Report". The company reported earnings +59% on +59% sales revenues for the Sep '14 quarter but warned of rising costs. That marked its 6th consecutive quarterly comparison with earnings increasing well above the +25% minimum (C criteria).
Disciplined investors avoid chasing stocks more than +5% above their pivot point and always limit losses by selling any stock that falls more than -7% from their purchase price. Its current Up/Down Volume Ratio of 1.3 is still an unbiased indication its shares have been under accumulation over the past 50 days. The high-ranked Internet - Content group leader has seen the number of top-rated funds owning its shares rise from 1,116 in Dec '12 to 2,315 in Sep '14, a reassuring sign concerning the I criteria. Members were previously warned - "Keep in mind that its large supply of 2.54 billion shares in the public float makes it an unlikely sprinter, especially as it is already well known by the institutional crowd and the general public."
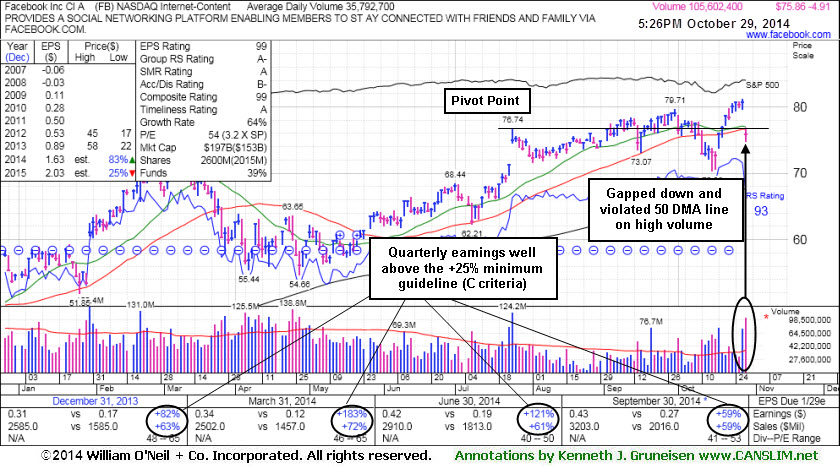
Gapped Down Following Latest Strong Earnings Report - Wednesday, October 29, 2014
Facebook Inc (FB -$4.91 or -6.08% to $75.86) gapped down for a loss today with 3 times average volume and violated its 50-day moving average (DMA) line raising concerns and triggering a technical sell signal. Volume and volatility often increase near earnings news. The company reported earnings +59% on +59% sales revenues for the Sep '14 quarter but warned of rising costs. That marked its 6th consecutive quarterly comparison with earnings increasing well above the +25% minimum (C criteria).
Keep in mind that historic studies show that investors have a far better chance of success when buying as a stock is breaking out, not buying on pullbacks. Disciplined investors avoid chasing stocks more than +5% above their pivot point and always limit losses by selling any stock that falls more than -7% from their purchase price.
The high-ranked Internet - Content firm was last shown in this FSU section on 10/16/14 with annotated graphs under the headline, "Volume-Driven Losses Triggered Sell Signals After Slumping Into Prior Base". A subsequent rebound above the 50 DMA line helped its outlook to improve. Its current Up/Down Volume Ratio of 1.6 is still an unbiased indication its shares have been under accumulation over the past 50 days.
The high-ranked Internet - Content group leader has seen the number of top-rated funds owning its shares rise from 1,116 in Dec '12 to 2,309 in Sep '14, a reassuring sign concerning the I criteria. Members were previously warned - "Keep in mind that its large supply of 2.54 billion shares in the public float makes it an unlikely sprinter, especially as it is already well known by the institutional crowd and the general public."
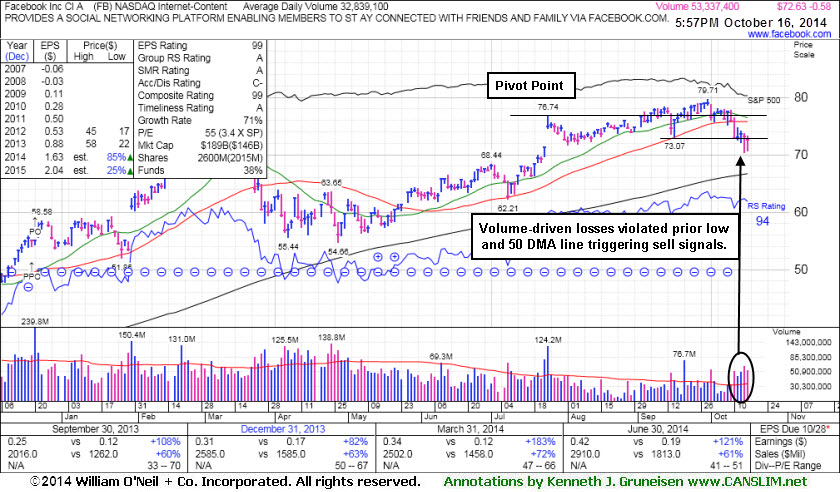
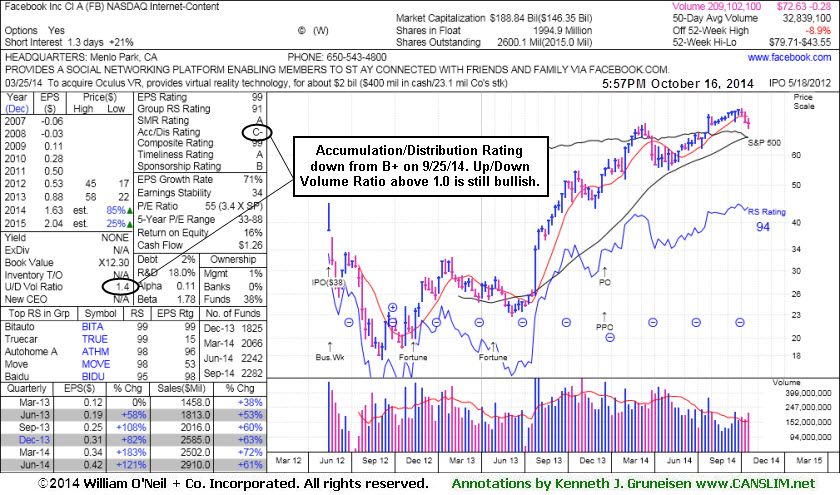
Volume-Driven Losses Triggered Sell Signals After Slumping Into Prior Base - Thursday, October 16, 2014
Facebook Inc (FB -$0.58 or -0.79% to $72.63) recently slumped back into its prior base and retreated below its 50-day moving average (DMA) line and its prior low ($73.07 on 9/16/14) with volume-driven losses raising concerns and triggering technical sell signals. A rebound above the 50 DMA line is needed for its outlook to improve. Disciplined investors always limit losses by selling any stocks that fall more than -7% from their purchase price. Its Accumulation/Distribution Rating fell from a B+ to a C- since last shown in this FSU section on 9/25/14 with annotated graphs under the headline, "Fell Toward 50-day Moving Average; Recent Gains Lacked Great Volume". However, its current Up/Down Volume Ratio of 1.4 is still an unbiased indication its shares have been under accumulation over the past 50 days.
It reported earnings +121% on +61% sales revenues for the Jun '14 quarter, its 5th consecutive quarterly comparison with earnings increasing well above the +25% minimum (C criteria). The high-ranked Internet - Content group leader has seen the number of top-rated funds owning its shares rise from 1,116 in Dec '12 to 2,282 in Sep '14, a reassuring sign concerning the I criteria. Members were previously warned - "Keep in mind that its large supply of 2.54 billion shares in the public float makes it an unlikely sprinter, especially as it is already well known by the institutional crowd and the general public."
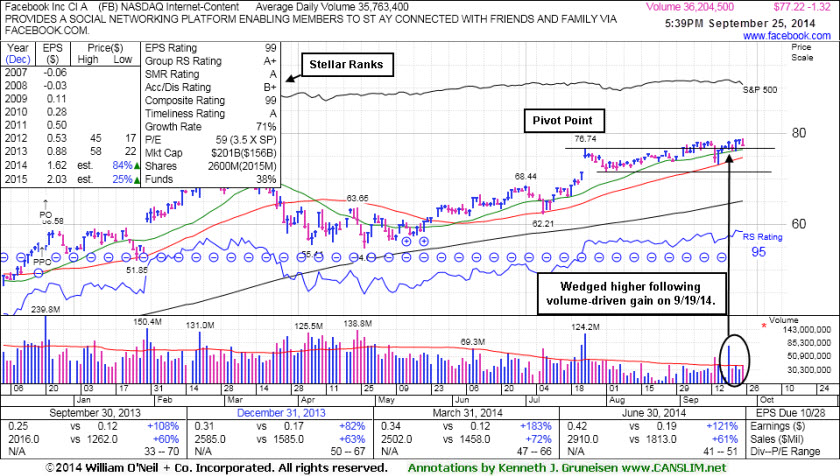
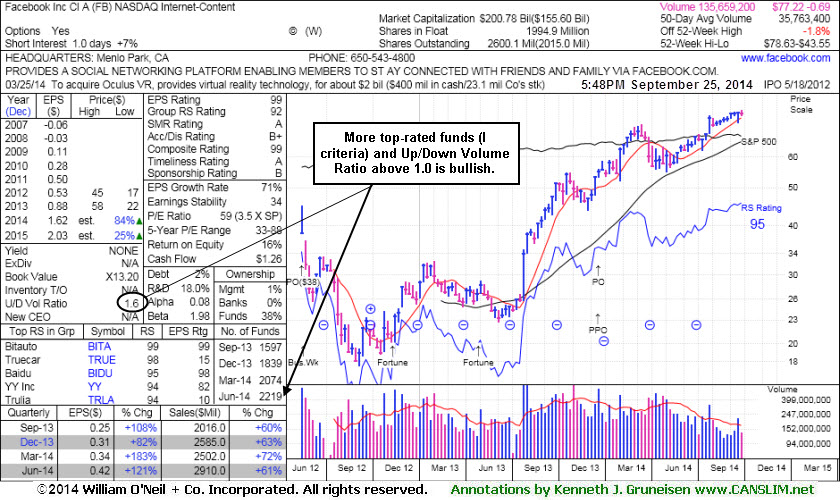
Fell Toward 50-day Moving Average; Recent Gains Lacked Great Volume - Thursday, September 25, 2014
Facebook Inc (FB -$1.32 or -1.67% to $77.22) fell with higher (near average) volume today. It recently wedged higher with gains lacking great volume conviction since the big volume-driven gain on 9/19/14 helped confirm a new (or add-on) technical buy signal. Its 50-day moving average (DMA) line ($74.60) defines important near-term support to watch on pullbacks where a violation would trigger a technical sell signal. It was last shown in this FSU section on 9/09/14 with annotated graphs under the headline, "Wedging Gains Not Indicative of Institutional Conviction". Disciplined investors always limit losses by selling any stock that falls more than -7% from their purchase price.
It reported earnings +121% on +61% sales revenues for the Jun '14 quarter, its 5th consecutive quarterly comparison with earnings increasing well above the +25% minimum (C criteria). Its current Up/Down Volume Ratio of 1.6 is an unbiased bullish indication its shares have been under accumulation over the past 50 days. The high-ranked Internet - Content group leader has seen the number of top-rated funds owning its shares rise from 1,116 in Dec '12 to 2,219 in Jun '14, a reassuring sign concerning the I criteria. However, members were previously warned - "Keep in mind that its large supply of 2.54 billion shares in the public float makes it an unlikely sprinter, especially as it is already well known by the institutional crowd and the general public."
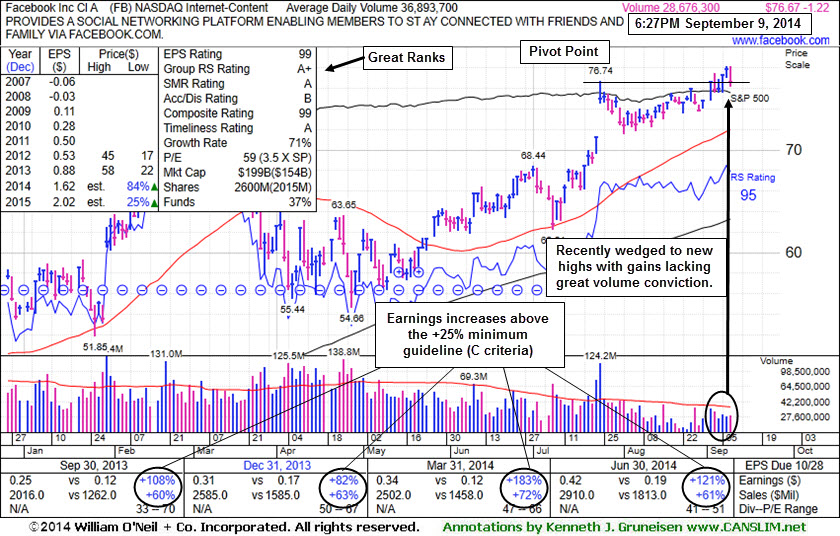
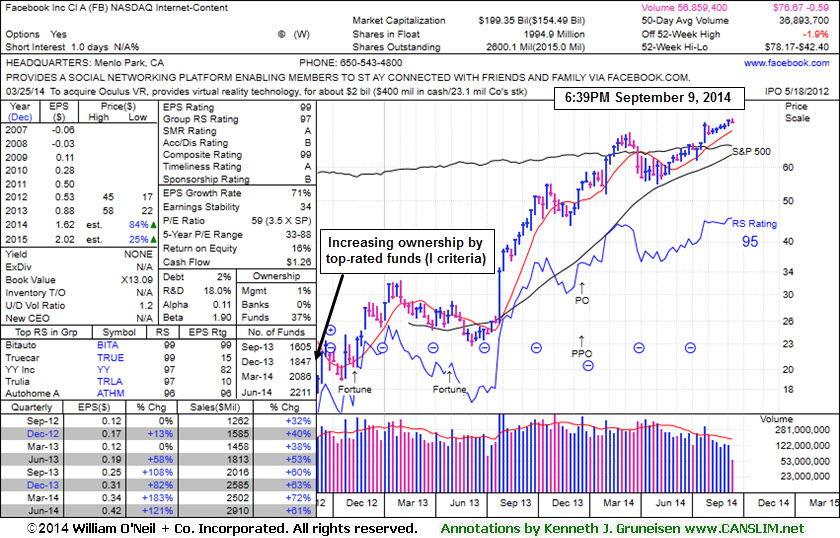
Wedging Gains Not Indicative of Institutional Conviction - Tuesday, September 09, 2014
Facebook Inc (FB -$1.22 or -1.57% to $76.67) volume totals have been below average while wedging to new 52-week highs. A new pivot point is cited based on its 7/24/14 high plus 10 cents. Keep in mind that gains above a stock's pivot point should be backed by at least +40% above average volume to trigger a proper technical buy signal. Without significant volume behind gains for new highs there is little reason to believe that the kind of meaningful buying demand from the institutional crowd is lurking which can lead to a significant advance in price.
It has stubbornly held its ground since gapping up on 7/24/14. Recent lows near $72 area define initial support coinciding with its 50-day moving average DMA line ($71.99). Facebook was last shown in this FSU section on 8/20/14 with annotated graphs under the headline, " Making Limited Headway But Holding Ground Since Gap Up".
It reported earnings +121% on +61% sales revenues for the Jun '14 quarter, its 5th consecutive quarterly comparison with earnings increasing well above the +25% minimum (C criteria). It stayed well above its 200 DMA line during its consolidation after dropped from the Featured Stocks list on 4/04/14 due to weakness. Members were reminded - "Remember that any stock that is sold can always be bought back again later if strength returns."
Its current Up/Down Volume Ratio of 1.2 is an unbiased bullish indication its shares have been under accumulation over the past 50 days. The high-ranked Internet - Content group leader has seen the number of top-rated funds owning its shares rise from 1,116 in Dec '12 to 2,211 in Jun '14, a reassuring sign concerning the I criteria. However, members were previously warned - "Keep in mind that its large supply of 2.54 billion shares in the public float makes it an unlikely sprinter, especially as it is already well known by the institutional crowd and the general public."
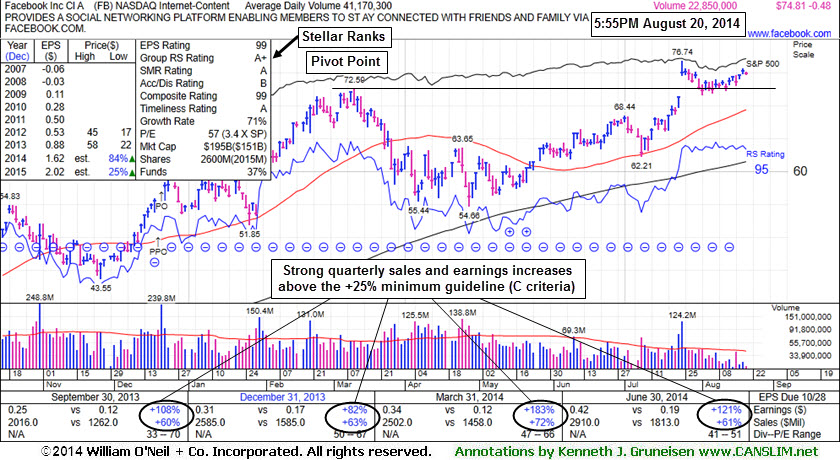
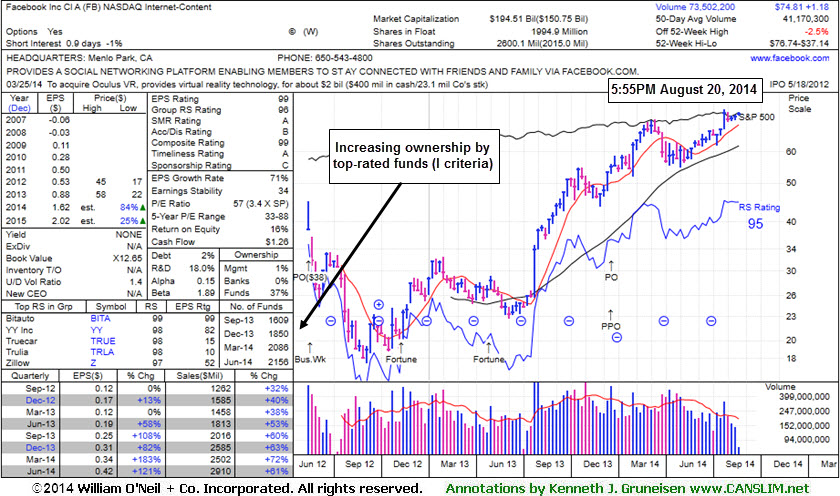
Making Limited Headway But Holding Ground Since Gap Up - Wednesday, August 20, 2014
Facebook Inc (FB -$0.48 or -0.64% to $74.81) volume totals have generally been cooling in recent weeks while consolidating near its pivot point and near its 52-week high. It has stubbornly held its ground since gapping up on 7/24/14. Prior highs in the $72 area define initial support above its 50-day moving average DMA line ($69.33).
Facebook has made limited headway since last shown in this FSU section on 7/24/14 with annotated graphs under the headline, "Breakaway Gap May Signal Beginning of Meaningful Rally", after highlighted in yellow with pivot point cited based on its 3/11/14 high plus 10 cents in the 7/24/14 breakouts report (read here). The "breakaway gap" with nearly 3 times average volume triggered a technical buy signal after reporting earnings +121% on +61% sales revenues for the Jun '14 quarter, its 5th consecutive quarterly comparison with earnings increasing well above the +25% minimum (C criteria).
It stayed well above its 200 DMA line during its consolidation after dropped from the Featured Stocks list on 4/04/14 due to weakness. Members were reminded - "Remember that any stock that is sold can always be bought back again later if strength returns."
Its current Up/Down Volume Ratio of 1.4 is an unbiased bullish indication its shares have been under accumulation over the past 50 days. The high-ranked Internet - Content group leader has seen the number of top-rated funds owning its shares rise from 1,116 in Dec '12 to 2,156 in Jun '14, a reassuring sign concerning the I criteria. However, members were previously warned - "Keep in mind that its large supply of 2.54 billion shares in the public float makes it an unlikely sprinter, especially as it is already well known by the institutional crowd and the general public."
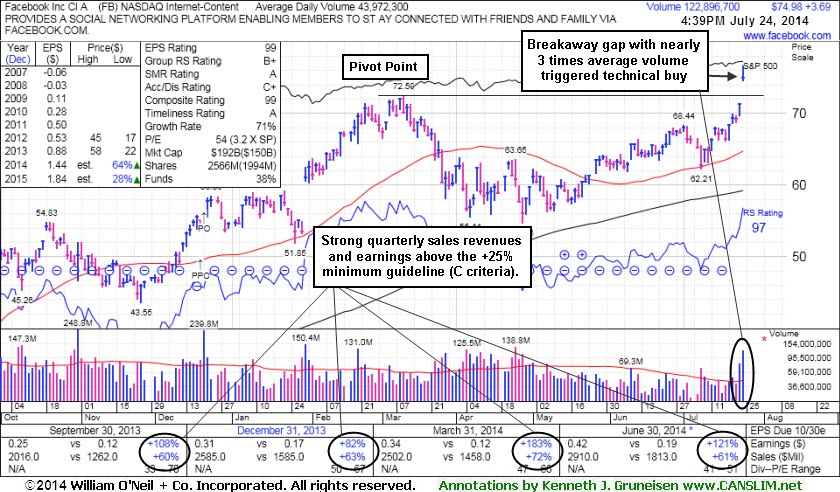
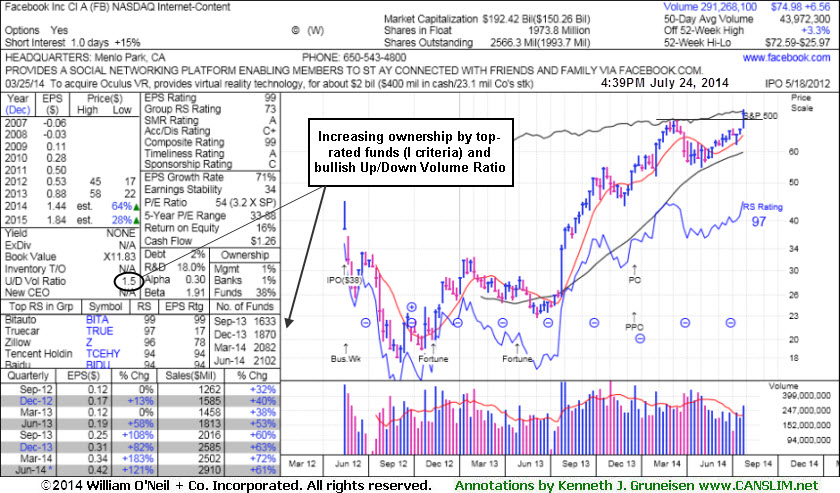
Breakaway Gap May Signal Beginning of Meaningful Rally - Thursday, July 24, 2014
Facebook Inc (FB +$3.69 or +5.18% to $74.98) was highlighted in yellow with pivot point cited based on its 3/11/14 high plus 10 cents in the earlier breakouts report (read here). The "breakaway gap" with nearly 3 times average volume triggered a technical buy signal after reporting earnings +121% on +61% sales revenues for the Jun '14 quarter, its 5th consecutive quarterly comparison with earnings increasing well above the +25% minimum (C criteria). It found support at its 50-day moving average (DMA) line during its latest consolidation.
Facebook was last shown in this FSU section on 4/04/14 with annotated graphs under the headline, "Facebook Unfriended After Technical Weakness (See More Comments)". At the time it was triggering a more worrisome technical sell signal, slumping below prior highs in the $58 area. It stayed well above its 200 DMA line during its consolidation after dropped from the Featured Stocks list on 4/04/14 due to weakness. Members were reminded - "Remember that any stock that is sold can always be bought back again later if strength returns."
Its current Up/Down Volume Ratio of 1.5 is an unbiased bullish indication its shares have been under accumulation over the past 50 days. The high-ranked Internet - Content group leader has seen the number of top-rated funds owning its shares rise from 1,116 in Dec '12 to 2,102 in Jun '14, a reassuring sign concerning the I criteria. However, members were previously warned - "Keep in mind that its large supply of 2.54 billion shares in the public float makes it an unlikely sprinter, especially as it is already well known by the institutional crowd and the general public."
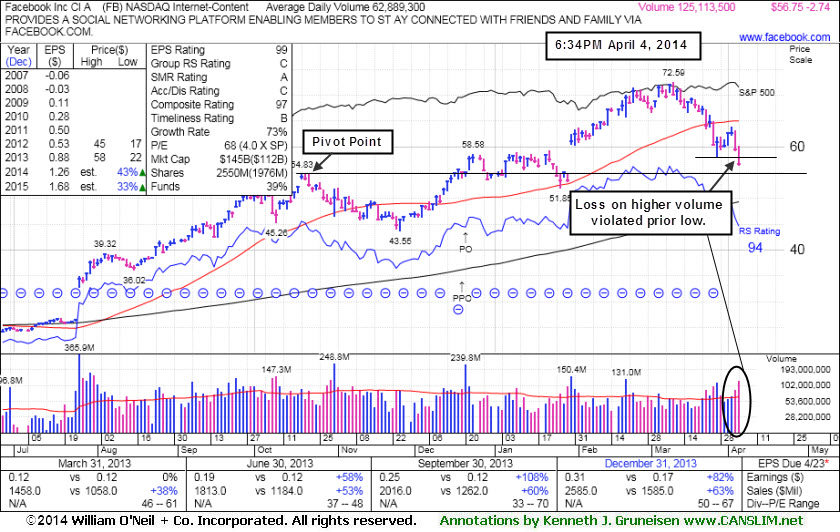
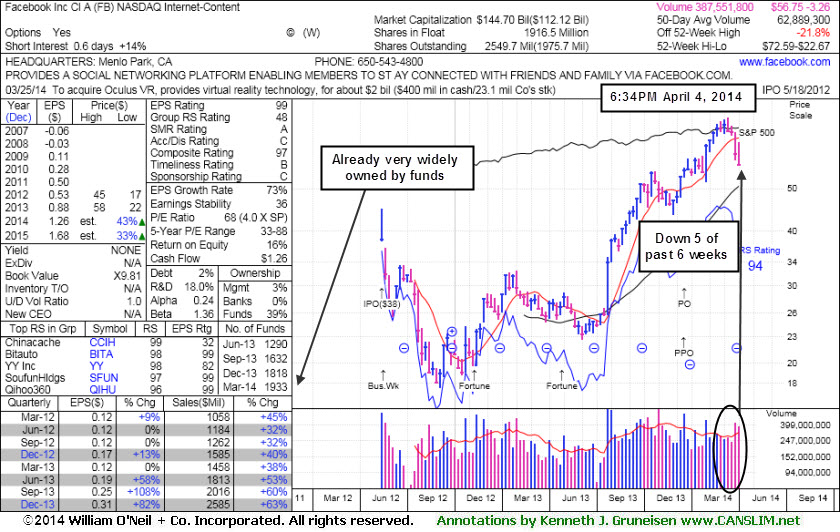
Facebook Unfriended After Technical Weakness (See More Comments) - Friday, April 04, 2014
Facebook Inc (FB -$2.74 or -4.61% to $56.75) triggering a more worrisome technical sell signal today while violating the recent low ($57.98 on 3/27/14) and slumping below prior highs in the $58 area defining important near-term support. The annotated weekly graph shows it down in 5 of the past 6 weeks and with above average volume behind the two latest weekly losses. It has slumped -21.8% off its high and it will be dropped from the Featured Stocks list tonight due to weakness. Remember that any stock that is sold can always be bought back again later if strength returns.Facebook was last shown in this FSU section on 3/28/14 with annotated graphs under the headline, "50-Day Moving Average Violation Triggered Technical Sell Signal", after damaging losses raised concerns. Members were reminded - "Only a prompt rebound above that important short term average would help its outlook improve. It traded up as much as +41.2% since shown in the 12/12/13 mid-day report (read here) first highlighted in yellow at $51.40 with a pivot point cited based on its 10/18/13 high plus 10 cents."
Its fundamentals remain strong as the high-ranked Internet - Content group leader reported earnings +82% on +63% sales revenues for the Dec '13 quarter, its 3rd consecutive quarterly comparison with earnings increasing well above the +25% minimum (C criteria). The number of top-rated funds owning its shares rose from 1,116 in Dec '12 to 1,933 in Dec '13, a reassuring sign concerning the I criteria. However, members were previously warned - "Keep in mind that its large supply of 2.54 billion shares in the public float makes it an unlikely sprinter, especially as it is already well known by the institutional crowd and the general public."
50-Day Moving Average Violation Triggered Technical Sell Signal - Friday, March 28, 2014
Facebook Inc (FB -$0.96 or -1.57% to $60.01) violated its 50-day moving average (DMA) line this week with damaging losses raising concerns and triggering a technical sell signal. Only a prompt rebound above that important short term average would help its outlook improve. It traded up as much as +41.2% since shown in the 12/12/13 mid-day report (read here) first highlighted in yellow at $51.40 with a pivot point cited based on its 10/18/13 high plus 10 cents.The high-ranked Internet - Content group leader rallied from a 9-week cup shaped base without a handle after completing a Public Offering on 12/20/13. It was last shown in this FSU section on 3/14/14 with annotated graphs under the headline, "Pulling Back After Getting Extended From Prior Base". It reported earnings +82% on +63% sales revenues for the Dec '13 quarter, marking its 3rd quarterly comparison with earnings above the +25% minimum (C criteria). Sequential acceleration in quarterly sales and strong earnings increases helps it look like a better match with the fact-based investment system's winning models.
The number of top-rated funds owning its shares rose from 1,116 in Dec '12 to 1,812 in Dec '13, a reassuring sign concerning the I criteria. Keep in mind that its large supply of 2.54 billion shares in the public float makes it an unlikely sprinter, especially as it is already well known by the institutional crowd and the general public.


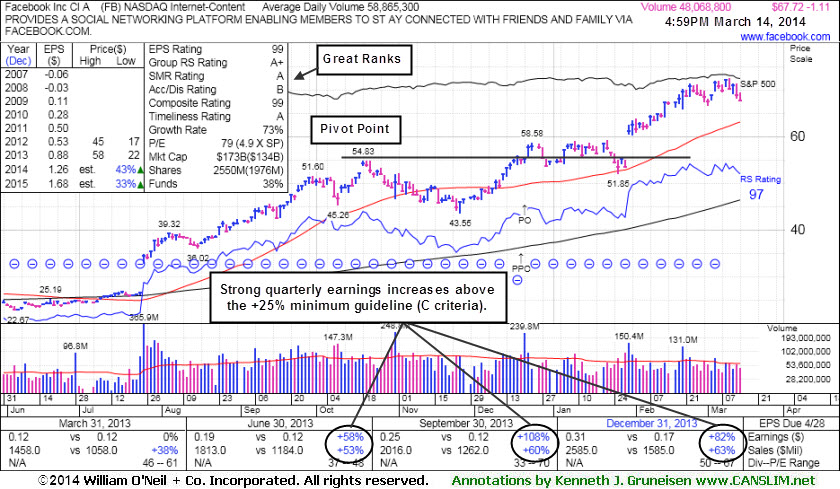
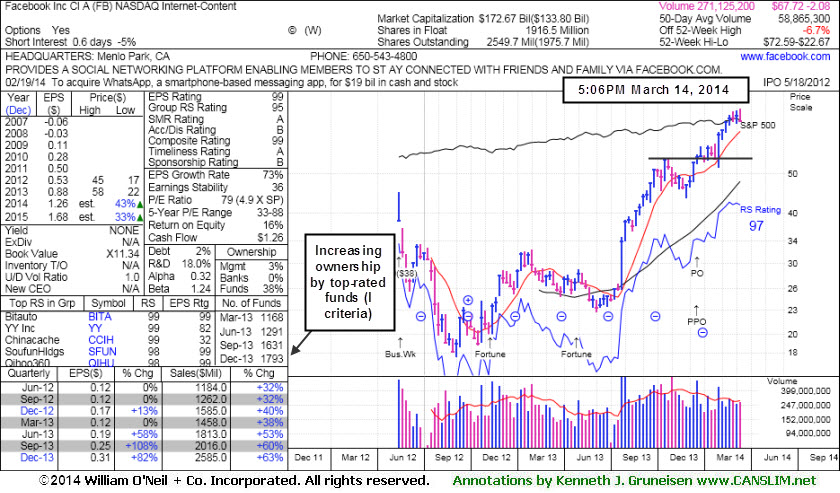
Pulling Back After Getting Extended From Prior Base - Friday, March 14, 2014
Facebook Inc (FB -$1.11 or -1.61% to $67.72) has been pulling back after getting very extended from any sound base. Its 50-day moving average (DMA) line ($63) defines near-term support to watch. FB was last shown in this FSU section on 2/25/14 with annotated graphs under the headline, "High-Ranked Internet Group Leader is Extended From Base", trading well beyond the "secondary buy point" previously noted. Disciplined investors avoid chasing extended stocks.
It reported earnings +82% on +63% sales revenues for the Dec '13 quarter, marking its 3rd quarterly comparison with earnings above the +25% minimum (C criteria). Sequential acceleration in quarterly sales and strong earnings increases helps it look like a better match with the fact-based investment system's winning models.
The high-ranked Internet - Content group leader rallied from a 9-week cup shaped base without a handle after completing a Public Offering on 12/20/13. The 12/12/13 mid-day report (read here) first highlighted the stock in yellow with a pivot point cited based on its 10/18/13 high plus 10 cents.
The number of top-rated funds owning its shares rose from 1,116 in Dec '12 to 1,793 in Dec '13, a reassuring sign concerning the I criteria. Keep in mind that its large supply of 2.54 billion shares in the public float makes it an unlikely sprinter, especially as it is already well known by the institutional crowd and the general public.
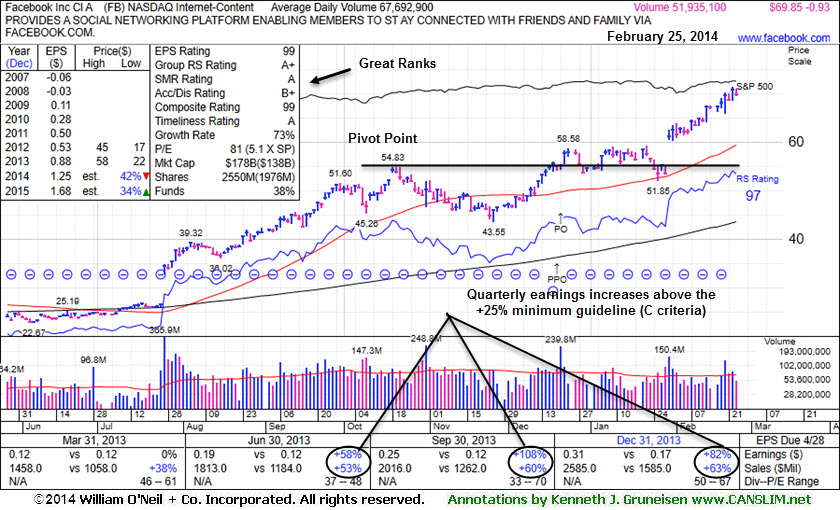
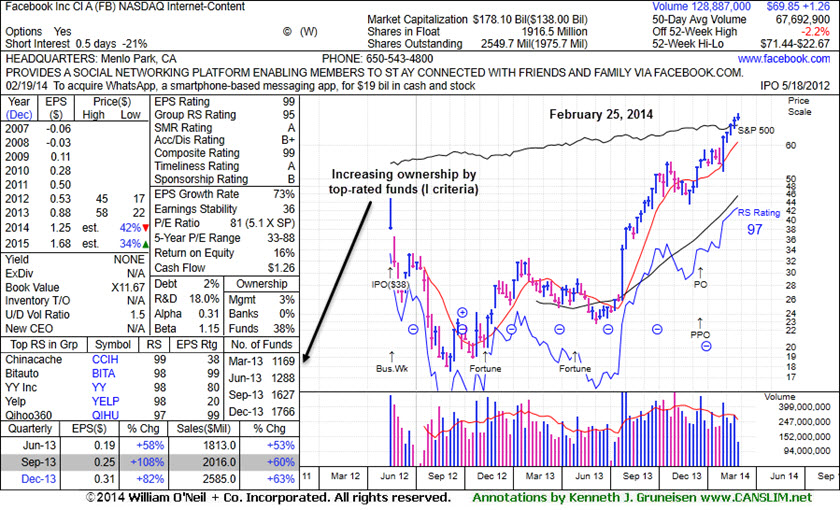
High-Ranked Internet Group Leader is Extended From Base - Tuesday, February 25, 2014
Facebook Inc (FB -$0.93 or -1.31% to $69.85) is perched at its all-time high, very extended from any sound base and well beyond the "secondary buy point" previously noted. Prior highs and its 50-day moving average (DMA) line coincide near $58 defining very important near-term support to watch on pullbacks. Disciplined investors avoid chasing extended stocks.Since FB was last shown in this FSU section on 2/06/14 with annotated graphs under the headline, "Volume Totals Cooling While Holding Ground at Highs", additional volume-driven gains lifted it to new all-time highs. It reported earnings +82% on +63% sales revenues for the Dec '13 quarter, marking its 3rd quarterly comparison with earnings above the +25% minimum (C criteria). Sequential acceleration in quarterly sales and strong earnings increases helps it look like a better match with the fact-based investment system's winning models.
The high-ranked Internet - Content group leader found support at its 50-day moving average (DMA) line during its latest consolidation. It rallied from a 9-week cup shaped base without a handle after completing a Public Offering on 12/20/13. The 12/12/13 mid-day report (read here) first highlighted the stock in yellow with a pivot point cited based on its 10/18/13 high plus 10 cents.
The number of top-rated funds owning its shares rose from 1,116 in Dec '12 to 1,766 in Dec '13, a reassuring sign concerning the I criteria. Keep in mind that its large supply of 2.54 billion shares in the public float makes it an unlikely sprinter, especially as it is already well known by the institutional crowd and the general public.
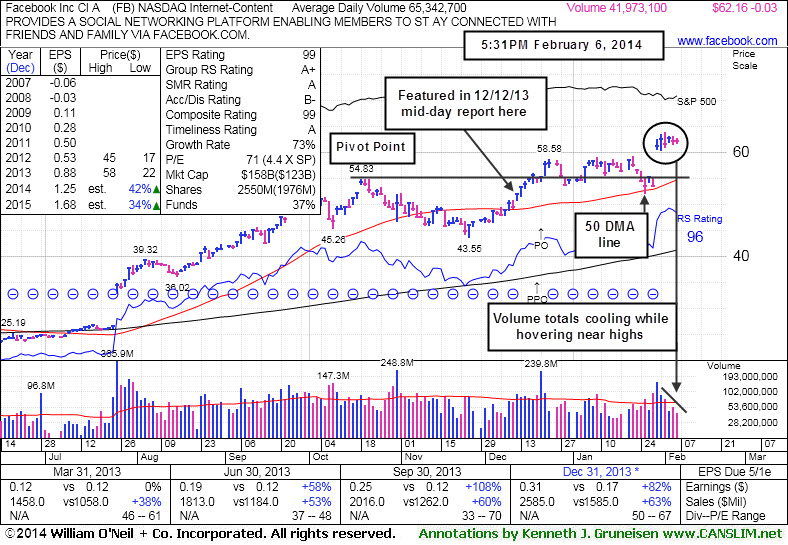
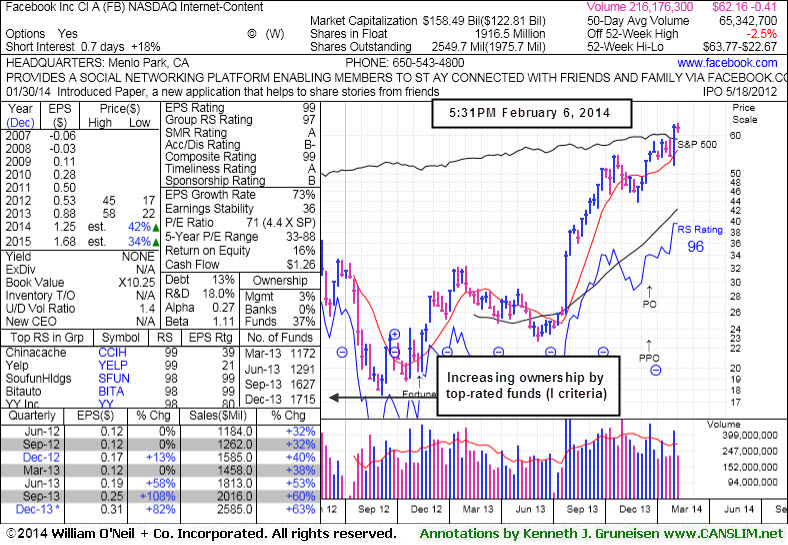
Volume Totals Cooling While Holding Ground at Highs - Thursday, February 06, 2014
Facebook Inc (FB -$0.03 or -0.05% to $62.16) has seen volume totals cooling while remaining perched very near its all-time highs. It reported earnings +82% on +63% sales revenues for the Dec '13 quarter and then gapped up and hit a new 52-week high. That marked its 3rd quarterly comparison with earnings above the +25% minimum (C criteria). Sequential acceleration in quarterly sales and strong earnings increases helps it look like a better match with the fact-based investment system's winning models.
It found support at its 50-day moving average (DMA) line during its latest consolidation. Market conditions still argue against new buying efforts until a follow through day (FTD) of gains from at least one of the major averages confirms a new rally. One may consider a valid secondary buy point from FB's successful test of the 10 week average up to +5% above the recent high ($59.31 on 1/22/14) or $62.28 in this case. FB was last shown in this FSU section on 1/15/14 with annotated graphs under the headline, "Following New Offering Prior Highs Acted As Support". It rallied from a 9-week cup shaped base without a handle after completing a Public Offering on 12/20/13. In the 12/12/13 mid-day report (read here) it was highlighted in yellow with a pivot point cited based on its 10/18/13 high plus 10 cents while noted with caution - "Disciplined investors may watch for subsequent volume-driven gains above its pivot point which are necessary to trigger a proper technical buy signal."
The number of top-rated funds owning its shares rose from 1,116 in Dec '12 to 1,715 in Dec '13, a reassuring sign concerning the I criteria. Keep in mind that its large supply of 2.54 billion shares in the public float makes it an unlikely sprinter, especially as it is already well known by the institutional crowd and the general public.
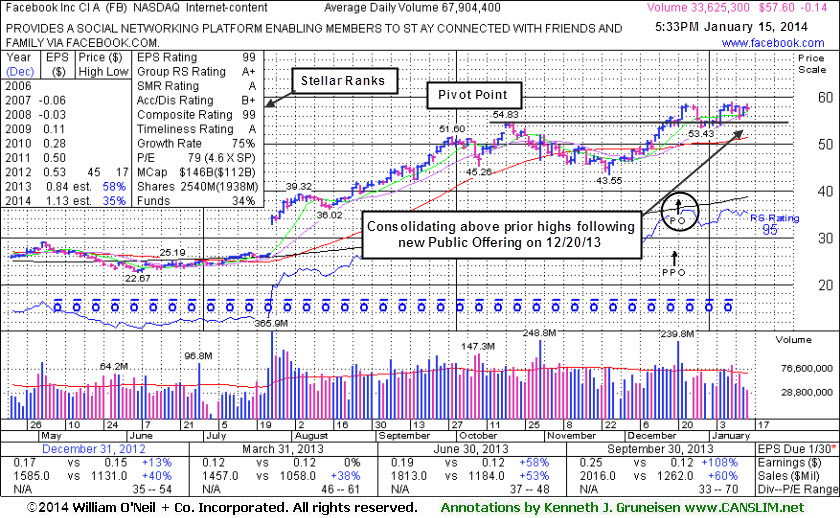
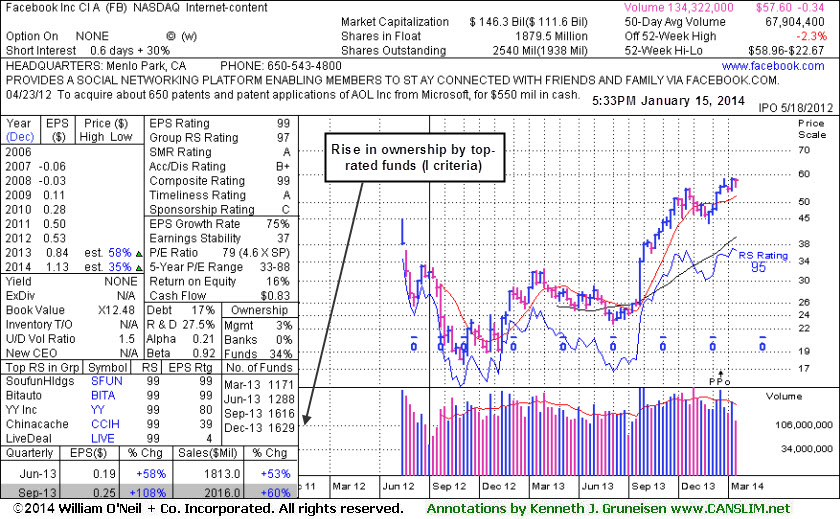
Following New Offering Prior Highs Acted As Support - Wednesday, January 15, 2014
Facebook Inc (FB -$0.14 or -0.24% to $57.60) has seen volume totals cooling while remaining perched very near its "max buy" level. Prior highs in the $54 area acted as support during its recent consolidation, meanwhile any slump into the prior base would raise concerns. It rallied from a 9-week cup shaped base without a handle after completing a Public Offering on 12/20/13.
Disciplined investors always limit losses by selling any stock that falls more than -7% from their purchase price. It was last shown in this FSU section on 12/12/13 with annotated graphs under the headline, "Well Known Social Media Firm on Watch List While Still Base Building". In the earlier mid-day report (read here) it was highlighted in yellow with a pivot point cited based on its 10/18/13 high plus 10 cents while noted with caution - "Disciplined investors may watch for subsequent volume-driven gains above its pivot point which are necessary to trigger a proper technical buy signal."
FB reported earnings +108% on +60% sales revenues for the Sep '13 quarter versus the year ago period, its 2nd quarterly comparison with earnings above the +25% minimum (C criteria). Sequential acceleration in quarterly sales and earnings increases helps it look like a better match with the fact-based investment system's winning models.
The number of top-rated funds owning its shares rose from 1,116 in Dec '12 to 1,629 in Dec '13, a reassuring sign concerning the I criteria. Keep in mind that its large supply of 2.54 billion shares in the public float makes it an unlikely sprinter, especially as it is already well known by the institutional crowd and the general public.
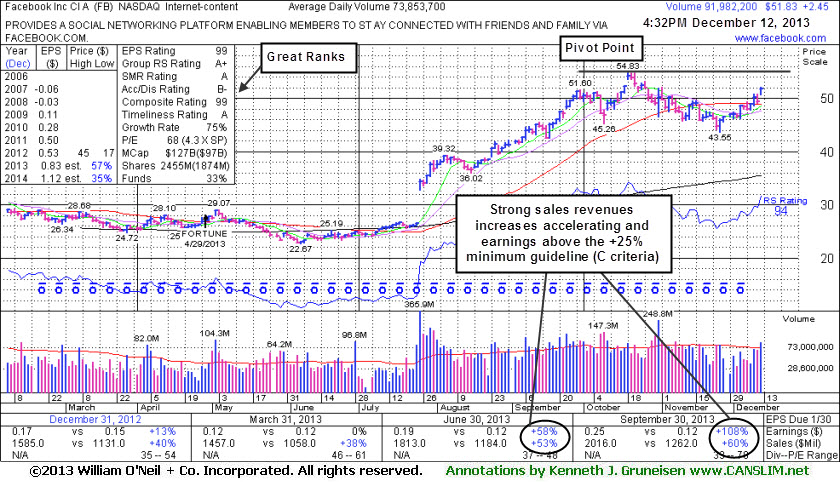
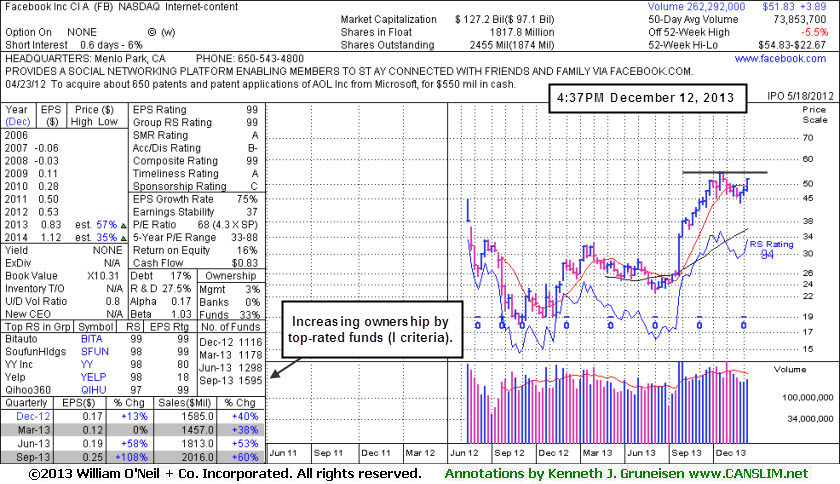
Well Known Social Media Firm on Watch List While Still Base Building - Thursday, December 12, 2013
Facebook Inc (FB +$2.45 or +4.96% to $51.83) posted a gain today with +25% above average volume and finished the session -5.5% off its 52-week high. It wedged back above its 50-day moving average (DMA) line this week with gains lacking great volume conviction while working on a 9-week cup shaped base. In today's mid-day report (read here) it was highlighted in yellow with a pivot point cited based on its 10/18/13 high plus 10 cents while noted with caution - "Disciplined investors may watch for subsequent volume-driven gains above its pivot point which are necessary to trigger a proper technical buy signal."
FB reported earnings +108% on +60% sales revenues for the Sep '13 quarter versus the year ago period, its 2nd quarterly comparison with earnings above the +25% minimum (C criteria). Sequential acceleration in quarterly sales and earnings increases helps it look like a better match with the fact-based investment system's winning models.
The number of top-rated funds owning its shares rose from 1,116 in Dec '12 to 1,595 in Sep '13, a reassuring sign concerning the I criteria. Keep in mind that its large supply of 1.87 billion shares in the public float makes it an unlikely sprinter, especially as it is already well known by the institutional crowd and the general public.