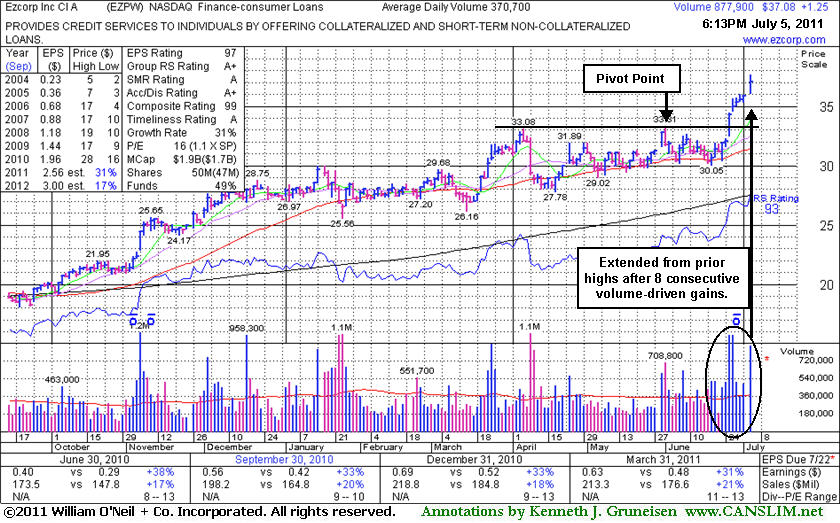
Streak Of Gains Leaves Firm Extended From Prior Highs - Tuesday, July 05, 2011
Ezcorp Inc (EZPW +$1.25 or +3.49% to $37.08) spiked higher with today's 8th consecutive volume-driven gain, getting very extended from prior highs in the $33 area that define support to watch on pullbacks. Following its last appearance in this FSU section on 6/13/11 with an annotated graph under the headline, "Choppy New Base Formed But Patience Remains Paramount", it eventually broke out with help from an analyst upgrade as its considerable gap up gain on heavy volume on 6/27/11 triggered a technical buy signal. Earnings have remained above the +25% guideline in its quarterly comparisons versus the year ago period, satisfying the C criteria. It also has a strong annual earnings history (A criteria). The number of top-rated funds owning its shares rose from 369 in Mar '10 to 419 in Mar '11, an encouraging sign with respect to the I criteria.
While disciplined investors waited for better confirmation of the current rally with a follow-through day of meaningful gains from at least one of the major averages, the M criteria of the investment system, EZPW's color code was changed to green after its streak of gains led to it getting extended from the previously noted base. Patient investors may watch for secondary buy points or additional bases to form and be noted rather than chasing a stock that is extended from the ideal buying range up more than +5% above prior highs.
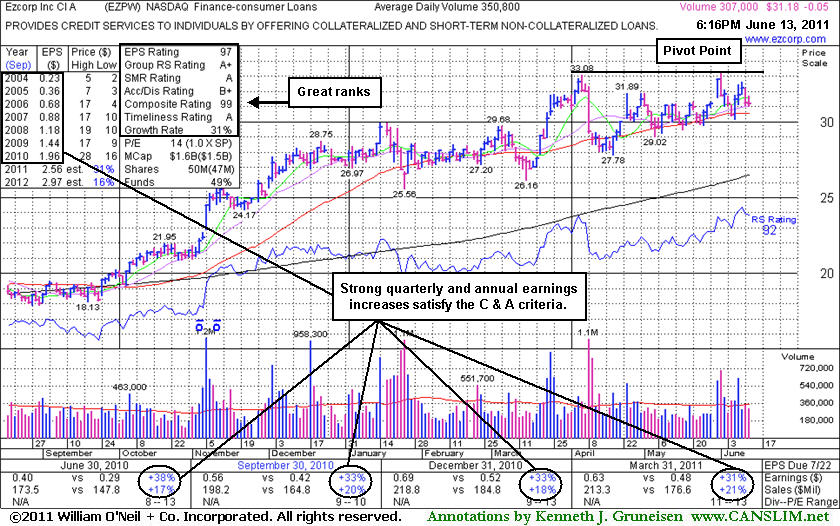
Choppy New Base Formed But Patience Remains Paramount - Monday, June 13, 2011
Ezcorp Inc (EZPW -$0.05 or -0.16% to $31.18) is consolidating after another test of support at its 50-day moving average (DMA) line last week, building on a choppy new base. Recent lows and its 50 DMA line define important nearby chart support to watch where technical violations would raise more serious concerns. Since its last appearance in this FSU section on 5/10/11 with an annotated graph under the headline, "Volume Totals Cooling After Choppy Consolidation", it spiked higher on May 31st with a gain on above average volume. It managed to briefly touch a new 52-week high on June 1st, however that session was noted for its "negative reversal" and loss on above average volume. Rather than rallying higher, unhindered by overhead supply, its subsequent action was indicative of distributional pressure.Its color code is changed to yellow and its 52-week high plus ten cents is cited as a new pivot point after a choppy 10-week cup-with-handle type pattern. Subsequent gains with well above average volume lifting it above its pivot point may trigger a new technical buy signal. However, a confirmed rally with a follow-through day of meaningful gains from at least one of the major averages and and an expansion in leadership is also necessary to confirm new buying efforts are justified under the M criteria of the investment system. Meanwhile, patience is paramount. Its 50-day moving average (DMA) line and recent lows define important nearby chart support levels to watch where technical violations would raise more serious concerns.
Disciplined investors may keep it on their watch list until more definitive action develops from it and the broader market. Earnings have remained above the +25% guideline in its quarterly comparisons versus the year ago period, satisfying the C criteria. It also has a strong annual earnings history (A criteria). The number of top-rated funds owning its shares rose from 369 in Mar '10 to 419 in Mar '11, an encouraging sign with respect to the I criteria.
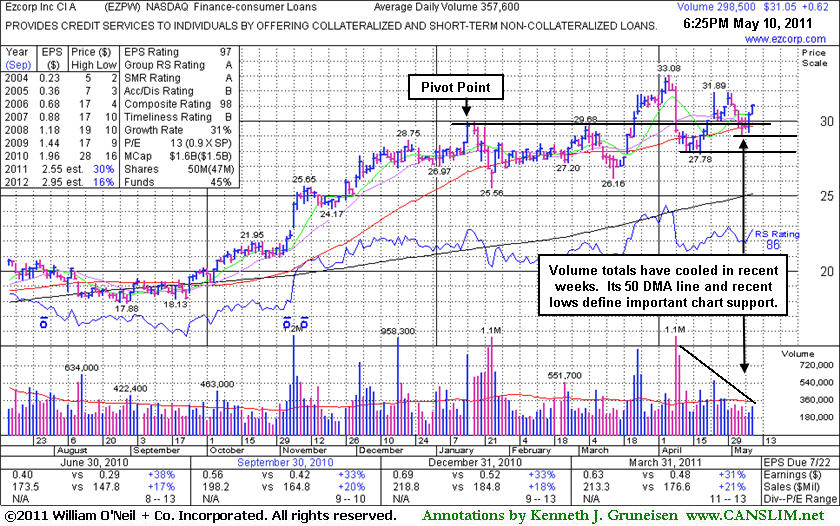
Volume Totals Cooling After Choppy Consolidation - Tuesday, May 10, 2011
Ezcorp Inc's (EZPW +$0.62 or +2.04% to $31.05) volume totals have been cooling in recent weeks, meanwhile its choppy action has not been recognized as a sound new base pattern. Its 50-day moving average (DMA) line and recent lows define important nearby chart support levels to watch where technical violations would raise more serious concerns. Since its last appearance in this FSU section on 4/11/11 with an annotated graph under the headline, "Latest Breakout Negated By Damaging Losses", it sputtered below its 50 DMA line, then rallied back for a lower high.
Disciplined investors may watch for more definitive action and wait for a proper base pattern to possibly develop and be noted.Gains above its recent high ($31.85) would be a very encouraging sign. Earnings have remained above the +25% guideline in its quarterly comparisons versus the year ago period, satisfying the C criteria. It also has a strong annual earnings history (A criteria). The number of top-rated funds owning its shares rose from 369 in Mar '10 to 421 in Mar '10, an encouraging sign with respect to the I criteria.
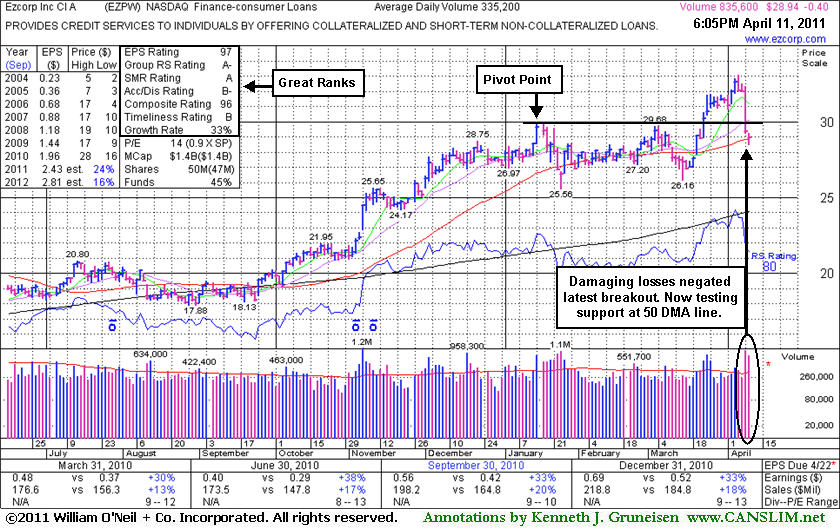
Latest Breakout Negated By Damaging Losses - Monday, April 11, 2011
Ezcorp Inc (EZPW -$0.40 or -1.36% to $28.94) was down today with above average volume, and it closed near its 50-day moving average (DMA) line. A considerable loss on 4/08/11 with three times average volume raised concerns while it negated its latest breakout and slumped below its prior high closes in the $29-30 area previously noted as important support to watch. A prompt sign of support near its 50 DMA line would be an encouraging sign, meanwhile any additional damaging losses may trigger more worrisome technical sell signals.
Earnings have remained above the +25% guideline in its quarterly comparisons versus the year ago period, satisfying the C criteria. It also has a strong annual earnings history (A criteria). The number of top-rated funds owning its shares rose from 369 in Mar '10 to 415 in Dec '10, an encouraging sign with respect to the I criteria. Since its last appearance in this FSU section on 3/10/11 with an annotated graph under the headline, "Deterioration In Stock And Broader Market Hurting Outlook", it found support above an earlier chart low ($25.56 on 1/25/11), then subsequent gains with heavy volume triggered a new (or add-on) technical buy signal.
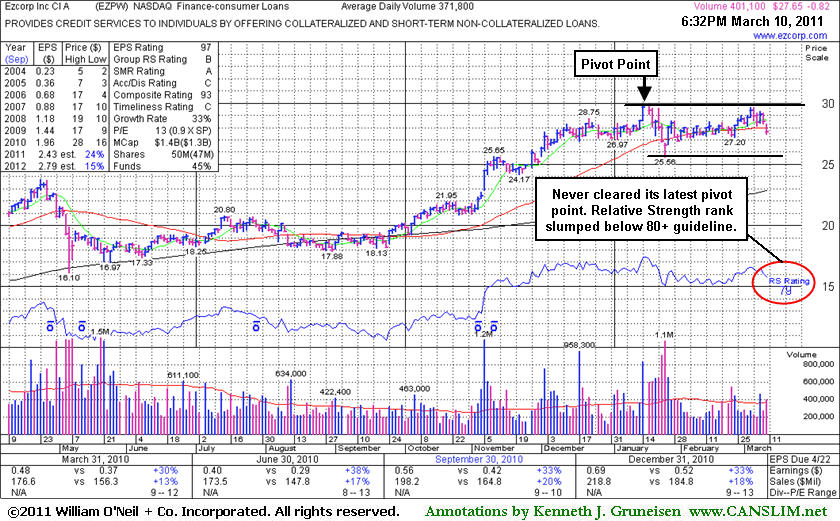
Deterioration In Stock And Broader Market Hurting Outlook - Thursday, March 10, 2011
Ezcorp Inc's (EZPW -$0.81 or -2.88% to $27.65) color code was changed to green as today's loss violated its 50-day moving average (DMA) line and raised concerns. Broader market weakness (M criteria) also has raised concerns as recent distributional action essentially ended the latest rally. Patient investor might watch for a new rally and follow-through-day to provide an important reassurance of fresh institutional accumulation. Gains with heavy volume above EZPW's latest pivot point have not shown up to provide the critical proof of institutional buying demand, meanwhile the recent low ($25.56 on 1/25/11) defines an important support level to watch. It is consolidating -7.7% off its 52-week high. Subsequent gains with heavy volume above its recent highs may trigger a new (or add-on) technical buy signal. Since its last appearance in this FSU section on 2/02/11 with an annotated graph under the headline "Consolidation Following Damaging Dose Of Distributional Pressure" it has seen mostly quiet volume totals while consolidating near its 50-day moving average (DMA) line.
Earnings have remained above the +25% guideline in its quarterly comparisons versus the year ago period, satisfying the C criteria. It also has a strong annual earnings history (A criteria). The number of top-rated funds owning its shares rose from 369 in Mar '10 to 403 in Dec '10, a slightly encouraging sign with respect to the I criteria. EZPW was featured in yellow in the 11/05/10 mid-day report (read here). It had found support near its 200-day moving average (DMA) line and rebounded impressively since it was dropped from the Featured Stocks list on 5/07/10.
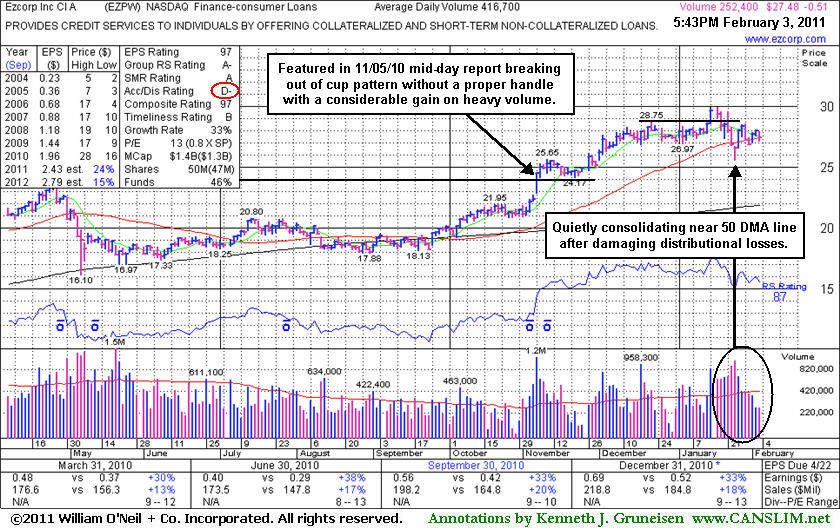
Consolidation Following Damaging Dose Of Distributional Pressure - Thursday, February 03, 2011
Ezcorp Inc (EZPW -$0.51 or -1.84% to $27.48) has seen quiet volume totals this week while consolidating near its 50-day moving average (DMA) line. After a recent spurt of damaging distributional losses on heavy volume triggered technical sell signals it managed to promptly repair a 50 DMA violation, a reassuring sign of institutional support. It is not near any sound base now and needs more time to potentially form a new base. Meanwhile its recent low ($25.56 on 1/25/11) defines an important support level to watch.
Its last appearance in this FSU section was on 12/29/10 with an annotated graph under the headline "Watch Extended Stocks For Secondary Buy Points" when we observed - "Disciplined investors avoid chasing extended stocks that have rallied from sound base patterns more than +5% above their prior chart highs. Patience may allow for secondary buy points to develop which may be noted in the future." Bullish action 1/14/11 was not considered a valid breakout because its orderly consolidation was below the minimum length for a proper base pattern. Some may have confused the tight consolidation for an advanced "3-weeks tight" pattern, however prior gains after its earlier breakout were not substantial enough. A proper 3-weeks tight base typically follows gains of 70-100% or more in the span of 9-16 weeks following an earlier technical breakout from a sound base pattern.
EZPW had consolidated above prior highs then continued higher since it was show in this FSU section on 11/05/10 with an annotated graphs under the headline "Breakout Backed By Four Times Average Volume". It gapped up then for a new 52-week high, rising from a 6-month cup shaped base without a proper handle. Earnings have remained above the +25% guideline in its quarterly comparisons versus the year ago period, satisfying the C criteria. It also has a strong annual earnings history (A criteria). The number of top-rated funds owning its shares rose waned from 389 in Jun '10 to 377 in Dec '10, a slightly negative sign with respect to the I criteria. EZPW was featured in yellow in the 11/05/10 mid-day report (read here) with pivot point cited based on its 52-week high plus ten cents. It had found support near its 200-day moving average (DMA) line and rebounded impressively since it was dropped from the Featured Stocks list on 5/07/10.
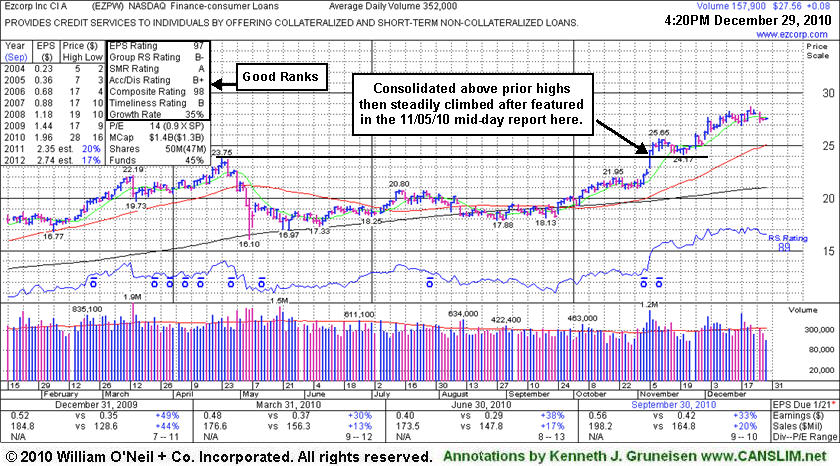
Watch Extended Stocks For Secondary Buy Points - Wednesday, December 29, 2010
Ezcorp Inc's (EZPW +$0.08 or +0.29% to $27.56) volume totals have been cooling while holding its ground stubbornly near its 52-week high. Its 50-day moving average (DMA) line (now $25.07) defines important near-term chart support. It has recently been noted as - "Stubbornly holding its ground after recent volume-driven gains, extended from a sound base pattern." Disciplined investors avoid chasing extended stocks that have rallied from sound base patterns more than +5% above their prior chart highs. Patience may allow for secondary buy points to develop which may be noted in the future.
It consolidated above prior highs then continued higher since its last appearance in this FSU section on 11/05/10 with an annotated graphs under the headline "Breakout Backed By Four Times Average Volume". It gapped up then for a new 52-week high, rising from a 6-month cup shaped base without a proper handle. Earnings have remained above the +25% guideline in its quarterly comparisons versus the year ago period, satisfying the C criteria. It also has a strong annual earnings history (A criteria). The number of top-rated funds owning its shares rose from 327 in Dec '09 to 387 in Sep '10, a reassuring sign with respect to the I criteria. EZPW was featured in yellow in the 11/05/10 mid-day report (read here) with pivot point cited based on its 52-week high plus ten cents. It had found support near its 200-day moving average (DMA) line and rebounded impressively since it was dropped from the Featured Stocks list on 5/07/10.
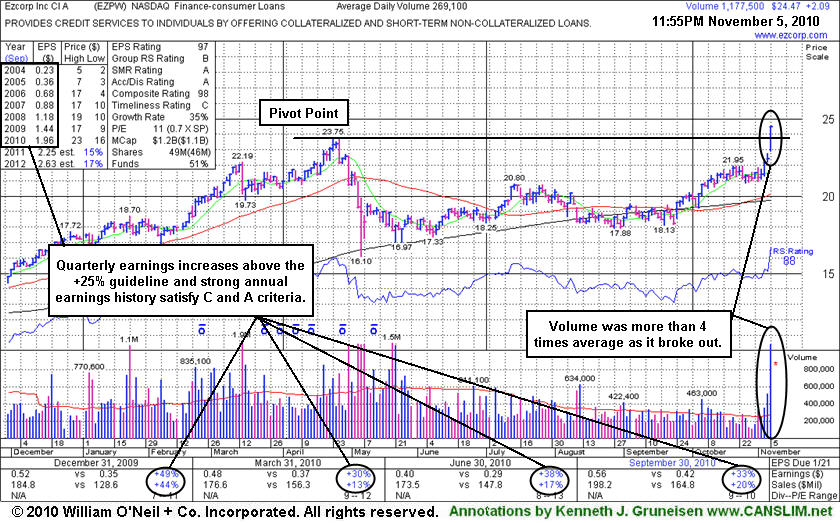
Breakout Backed By Four Times Average Volume - Saturday, November 06, 2010
Ezcorp Inc (EZPW +$2.09 or +9.34% to $24.47) gapped up today, rising from a 6-month cup shaped base without a proper handle, hitting a new 52-week high. Earnings have remained above the +25% guideline in its quarterly comparisons versus the year ago period, satisfying the C criteria. It also has a strong annual earnings history (A criteria). The number of top-rated funds owning its shares rose from 326 in Dec '09 to 383 in Sep '10, a reassuring sign with respect to the I criteria. It finished strong today after it was color coded yellow in the mid-day report (read here) with new pivot point cited based on its 52-week high plus ten cents. It found support near its 200-day moving average (DMA) line and has rebounded impressively since it was dropped from the Featured Stocks list on 5/07/10.
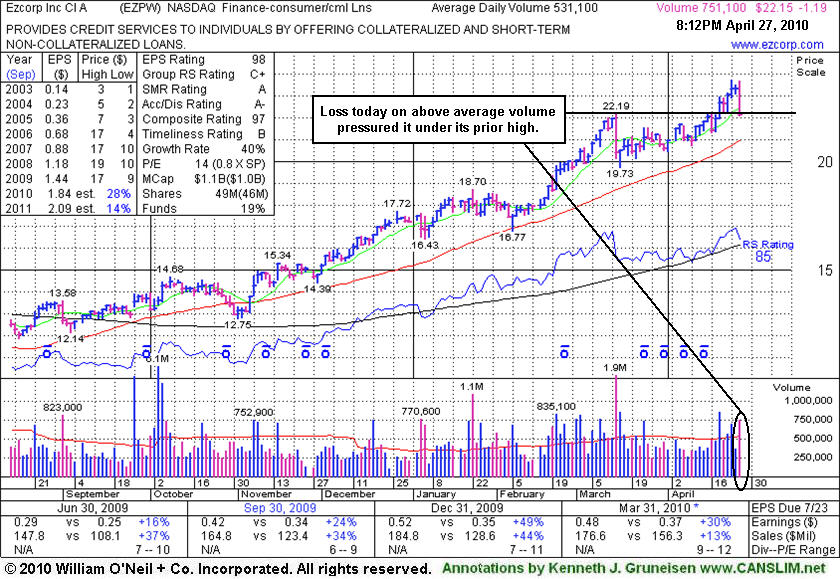
Loss on Higher Volume Leads To Damaging Close Under Old Chart Highs - Tuesday, April 27, 2010
Ezcorp Inc (EZPW -$1.19 or -5.10% to $22.15) suffered a considerable loss today on above average volume, closing below its pivot point and prior chart highs, raising concerns. It recently rose from a 5-week flat base, so resistance is not in the way for this high-ranked Finance - Consumer/Commercial Loans firm if the market rally continues. EZPW has been noted recently as extended from its latest sound base of support after triggering a new technical buy signal on 4/20/10, having completed a new base and broken out following its last appearance in this FSU section on 3/29/10 with an annotated graph under the headline "Financial Firm Consolidating After Getting Extended."
Earnings per share increases have shown acceleration along with greater than +25% sales revenues increases in the latest quarterly comparisons (good C criteria) versus the year earlier, and a great annual earnings history (good A criteria). Its 50-day moving average (DMA) line and its recent chart low ($19.73 on 3/16/10) define near-term support above prior chart highs.
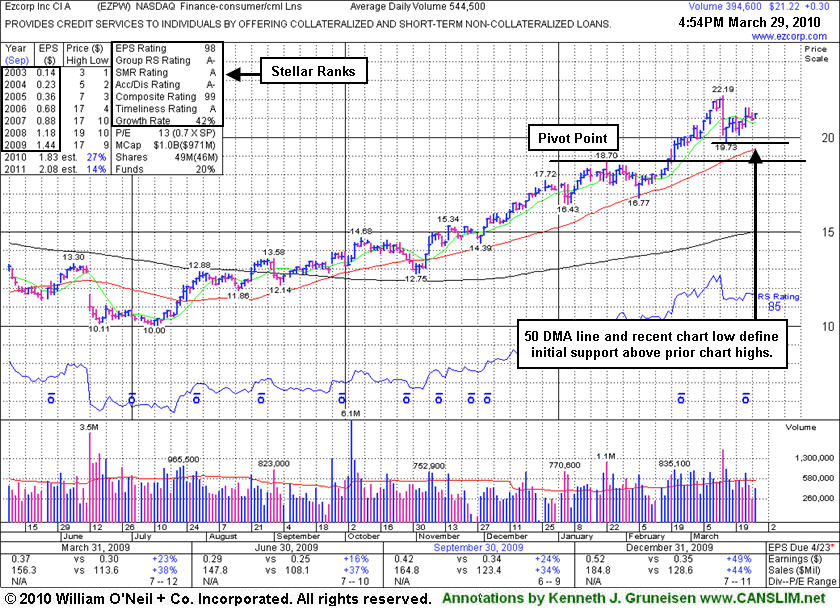
Financial Firm Consolidating After Getting Extended From Latest Base - Monday, March 29, 2010
Ezcorp Inc (EZPW +$0.30 or +1.43% to $21.22) is a high-ranked Finance - Consumer/Commercial Loans firm that is now quietly consolidating well above its 50-day moving average (DMA) line and its recent chart low ($19.73 on 3/16/10) which define near-term support above prior chart highs. It is extended from its latest sound base of support. As previously noted, "Since it managed to top its 2008 all-time high, no resistance remains due to overhead supply, but disciplined investors avoid chasing extended stocks trading more than +5% above prior chart highs."
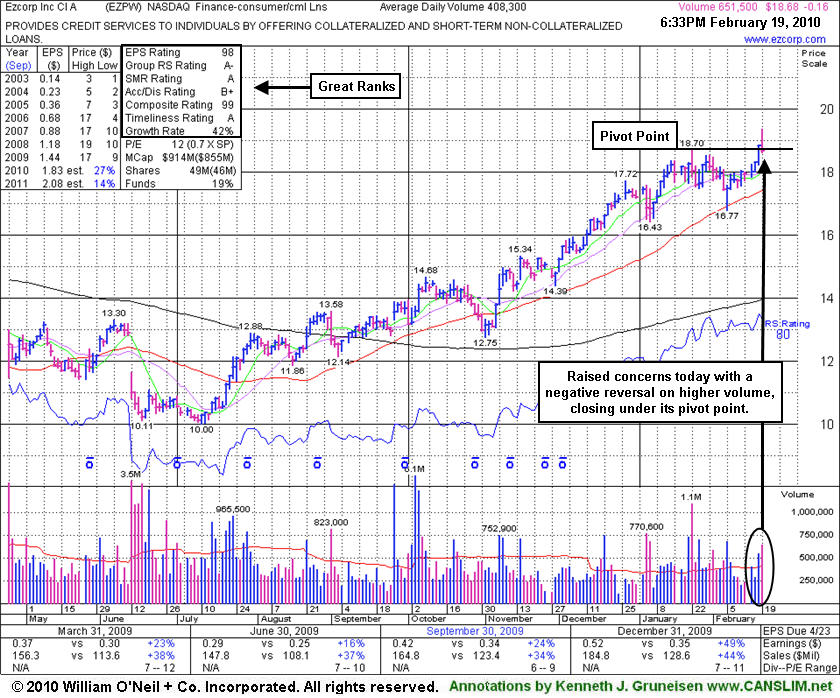
EZPW was featured in yellow with new pivot point and may buy levels noted in the 2/19/10 mid-day report (read here). It followed a negative reversal on 2/19/10 with a considerable gain on the very next session (2/22/10) with twice average volume triggering a technical buy signal. By the evening of 2/24/10 its color code was changed to green as it had rallied above its "max buy" level. This previously featured stock was dropped from the Featured Stocks list on 10/09/08, yet it continued to show strong sales and earnings growth (solid fundamentals). Earnings per share increases have shown acceleration along with greater than +25% sales revenues increases in the latest quarterly comparisons (good C criteria) versus the year earlier, and a great annual earnings history (good A criteria).
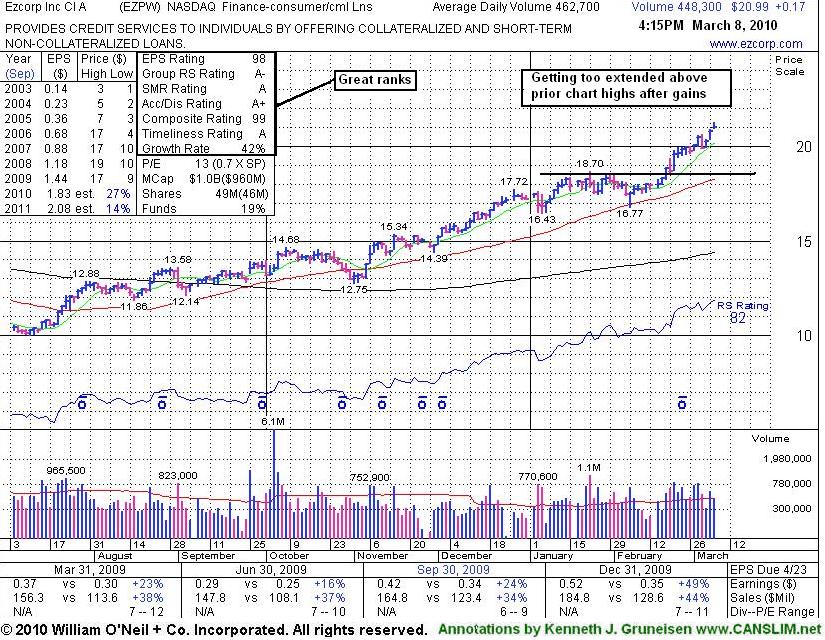
Financial Firm Extended From Base After Recent Bullish Action - Monday, March 08, 2010
Ezcorp Inc (EZPW +$0.17 or +0.82% to $20.99) gapped up today and posted another small gain today with near average volume. At a new all-time high, it has recently been noted as "getting more extended from any sound base of support." As previously noted, since it managed to top its 2008 all-time high, no resistance remains due to overhead supply, but disciplined investors avoid chasing extended stocks trading more than +5% above prior chart highs.
EZPW was featured in yellow with new pivot point and may buy levels noted in the 2/19/10 mid-day report (read here). It followed a negative reversal on 2/19/10 with a considerable gain on the very next session (2/22/10) with twice average volume triggering a technical buy signal. By the evening of 2/24/10 its color code was changed to green as it had rallied above its "max buy" level. On pullbacks, prior chart highs in the $18 area define an important support level to watch now.
This previously featured Finance - Consumer/Commercial Loans firm was dropped from the Featured Stocks list on 10/09/08, yet it continued to show strong sales and earnings growth (solid fundamentals). Earnings per share increases have shown acceleration along with greater than +25% sales revenues increases in the latest quarterly comparisons (good C criteria) versus the year earlier, and a great annual earnings history (good A criteria).
Negative Reversal Indicated Distributional Pressure - Friday, February 19, 2010
High-Ranked Leader Perched Near All-Time Highs - Wednesday, October 01, 2008
|
Ezcorp Inc. |
||
|
Ticker Symbol: EZPW (NASDAQ) |
Industry Group: Financial Services- Misc |
Shares Outstanding: 41,000,000 |
|
Price: $18.28 10/01/2008 |
Day's Volume: 667,900 10/01/2008 |
Shares in Float: 32,300,000 |
|
52 Week High: $19.25 9/30/2008 |
50-Day Average Volume: 787,800 |
Up/Down Volume Ratio: 1.2 |
|
Pivot Point: $19.09 7/24/2008 |
Pivot Point +5% = Max Buy Price: $20.04 |
Web Address: http://www.ezcorp.com/ |
C A N S L I M | StockTalk | News | Chart | SEC | Zacks Reports | ![]()
![]()
![]()

View all notes | Alert me of new notes | CANSLIM.net Company Profile
CANSLIM.net Profile: EZCORP, Inc., together with its subsidiaries, lends or provides credit services to individuals who do not have cash resources or access to credit to meet their short-term cash needs. The company makes pawn loans, which are non recourse loans collateralized by tangible personal property, including jewelry, consumer electronics, tools, sporting goods, and musical instruments. The company also offers signature loans, consisting of payday loans or fee-based credit services, to customers seeking loans from unaffiliated lenders. In addition, EZCORP provides credit services, including advice and assistance to customers in obtaining loans from unaffiliated lenders, in Texas and Florida. As of September 30, 2007, it offered pawn related activities from 298 pawn stores, and signature loans form 75 pawn stores and 433 EZMONEY stores. The company was founded in 1989 and is based in Austin, Texas. The company has increased its earnings by +30%, +26%, +30%, and +56% in the quarterly comparisons versus the year ago periods ending Sept, Dec '07 and March, June '08, better than the +25% guideline (the C criteria) in each of the last four reports. Quarterly sales revenues increases have been near the +25% guidelines. The company hails from the Financial Services- Misc group which is presently ranked 52nd on the 197 Industry Groups list, which is on the border of the much coveted top quartile of industry groups, helping satisfy the "L" criteria. The stock has been accumulated by high-ranked mutual funds over the past 12 months, which is an important component of institutional sponsorship (the I criteria). The number of top-rated funds owning an interest in its shares rose from 70 in Sept '07 to 73 in June '08.
What to Look For and What to Look Out For: Watch for the market (the M criteria) to confirm a new rally with a follow through day before initiating any new positions. Once a new rally is confirmed, watch for this high ranked leader to trigger a proper technical buy signal with convincing gains on high volume before above its $19.09 pivot point. It is wise to wait for that blast of buying as proof institutional demand (the I criteria) is truly present and capable of leading to a sustained advance. It is important to note that this could be days or even weeks away, or it might never materialize. Meanwhile, there is no way of knowing if the stock might spend a much longer time consolidating even deeper towards its 50-day moving average (DMA) line. As long as this issue continues trading above chart support near its prior chart highs ($17 area) and above its short-term average, the action remains healthy. Deterioration below that support level would raise concerns and suggest that investors would be vulnerable to greater losses while it spends more time consolidating.
Technical Analysis: This stock is currently tracing out what may be called a base-on-base type pattern, from which it has yet to trigger a convincing technical buy signal. It broke out in July from an earlier base, and it has recently been challenging all-time highs, with little resistance remaining due to overhead supply. While it is "basing" it should remain on an active watchlist, as all disciplined investors know to wait until a proper buy signal is triggered after market conditions improve. Perched near all-time highs, within close range of its latest pivot point, it was color coded yellow again in the 9/30/08 CANSLIM.net Mid-Day BreakOuts Report (read here) with new pivot point and max buy levels noted. First featured in the 7/08/08 CANSLIM.net Mid-Day BreakOuts Report (read here).
M Criteria Argues Against Buying Ideal Looking Breakout - Friday, July 11, 2008
Healthy stocks that are within close striking distance of new highs are often great buy candidates for investors to keep on their watch lists, especially when the companies match favorably with all of the investment system's criteria. When a stock is more than -10% off its 52-week high, and if it has violated its 50-day moving average (DMA) line, then the outlook only gets worse and worse as it spends a greater period of time trading deeper under that important short-term average line. By the time a stock's 50 DMA line starts sloping downward it should also be acknowledged that the stock has been struggling for a long while, in which case it might be time to reduce exposure and look for places to put that money to work in stronger buy candidates
Ezcorp Inc Cl A (EZPW +$0.27 or +1.68% to $16.36) was first featured in yellow at $14.80 on Tuesday, July 08, 2008 in the CANSLIM.net Mid Day Breakouts Report with a $14.98 pivot point and $15.73 max buy price (read here) with the following note - "Y - Its second consecutive big gain on above average volume helped it trade to a new 52-week high today. Accelerating sales revenues growth and steady earnings growth above the +25% guideline in the 3 latest quarterly comparisons (good C criteria) versus the year earlier withn a great annual earnings history (good A criteria). Faces a bit of resistance due to overhead supply up to its all-time highs in the $17 area. The M criteria also argues against new buys until a through day."
Subsequent gains on above average volume have helped EZPW rally above its max buy level. Disciplined investors may watch for future opportunities to accumulate shares on light volume pullbacks toward prior chart highs than now are an important support level to watch. Before any new buying efforts are justifyable under the investment system's guidelines, however, the major averages need to get a confirmed rally going. Meanwhile, patience is paramont, as 3 out of 4 stocks tend to follow the major averages' direction. Deterioration back into its prior base would raise concerns and possibly trigger sell signals.
C A N S L I M | StockTalk | News | Chart | SEC | Zacks Reports | ![]()
![]()
![]()

View all notes | Alert me of new notes | CANSLIM.net Company Profile