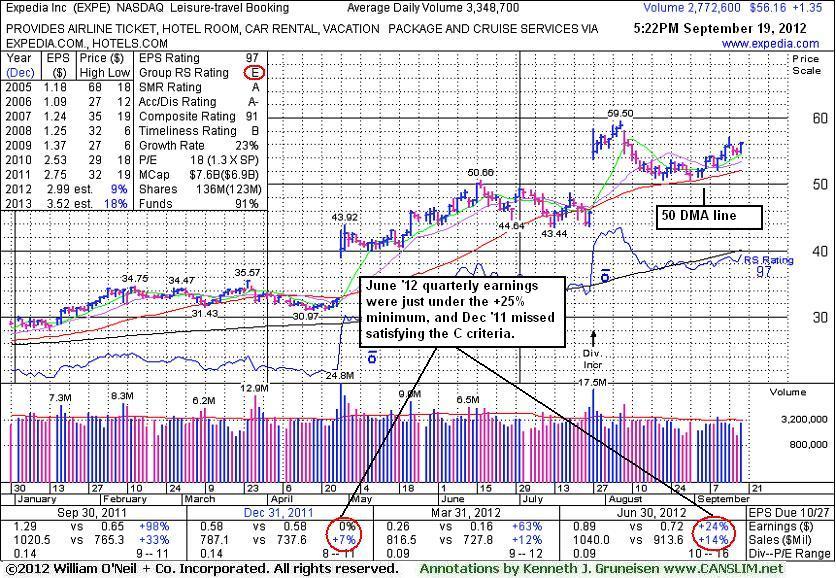
Online Travel Firm Resilient Despite Unfavorable Signs - Wednesday, September 19, 2012
Expedia Inc (EXPE +$1.33 or +2.43% to $56.14) posted a gain today with near average volume. It has been consolidating above prior highs and its 50-day moving average (DMA) line defining important near-term chart support in the $50 area. Its last appearance in this FSU section was on 8/14/12 with an annotated graph under the headline, "Weakening Group Raises Concerns After Prior Gains". The Leisure - Travel Booking industry group has Group Relative Strength Rating slump to a E, down from A+ when it made its an earlier appearance in this FSU section on 7/10/12. The weakening of the group raises concerns because the L criteria calls for investors to focus new buying efforts only on high-ranked leaders in leading industry groups where the odds are most favorable.
It may find support near its prior highs in the $50 area which define support along with its 50 DMA line now, but further deterioration would raise greater concerns. A new pivot point is not being cited also due to fundamental concerns. EXPE recently reported earnings +24% on +14% sales revenues for the quarter ending June 30, 2012 versus the year ago period, just below the +25% minimum earnings guideline for buy candidates. Its annual earnings (A criteria) history has been good. The number of top-rated funds owning its shares rose from 955 in Sep '11 to 1,053 in Jun '12, a reassuring sign concerning the I criteria.
EXPE traded up as much as +41.3% since it was highlighted in yellow in the 4/27/12 mid-day breakouts report (read here) after its considerable "breakaway gap" up above its 3/26/12 high. It had reported earnings +63% on +12% sales revenues for the quarter ended March 31, 2012 versus the year ago period. However, quarterly earnings should be above the +25% minimum guideline in 3 of the past 4 comparisons.
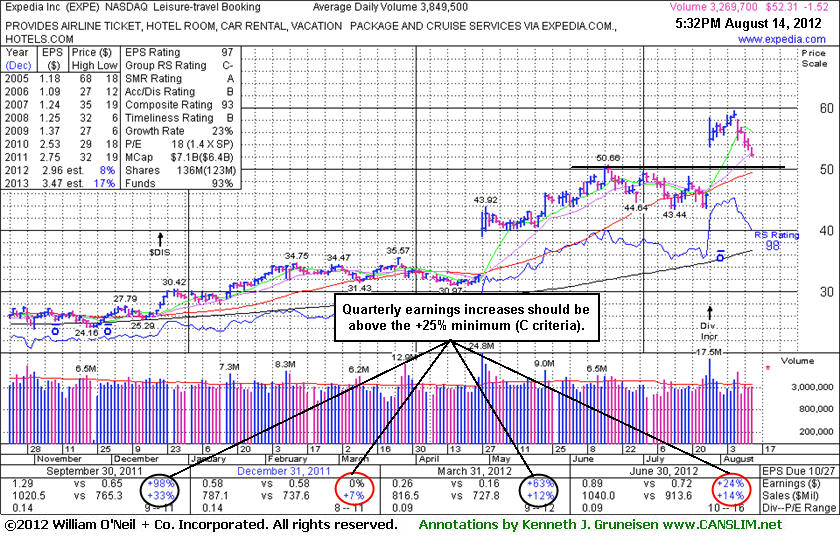
Weakening Group Raises Concerns After Prior Gains - Tuesday, August 14, 2012
Expedia Inc (EXPE -$1.52 or -2.82% to $52.31) was down today for a 5th losing session in a row. Recent weakness has been noted in travel-related stocks after Priceline.com Inc (PCLN) and Orbitz Worldwide Inc (OWW) reported disappointing results. The Leisure - Travel Booking industry group has Group Relative Strength Rating of 31/C-, down from 88/A+ when it made its last appearance in this FSU section on 7/10/12 with an annotated graph under the headline, "Fifth Straight Loss With Higher Volume Tests 50-Day Average". The weakening of the group raises concerns because the L criteria calls for investors to focus new buying efforts only on high-ranked leaders in leading industry groups where the odds are most favorable. It may find support near its prior highs in the $50 area which define support along with its 50 DMA line now, but further deterioration would raise greater concerns.
EXPE recently reported earnings +24% on +14% sales revenues for the quarter ending June 30, 2012 versus the year ago period, just below the +25% minimum earnings guideline for buy candidates. It had undercut its 50-day moving average (DMA) line in the weeks that followed before its big gap up gain on 7/27/12 to new high territory. Its annual earnings (A criteria) history has been good. The number of top-rated funds owning its shares rose from 955 in Sep '11 to 1,051 in Jun '12, a reassuring sign concerning the I criteria.
EXPE traded up as much as +41.3% since it was highlighted in yellow in the 4/27/12 mid-day breakouts report (read here) after its considerable "breakaway gap" up above its 3/26/12 high. It had reported earnings +63% on +12% sales revenues for the quarter ended March 31, 2012 versus the year ago period. However, quarterly earnings should be above the +25% minimum guideline in 3 of the past 4 comparisons.
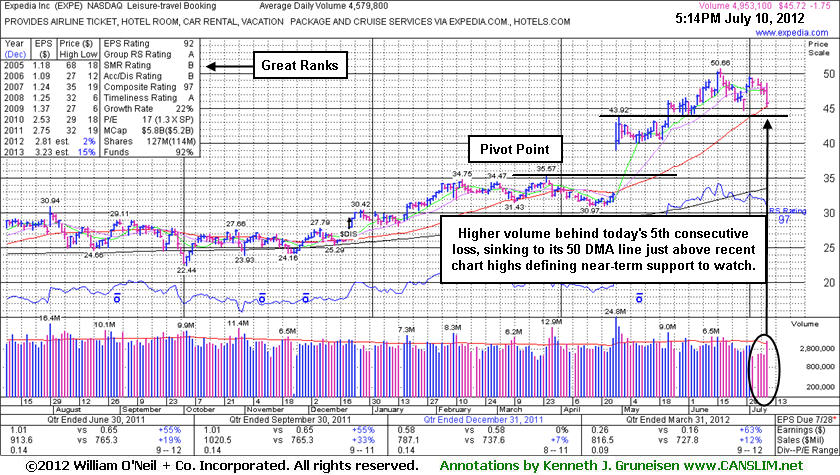
Fifth Straight Loss With Higher Volume Tests 50-Day Average - Tuesday, July 10, 2012
Expedia Inc (EXPE -$1.75 or -3.69% to $45.72) slumped with higher volume today for its 5th consecutive loss, testing important support at its 50-day moving average (DMA) line just above prior lows. It still remains a bit extended from its prior highs in the $43 area which define support below that important short-term average. Its last appearance in this FSU section was on 6/08/12 with an annotated graph under the headline, "Wedging Higher While M Criteria Still Urges Caution", as gains into new high territory without great volume conviction were noted as "wedging", which calls attention to the lack of robust buying demand from the institutional crowd. Only its 6/18/12 gain afterward was marked by above average volume as it approached its high
EXPE was highlighted in yellow in the 4/27/12 mid-day breakouts report (read here) after its considerable "breakaway gap" up above the pivot point cited based on its 3/26/12 high (shown on the chart below). It reported earnings +63% on +12% sales revenues for the quarter ended March 31, 2012 versus the year ago period. Quarterly earnings have been above the +25% minimum guideline in 3 of the past 4 comparisons (the Dec '11 comparison was flat) and its annual earnings (A criteria) history has been good. The number of top-rated funds owning its shares rose from 916 in Jun '11 to 972 in Mar '12, a reassuring sign concerning the I criteria. The Leisure - Travel Booking industry group has earned a high Group Relative Strength Rating of 88/A+, a reassuring sign concerning the L criteria.
A breakaway gap has been repeatedly noted as the one exception where the usual limit can be stretched to allow for disciplined investors to buy as much as +10% above the pivot point. Longtime readers know that the regular limit above the pivot point is +5%, and the further one chases a stock above its pivot point will increase the likelihood that an ordinary pullback of -7-8% might prompt them to sell based on the fact-based system's strict selling rules.
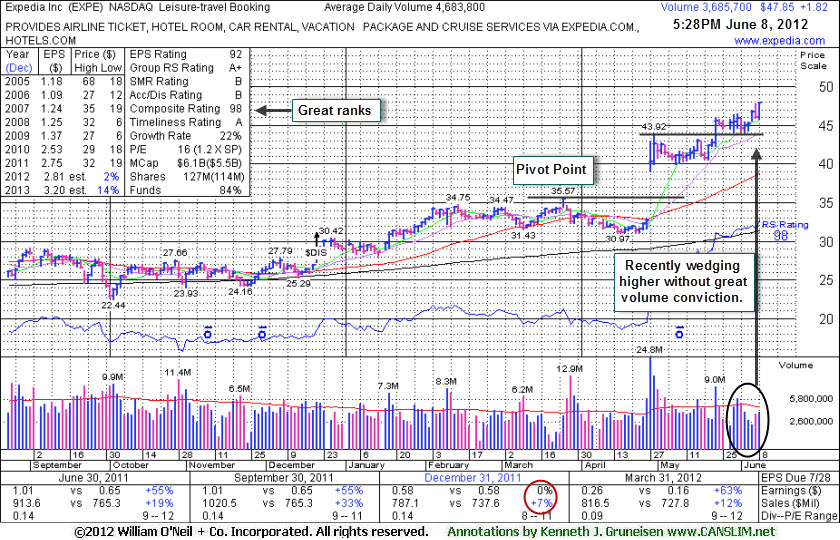
Wedging Higher While M Criteria Still Urges Caution - Friday, June 08, 2012
Expedia Inc (EXPE +$1.82 or +3.95% to $47.85) hit another new 52-week high today with a gain backed by below average volume. Gains into new high territory without great volume conviction are termed "wedging", which calls attention to the lack of robust buying demand from the institutional crowd. EXPE is also getting more extended from its prior highs in the $43 area. A new pivot point was not cited, yet there was a noted advanced "3-weeks tight" pattern formed during the ongoing market "correction" after its earlier breakaway gap. Disciplined investors know that the M criteria argues against any new buying efforts unless a rally has been confirmed.
Its last appearance in this FSU section was on 5/03/12 with an annotated graph under the headline, "Consolidation Following Exceptional Breakaway Gap". It had been highlighted in yellow in the 4/27/12 mid-day breakouts report (read here) after its considerable "breakaway gap" up above the pivot point cited based on its 3/26/12 high. It reported earnings +63% on +12% sales revenues for the quarter ended March 31, 2012 versus the year ago period. Quarterly earnings have been above the +25% minimum guideline in 3 of the past 4 comparisons (see the Dec '11 comparison circled in red) and its annual earnings (A criteria) history has been good. The number of top-rated funds owning its shares rose from 916 in Jun '11 to 976 in Mar '12, a reassuring sign concerning the I criteria. The Leisure - Travel Booking industry group has earned a high Group Relative Strength Rating of 96/A+, a reassuring sign concerning the L criteria.
A breakaway gap has been repeatedly noted as the one exception where the usual limit can be stretched to allow for disciplined investors to buy as much as +10% above the pivot point. Longtime readers know that the regular limit above the pivot point is +5%, and the further one chases a stock above its pivot point will increase the likelihood that an ordinary pullback of -7-8% might prompt them to sell based on the fact-based system's strict selling rules.
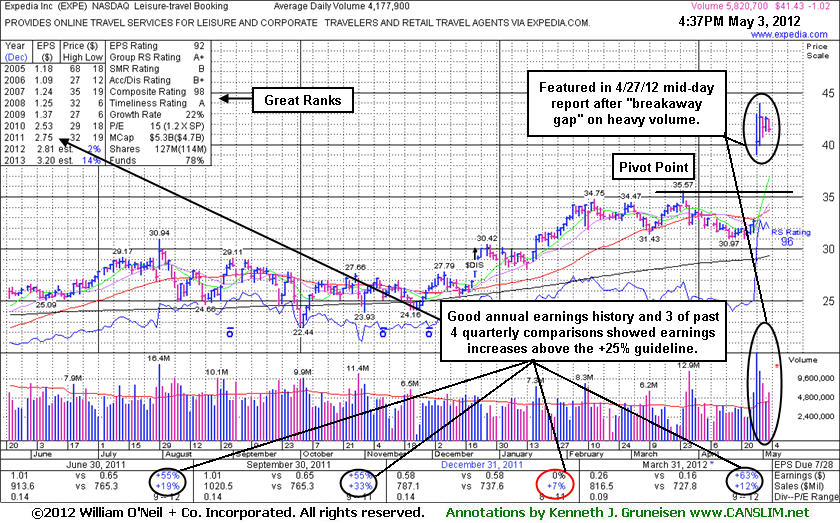
Consolidation Following Exceptional Breakaway Gap - Thursday, May 03, 2012
Leading stocks that are breaking out of a solid base are often highlighted in CANSLIM.net's Mid-Day Breakouts Report. The most relevant factors are noted in the report which alerts prudent CANSLIM oriented investors to do any necessary backup research, and the investor should be prepared to act quickly after the stock triggers a technical buy signal (breaks above its pivot point on more than +50% average turnover) but before it gets too extended from a sound base. In the event of a "breakaway gap" there is one exception to the usual rules, and yet disciplined investors know to buy as near as possible to the pivot point and avoid chasing stocks after they have rallied far above their pivot point. It is crucial to always limit losses whenever any stock heads the wrong direction, and disciplined investors sell if a struggling stock ever falls more than -7% from their purchase price.
Expedia Inc (EXPE -$1.02 or -2.40% to $41.43) was highlighted in yellow in the 4/27/12 mid-day breakouts report (read here) after its considerable "breakaway gap" up above the pivot point cited based on its 3/26/12 high plus 10 cents. It reported earnings +63% on +12% sales revenues for the quarter ended March 31, 2012 versus the year ago period. Quarterly earnings have been above the +25% minimum guideline in 3 of the past 4 comparisons and its annual earnings (A criteria) history has been good. The number of top-rated funds owning its shares rose from 919 in Jun '11 to 978 in Mar '12, a reassuring sign concerning the I criteria. The Leisure - Travel Booking industry group has earned the highest possible Group Relative Strength Rating of 99/A+, a reassuring sign concerning the L criteria.
A breakaway gap is the one noted exception where the usual limit can be stretched to allow for disciplined investors to buy as much as +10% above the pivot point. Longtime readers know that the regular limit above the pivot point is +5%, and the further one chases a stock above its pivot point will increase the likelihood that an ordinary pullback of -7-8% might prompt them to sell based on the fact-based system's strict selling rules. Although approximately 40% of successful breakouts pull back to test support near their prior highs before continuing higher, historic studies also suggest that buying on strength yields far better results than buying stocks on their pullbacks.