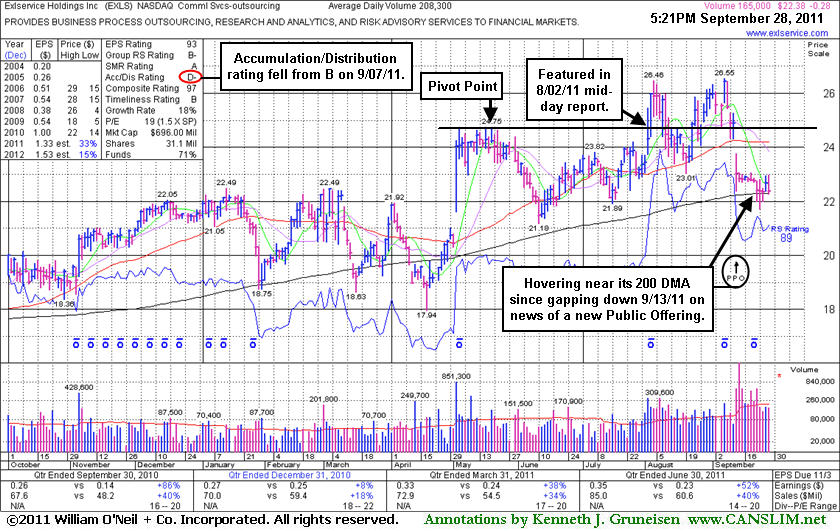
Exlservice Holdings Inc (EXLS -$0.11 or -0.46% to $22.56) has been testing support at its 200-day moving average (DMA) line with lighter than average volume on recent sessions following damaging losses with heavier volume that were indicative of distributional pressure. Its 50 DMA line may act as resistance if it rallies again, while a rebound above that short-term average is needed to truly help its outlook, technically. Its Accumulation/Distribution rating has fallen from a B to a D- since it was last shown in this FSU section on 9/07/11 with an annotated graph under the headline, "Gain With Twice Average Volume Lifts Firm Above 'Max Buy' Level". After barely trading above its earlier high, it promptly slumped back near its prior highs and its 50 DMA line. Then, rather than finding support, it gapped down and triggered a technical sell signal on 9/13/11 following news of a new Public Offering. More damaging losses leading to a violation of its 200 DMA and recent lows may trigger another more worrisome technical sell signal. That may prompt it to be dropped from the Featured Stocks list, meanwhile it is already -15% off its 52-week high.
It reported earnings +52% on +40% sales revenues for the quarter ended June 30, 2011 versus the year ago period. Quarterly comparisons (C criteria) have shown mostly impressive sales and earnings increases. A downturn in its FY '08 earnings was previously noted as a small flaw with respect to the A criteria of the fact-based investment system.
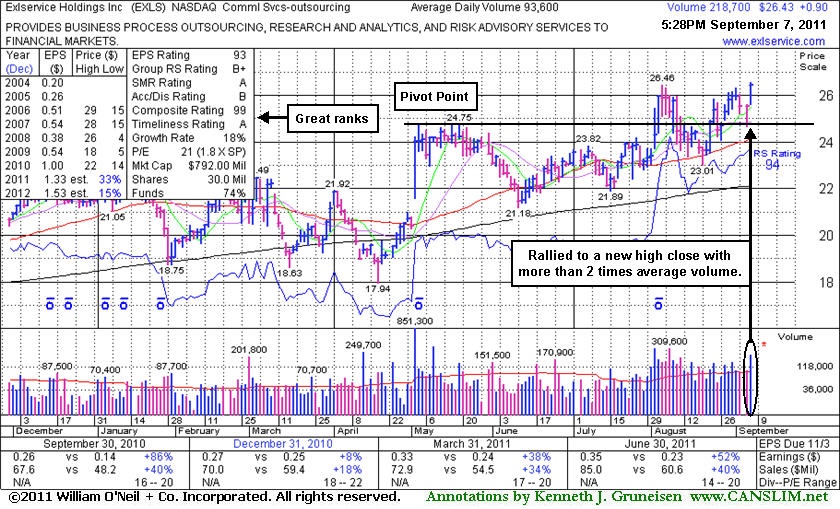
Its Accumulation/Distribution rating has still been improving, and the current Up/Down Volume Ratio of 1.3 is indicative of recent institutional accumulation. It reported earnings +52% on +40% sales revenues for the quarter ended June 30, 2011 versus the year ago period. Quarterly comparisons (C criteria) have shown mostly impressive sales and earnings increases. Downturn in its FY '08 earnings was previously noted as a small flaw with respect to the A criteria of the fact-based investment system.
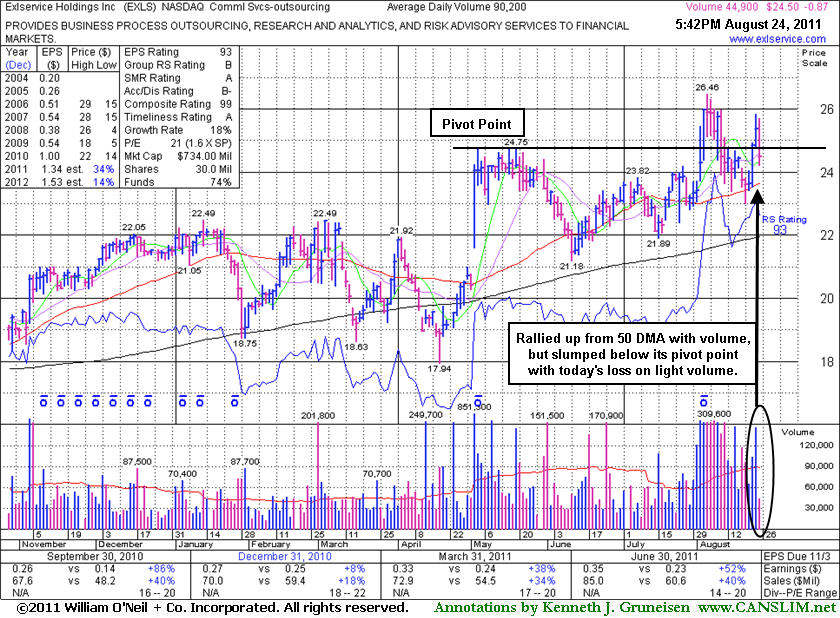
Exlservice Holdings Inc (EXLS -$0.87 or -3.43% to $24.50) slumped back under its pivot point again today with a loss on lighter than average volume. The recent low ($23.01 on 8/19/11) and its 50-day moving average (DMA) line define important support to watch above its 200 DMA line. It found prompt support and rallied from its 50 DMA line with volume-driven gains since last shown in this FSU section on 8/15/11 with an annotated graph under the headline, "Slump Below Prior High Closes Raises Concerns". Its Accumulation/Distribution rating also improved from C- to B- since its last FSU appearance. No resistance remains due to overhead supply. Tuesday's big gains for the broader market (M criteria) support investors making new buying efforts, although the new rally was confirmed by a follow-through day with only scant new leadership.
It reported earnings +52% on +40% sales revenues for the quarter ended June 30, 2011 versus the year ago period. Quarterly comparisons (C criteria) have shown mostly impressive sales and earnings increases. Downturn in its FY '08 earnings was previously noted as a small flaw with respect to the A criteria of the fact-based investment system.
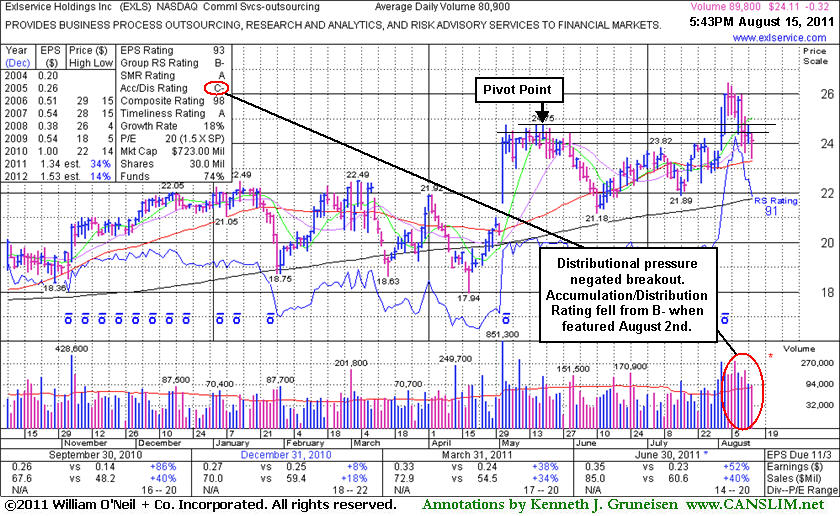
Exlservice Holdings Inc (EXLS -$0.32 or -1.31% to $24.11) suffered a loss today that led to a close below its high closes in May, negating its 8/03/11 breakout and raising more concerns. Its 50-day moving average (DMA) line (now $23.29) defines important support to watch. It was last shown in this FSU section on 8/02/11 with an annotated graph under the headline, "Finish In Lower Half Of Intra-Day Range Indicates Distribution", as it finished in the lower half of its intra-day range and below its pivot point, a sign it was encountering distributional pressure following a considerable gap up gain for a new 52-week high. Although it powered higher on the next session and technically triggered a buy signal, and no resistance remains due to overhead supply, the weak action in the broader market (M criteria) has been noted as an overriding concern arguing against new buying efforts until a new rally confirmed with a solid follow-through day occurs.
Its Accumulation/Distribution rating fell from B- to C- (see small red circle) since August 2nd when it was first featured, raising some concerns. It reported earnings +52% on +40% sales revenues for the quarter ended June 30, 2011 versus the year ago period. Quarterly comparisons (C criteria) have shown mostly impressive sales and earnings increases. Downturn in its FY '08 earnings was previously noted as a small flaw with respect to the A criteria of the fact-based investment system.
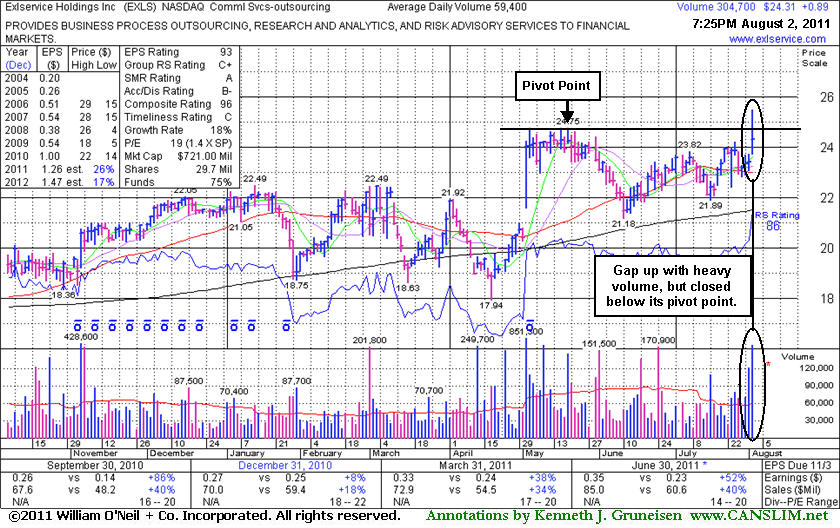
Exlservice Holdings Inc (EXLS +$0.89 or +3.80% to $24.31) finished in the lower half of its intra-day range today and below its pivot point, a sign it was encountering distributional pressure following a considerable gap up gain for a new 52-week high. No resistance remains due to overhead supply. In today's mid-day report its color code was changed to yellow with pivot point cited based on its 5/19/11 high plus 10 cents. A powerful breakout could trigger a technical buy signal, however weak action in the broader market (M criteria) is an overriding concern arguing against new buying efforts until a new rally confirmed with a solid follow-through day occurs.
Reported earnings +52% on +40% sales revenues for the quarter ended June 30, 2011 versus the year ago period. Quarterly comparisons (C criteria) have shown mostly impressive sales and earnings increases. Downturn in its FY '08 earnings was previously noted as a small flaw with respect to the A criteria of the fact-based investment system. Found support near its prior resistance in the $22 area during its consolidation since noted in the 5/12/11 mid-day report.