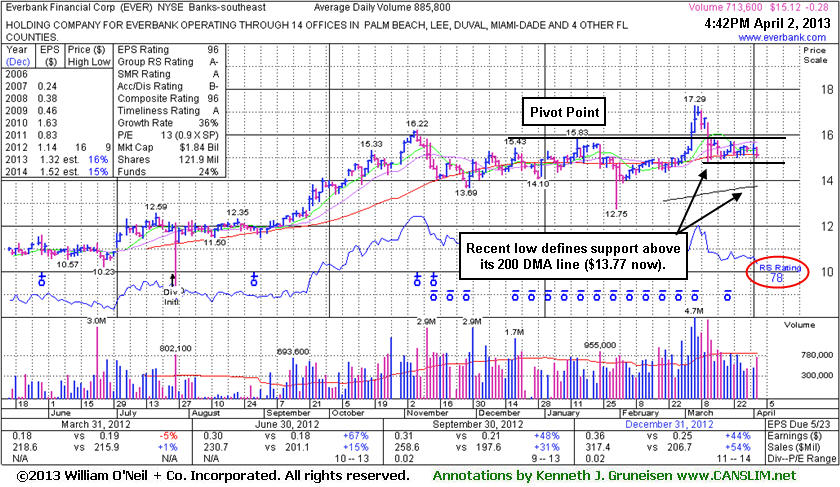
Close Below 50-Day Moving Average Raises Concern - Tuesday, April 02, 2013
Everbank Financial Corp (EVER -$0.28 or -1.82% to $15.12) slumped to a close just below its 50-day moving average (DMA) line ($15.16 now) today raising additional concerns. That important short-term average has acted as support ever since damaging losses violated prior highs in the $16 area. The recent low of $14.78 on 3/12/13 defines near-term support above its longer-term 200 DMA line.
It was last shown in this FSU section on 3/04/13 with an annotated graph under the headline, "Financial Firm Has Formed Ideal Base But Needs Confirming Gains", after highlighted in yellow with pivot point cited based on its 1/15/13 high while building on a "double bottom" base pattern in the mid-day report (read here). Soon thereafter it produced volume-driven gains above its pivot point to trigger a technical buy signal, but it stalled and negated the breakout by closing back in the prior base. Disciplined investors avoid chasing extended stocks more than +5% above their pivot point and always limit losses by selling if any stock falls more than -7% from their purchase price.
It reported earnings +44% on +54% sales revenues for the Dec '12 quarter satisfying the C criteria with its 3rd quarter with earnings above the +25% minimum guideline (C criteria)." The number of top-rated funds owning its shat res rose from 101 in Jun '12 to 147 in Dec '12 a reassuring sign concerning the I criteria. The Banks - Southeast industry group has a high 88 Relative Strength Rating while other strong leadership in the group also helps in satisfying the L criteria.
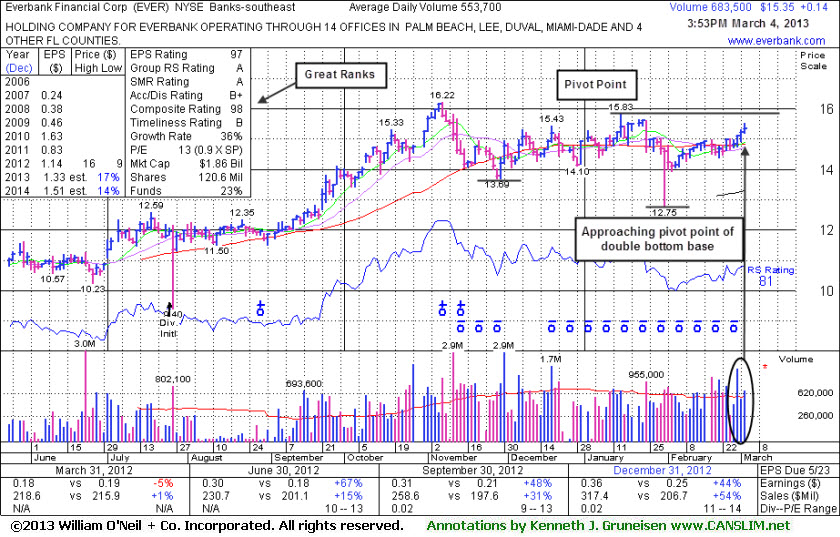
Financial Firm Has Formed Ideal Base But Needs Confirming Gains - Monday, March 04, 2013
Often, when a leading stock is setting up to breakout of a solid base it is highlighted in CANSLIM.net's Mid-Day Breakouts Report. The most relevant factors are noted in the report which alerts prudent CANSLIM oriented investors to place the issue in their watch list. After doing any necessary backup research, the investor is prepared to act after the stock triggers a technical buy signal (breaks above its pivot point on more than +50% average turnover) but before it gets too extended from a sound base. In the event the stock fails to trigger a technical buy signal and its price declines then it will simply be removed from the watch list. Disciplined investors know to buy as near as possible to the pivot point and avoid chasing stocks after they have rallied more than +5% above their pivot point. It is crucial to always limit losses whenever any stock heads the wrong direction, and disciplined investors sell if a struggling stock ever falls more than -7% from their purchase price.
Everbank Financial Corp (EVER +$0.16 or +1.05% to $15.37) was highlighted in yellow with pivot point cited based on its 1/15/13 high while building on a "double bottom" base pattern in the earlier mid-day report (read
here). It needs subsequent volume-driven gains above its pivot point to trigger a technical buy signal, meanwhile the market (M criteria) also needs to confirm a new rally to signal that odds are favorable for investors.It reported earnings +44% on +54% sales revenues for the Dec '12 quarter satisfying the C criteria with its 3rd quarter with earnings above the +25% minimum guideline (C criteria)." The number of top-rated funds owning its shatres rose from 101 in Jun '12 to 147 in Dec '12 a reassuring sign concerning the I criteria. The Banks - Southeast industry group has a high 88 Relative Strength Rating while other strong leadership in the group also helps in satisfying the L criteria.